

Abstract
Ca2+ inward current and fura-2 Ca2+ transients were simultaneously recorded in porcine myotubes. Myotubes from normal pigs and cells from specimens homozygous for the Arg615Cys (malignant hyperthermia) mutation of the skeletal muscle ryanodine receptor RyR1 were investigated. We addressed the question whether this mutation alters the voltage dependence of Ca2+ release from the sarcoplasmic reticulum.
The time course of the total flux of Ca2+ into the myoplasm was estimated. Analysis showed that the largest input Ca2+ flux occurred immediately after depolarization. Amplitude and time course of the Ca2+ flux at large depolarizations were not significantly different in the Arg615Cys myotubes.
Ca2+ release from the sarcoplasmic reticulum was activated at more negative potentials than the L-type Ca2+ conductance. In the controls, the potentials for half-maximal activation (V½) were -9.0 mV and 16.5 mV, respectively.
In myotubes expressing the Arg615Cys mutation, Ca2+ release was activated at significantly lower depolarizing potentials (V½= -23.5 mV) than in control myotubes. In contrast, V½ of conductance activation (13.5 mV) was not significantly different from controls.
The specific shift in the voltage dependence of Ca2+ release caused by this mutation can be well described by altering a voltage-independent reaction of the ryanodine receptor that is coupled to the voltage-dependent transitions of the L-type Ca2+ channel.
Malignant hyperthermia is a life-threatening pharmacogenetic hypermetabolic state that can be observed in susceptible individuals during general anaesthesia. It results from excessive Ca2+ release from the sarcoplasmic reticulum (SR) of skeletal muscle under the influence of volatile anaesthetics and/or depolarizing muscle relaxants (MacLennan & Phillips, 1992; Mickelson & Louis, 1996). In the majority of cases, this inherited muscle disorder is caused by point mutations of the SR Ca2+ release channel RyR1 (type 1 isoform of the ryanodine receptor; Jurkat-Rott et al. 2000).
A homologue of one of the most frequently found human RyR1 mutations (Arg614Cys) is also present in pigs (Arg615Cys) causing a similar phenotype when expressed homozygously and giving rise to porcine stress syndrome (PSS). As in humans, a higher sensitivity to volatile anaesthetics and Ca2+ releasing agents such as caffeine was found (Iaizzo & Lehmann-Horn, 1989). Ca2+ release in skeletal muscle is controlled by interaction of RyR1 with the α1S-subunit of the dihydropyridine (DHP) receptor that functions as a sensor of the plasma membrane voltage (Melzer et al. 1995). It has been reported that muscle from pigs carrying the Arg615Cys mutation responds more readily to depolarization by solutions with elevated potassium concentrations (Gallant & Donaldson, 1989; Gallant & Lentz, 1992; Gallant & Jordan, 1996). Furthermore, a decreased voltage threshold for activation of contraction has been demonstrated in myotubes from pigs with this mutation (Gallant & Jordan, 1996). These results point to an altered voltage control of SR Ca2+ release.
To investigate this question we studied myotubes of pigs homozygous for the Arg615Cys mutation (malignant hyperthermia-susceptible (MHS) pigs). We simultaneously monitored Ca2+ inward currents and fura-2 Ca2+ transients under voltage-clamp conditions to compare signals originating from the DHP receptor and from the Ca2+ release channel.
METHODS
Genetic analysis
Pietrain pigs, homozygous for the Arg615Cys mutation, and German Landrace pigs, homozygous for the wild-type, were used for the experiments. The animals were genetically tested using genomic DNA isolated from blood leucocytes. The primers MH1 (5′-GTT CCC TGT GTG TGT GCA AT-3′) and MH3 (5′-CGT GTG ACA TAG ATG AGG TTT G-3′) were used for polymerase chain reaction (PCR). Amplified DNA was subjected to restriction enzyme digestion (HhaI, Pharmacia) and agarose gel electrophoresis. Homozygous mutants showed an undigested 118 bp fragment while homozygous normal animals showed two fragments of 85 bp and 33 bp.
Cell culture
Two- to three-month-old pigs were anaesthetized and killed with barbiturate or propofol, in accordance with the regulations of the local ethics committee. Pieces of the longissimus dorsi muscle (0.5 g) were excised. The muscle samples were transferred to the laboratory in Hanks’ solution (0°C). To isolate the satellite cells (Brinkmeier et al. 1993), the muscle samples were cut into small pieces with fine scissors and subjected to enzymatic dissociation with gentle agitation for 60 min at 37°C. The dissociation solution consisted of F12 medium (Gibco) containing 1.5 mg ml−1 collagenase (17449, Serva I), 2 mg ml−1 protease (P6141, Sigma Type IX), 50 μg ml−1 gentamicin (Biochrom) and 2 mM Hepes, pH 7.2. After filtering (pore size 50 μm), the resulting suspension was centrifuged and the pellet was resuspended in growth medium: F12 solution with 15 % fetal calf serum (Gibco) and 2 % chicken embryo extract (Gibco). The culture was preplated for 20 min to reduce the number of fibroblasts and the cells remaining in suspension were then seeded into culture flasks with growth medium. Four days later the cells were detached from the flask by trypsin (0.15 % trypsin and 0.08 % EDTA in Ca2+ and Mg2+ free phosphate buffered saline (PBS), all compounds from Biochrom) and plated on carbon and collagen coated coverslips. The next day the medium was changed to Dulbecco's modified Eagle's medium (DMEM) with 5 % horse serum (both from Gibco) to induce differentiation. Most cells were measured 2 to 5 days after reduction of the serum concentration. Intermediate sized myotubules devoid of branches were selected to obtain acceptable calcium transients and voltage control. The criteria of selection were the same for the two groups of myotubes and consequently the passive electrical parameters were similar (Fig 4A, legend).
Figure 4. Voltage dependence of Ca2+ conductance and Ca2+ release in MHS and control myotubes.
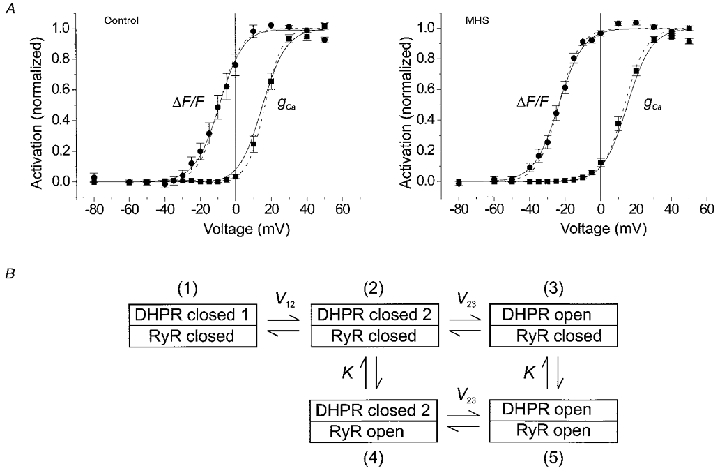
A, Ca2+ conductance (▪) and Ca2+ release data (•) from experiments on control (left) and MHS myotubes (right) plotted as a function of test voltage. The main effect in MHS was a left-shift of the activation curve for Ca2+ release. The averaged best fit parameter values of individual fits by eqns (1) and (2) were as follows. Control (n = 9): gCa,max= 66.2 ± 10.5 pS pF−1, VCa= 52.2 ± 3.2 mV, V½= 16.5 ± 1.3 mV, k = 4.9 ± 0.4 mV. Fluorescence: V½= -9.0 ± 2.4 mV, k = 6.0 ± 0.4 mV. MHS (n = 19): gCa,max= 85.0 ± 11.7 pS pF−1, VCa= 53.0 ± 1.8 mV, V½= 13.5 ± 1.2 mV, k = 6.1 ± 0.2 mV. Fluorescence: V½= -23.5 ± 1.2 mV, k = 6.0 ± 0.4 mV. Dashed curves were drawn using these parameter values. Maximal inward current, maximal inward current density and voltage of maximal inward current were not significantly different: -357 ± 58 pA, -2.14 ± 0.27 pA pF−1 and 21.7 ± 1.1 mV in the MHS group versus -347 ± 86 pA, -1.62 ± 0.36 pA pF−1 and 23.7 ± 1.3 mV, respectively, in the control group. The same was true for cell capacitance, series resistance, gleak and Vleak: 189 ± 21 pF, 11.3 ± 1.9 MΩ, 1.85 ± 0.52 nS and -2.3 ± 5.9 mV for MHS versus 216 ± 33 pF, 12.9 ± 3.2 MΩ, 1.68 ± 0.50 nS and 9.5 ± 10.7 mV, respectively, for the controls. The means include data from experiments with a slightly different internal solution (fluo-3 instead of fura-2 or no ATP and creatine phosphate). When only the experiments with standard internal solution (see Methods) and with fura-2 were used, very similar results were obtained: V½= 13.8 ± 1.9 mV and k = 6.0 ± 0.3 mV (MHS, n = 7) versusV½= 16.8 ± 3.0 mV and k = 4.5 ± 0.4 mV (control, n = 4). The corresponding parameters for Ca2+ release were V½= -20.9 ± 1.5 mV and k = 5.4 ± 0.5 mV (MHS) versusV½= -7.8 ± 2.8 mV and k = 5.6 ± 0.7. This group allowed absolute estimates of resting [Ca2+] and Δ[Ca2+] (determined at +20 mV; note small amplitudes due to high [EGTA]). The values showed considerable scattering and no significant difference: 110 ± 40 nM and 23 ± 4 nM (MHS) versus 51 ± 18 nM and 14 ± 4 nM (control), respectively. B, reaction scheme for coupled DHPR-RyR gating. The model assumes three states of the L-type Ca2+ channel: resting (DHPR closed 1), pre-active (DHPR closed 2) and open (DHPR open) with voltage-dependent transitions. The ryanodine receptor is either shut (RyR closed) or open (RyR open). When the L-type channel is in the resting state (1) the ryanodine receptor is assumed to have a negligible open probability. The equilibrium constants of the ryanodine receptor gating reactions associated with the pre-active and the open configuration of the L-type channel are assumed to be identical (K). The model was used to fit the data in A (continuous curves). A simultaneous fit to control and MHS data was carried out resulting in the following set of parameter values: V12= 22.6 mV, V23= 15.0 mV, k12= 7.0 mV, k23= 6.9 mV, K = 0.0014 (MHS), K = 0.011 (control). Note that small K values mean that the equilibrium is largely on the side of opening. The result shows that a change in K alone can explain the selective shift of V½ for Ca2+ release to a more negative value.
Solutions
The experimental solutions were made of the following components. Bathing solution was composed of (mM): 140 tetraethylammonium hydroxide (TEAOH), 135 HCl, 10 CaCl2, 1 MgCl2, 10 Hepes, 2.5 4-aminopyridine (4-AP), 0.1 EGTA, 0.0013 tetrodotoxin (TTX); pH 7.4. Pipette solution was (mM): 150 CsOH, 135 HCl, 0.66 CaCl2 (resulting in 20 nM free Ca2+), 0.5 MgCl2, 10 Hepes, 5 EGTA, 5 MgATP, 5 sodium creatine phosphate, 0.2 fura-2 (pentapotassium salt), pH 7.2. In 12 experiments 400 μm fluo-3 instead of 200 μm fura-2 was used.
Current measurements and analysis
Myotubes were voltage clamped as described in Dietze et al. (1998). The pCLAMP6.0 software package (Axon Instruments) and Excel (Microsoft) were used for analysis. The last 8 ms before the end of the stimulus were averaged to obtain the voltage dependence of current and fluorescence. The current-voltage relations were least-squares fitted with eqn (1)
| (1) |
where
| (2) |
gleak and Vleak are conductance and reversal potential of a leak component, respectively, and gCa,max and VCa are maximal conductance and reversal potential, respectively, of the L-type Ca2+ current. f(V) represents voltage dependence of activation; V½ and k, voltage of half-maximal activation and voltage sensitivity, respectively.
Fluorescence measurements
Coverslips carrying the myotubes were mounted in a Plexiglas chamber on an inverted epifluorescence microscope (IMT-2, Olympus) equipped with a microscope photometer (SF, Zeiss, photomultiplier tube: R 928, Hamamatsu). Fura-2 fluorescence was measured at the emission wavelength of 510 nm. Excitation wavelengths of 380 nm (for Ca2+ signals) and 358 nm (isosbestic point) were used. In the case of the fluo-3 measurements the excitation and emission wavelengths were 485 and 530 nm, respectively. ΔF/F, the depolarization-induced fluorescence change divided by the resting fluorescence at the same wavelength, was used to determine the voltage dependence of the release process.
All experiments were carried out at room temperature (20-23°C). Mean data are presented and plotted as means ±s.e.m. (n = number of cells). Student's t test was used to test for significant differences of mean values (P = 0.05).
RESULTS
To investigate the dynamics of the flux of Ca2+ entering the myoplasm during a depolarization in porcine myotubes, we determined the time derivative of an approximate estimate of the total myoplasmic Ca2+. The fluorescence ratio R, i.e. the fluorescence signal at 380 nm excitation divided by the resting fluorescence at 358 nm excitation (recorded 1 s before each voltage-clamp pulse) was converted to the concentration of free Ca2+. In this step, correction of non-instantaneous binding of Ca2+ by fura-2 was made (see Klein et al. 1988, Dietze et al. 1998). The result was used to calculate the occupancy of the intracellular binding components that are thought to capture most of the released Ca2+. The EGTA diffusing into the cell from the pipette provided the main Ca2+ buffer component under our conditions and its kinetic parameters were therefore dominant for the analysis result. Calculations using in vitro rate constants of EGTA, determined by Smith et al. (1984), produced a transient negative phase after termination of the pulse (Fig. 1A). A comparable phase could not be detected in the corresponding free Ca2+ transients (not shown). The most effective way to reduce the undershoot and to ensure that the flux returns close to baseline values after repolarization, was to increase both rate constants (Fig. 1B; see legend for further details).
Figure 1. Determination of the time course of Ca2+-input flux.
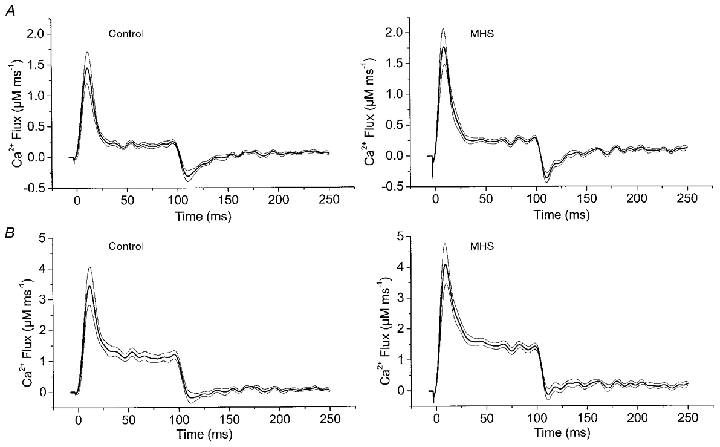
An estimate of the total flux of Ca2+ into the myoplasm (Ca2+-input flux) was obtained by the general procedure of Baylor et al. (1983). The Ca2+ flux was calculated (for equations see Baylor et al. 1983 and Brum et al. 1988) considering fura-2 (0.2 mM), EGTA (5 mM) and troponin C (0.24 mM of fast Ca2+-specific T sites and 0.24 mM of slow Ca2+-Mg+ sites with parvalbumin-type behaviour, P-sites; rate constants from Baylor & Hollingworth, 1998). The parameter values used were as follows: T sites: kon,Ca,T= 88.5 μm−1 s−1, koff,Ca,T= 115 s−1; P sites: kon,Ca,P= 41.7 μm−1 s−1, koff,Ca,P= 0.5 s−1; kon,Mg,P= 0.033 μm−1 s−1, koff,Mg,P= 3 s−1. For EGTA we chose the rate constants of Smith et al. (1984): kon,Ca,EGTA= 1.5 μm−1 s−1, koff,Ca,EGTA= 0.3 s−1. This set of parameters produced a transient phase of negative flux after repolarization (A). To reduce this phase we had to increase the published in vitro rate constants of EGTA by a factor of 10 at constant KD (B). This adjustment did not alter the general shape of the signals during the depolarization. For comparison of amplitude and time course we determined the four parameters PV, EV, TTP and HTD (see text). In A, the values were 1.99 ± 0.25 μm ms−1, 0.27 ± 0.03 μm ms−1, 9.7 ± 1.0 ms and 15.3 ± 1.2 ms for MHS versus 1.67 ± 0.24 μm ms−1, 0.22 ± 0.03 μm ms−1, 11.5 ± 1.5 ms and 16.8 ± 1.5 ms for control. In B values were 4.6 ± 0.6 μm ms−1, 1.4 ± 0.1 μm ms−1, 10.5 ± 1.1 ms and 16.4 ± 1.3 ms for MHS versus 3.9 ± 0.6 μm ms−1, 1.1 ± 0.1 μm ms−1, 12.3 ± 1.5 ms and 17.6 ± 1.5 ms for control. They showed no significant difference. Mean results of 10 control and 11 MHS measurements. Thin lines indicate s.e.m.
Even though flux calculated in this way (Fig. 1) can only be a rather crude estimate due to the uncertainties in the kinetic constants and concentrations, the following conclusions proved to be independent of the choice of constants. The input flux reaches a maximum at the beginning of the pulse and declines during the pulse. It, therefore resembles estimates in other vertebrate muscle cells that show a higher rate of Ca2+ mobilization early during depolarization (e.g. Melzer et al. 1987; Shirokova et al. 1996; Dietze et al. 1998). The flux drops almost instantaneously at the time of repolarization. Neither time course nor amplitude differed significantly in the MHS myotubes compared with controls as judged by comparing the following signal parameters of the two groups of cells: peak value (PV), value at the end of pulse (EV), time from pulse onset to peak (TTP) and half time of decay (HTD) during the pulse (see legend of Fig. 1).
Due to the involvement of time derivatives the flux calculations are sensitive to noise. Because the limited life-time of the myotubes in the whole-cell configuration did not allow extensive signal averaging the input flux analysis had to be restricted to one voltage (+20 mV). To investigate the voltage dependence of Ca2+ release we, therefore, used the Ca2+-dependent fluorescence transients. Figure 2 shows an example experiment on a myotube from a normal pig. Simultaneously with fluorescence (Fig. 2B), we measured the activation of the slow Ca2+ inward current (L-type current, Fig. 2A). Depolarizing pulses of 100 ms duration were applied. The pulses were separated by intervals of 20 s to allow for recovery from the previous activation. Figure 2C and E show the voltage dependence of both signals.
Figure 2. Ca2+ current and Ca2+ transients in a normal porcine myotube.
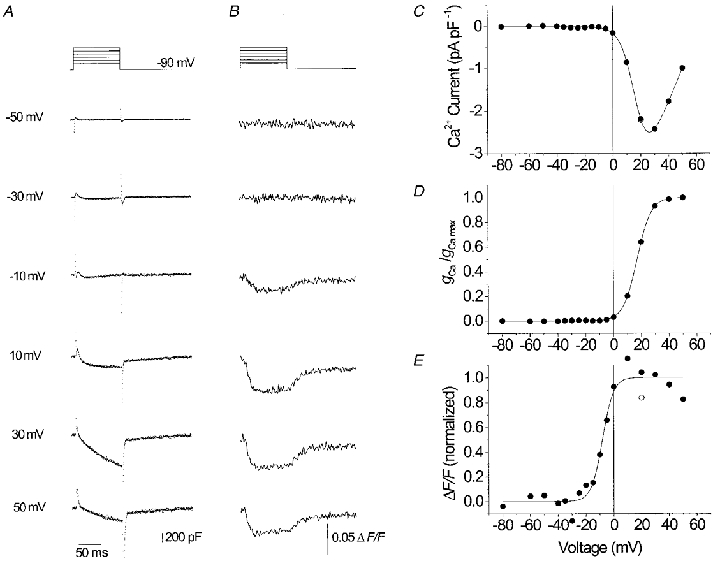
L-type Ca2+ inward currents (A) and fura-2 fluorescence signals (B) recorded at voltage-clamp steps from -90 mV to values between -50 and +50 mV. C, current-voltage relation. D, voltage dependence of Ca2+ conductance activation. E, voltage dependence of activation of the Ca2+ signal. The free calcium concentration determined prior to pulse activation (resting [Ca2+]) was 16 nM, the increase (Δ[Ca2+]) at +20 mV was 10 nM. The best fit parameter values (see Methods, eqns (1) and (2)) were as follows, current: gCa,max= 80.8 pS pF−1, VCa= 62.2 mV, V½= 17.0 mV, k = 5.1 mV. Fluorescence: V½= -8.2 mV, k = 4.0 mV.
It can be noticed that the Ca2+ signal (Fig. 2E) is activated at more negative voltages (V½= -8.2 mV) than the L-type conductance (Fig. 2D; V½= 17.0 mV). Consequently, at 0 mV the inward current is just slightly above threshold, while the Ca2+ signal has already reached about 80 % of its maximal value. At large depolarizations, a decline of the Ca2+ signal amplitude can be noticed. Most of the decline appeared to be due to a run down of Ca2+ release as could be shown by repeating a test pulse to +20 mV at the end of the sequence (open symbol).
Figure 3 shows Ca2+ currents and fura-2 Ca2+ signals simultaneously measured at different potentials in a single MHS myotube. Again, Ca2+ signals became activated at more negative potentials than Ca2+ conductance (Fig. 3D and E). However, the difference between V½ values of Ca2+ signal and conductance is clearly larger than in the experiment of Fig. 2 (41.5 versus 25.2 mV). A Ca2+ signal was already measured at -30 mV (Fig. 3B) whereas the control myotube of Fig. 2B showed no response at this potential.
Figure 3. Ca2+ current and Ca2+ transients in an MHS myotube.
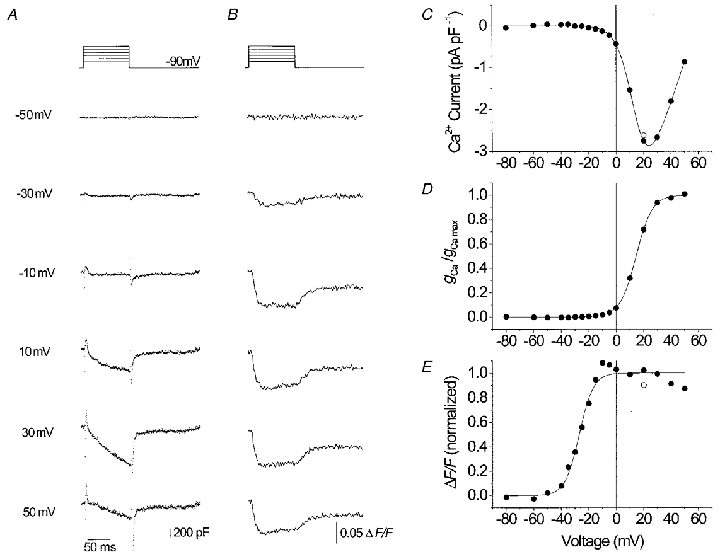
L-type Ca2+ inward currents (A) and fluorescence signals (B) recorded at voltage-clamp steps from -90 mV to values between -50 and +50 mV. C, current-voltage relation. D, voltage dependence of Ca2+ conductance activation. E, voltage dependence of activation of the Ca2+ signal. Resting [Ca2+]: 56 nM, Δ[Ca2+] at +20 mV: 22 nM. Best fit parameters, current: gCa,max= 99.2 pS pF−1, VCa= 58.6 mV, V½= 14.5 mV, k = 5.9 mV. Fluorescence: V½= -27.0 mV, k = 5.2 mV.
Figure 4A shows the average results of 9 control and 19 MHS myotubes. Apart from a modest difference in the steepness of the Ca2+ conductance activation (k = 6.1 ± 0.2 versus 4.9 ± 0.4 mV in controls, P = 5.4 × 10⁻³), no significant differences were found in the current measurements between the two groups of cells. Also the passive electrical characteristics were very similar (see legend of Fig. 4).
On the other hand, the MHS myotubes showed a 14.5 mV shift of the activation curve for Ca2+ release (V½= -23.5 ± 1.2 versus -9.0 ± 2.4 mV in controls). Student's t test indicated a highly significant (P = 2.1 × 10⁻⁶) difference between the two V½ values.
Thus in conclusion, the mutation caused a shift of Ca2+ release activation to more negative potentials. The voltage dependence of the L-type Ca2+ conductance showed no comparable alteration and the maximum Ca2+ release rate and its time course at large depolarization appeared to be unchanged.
DISCUSSION
Only a small number of investigations on cultured myocytes is available in which the voltage-dependent activation of L-type Ca2+ current and intracellular Ca2+ signals have been directly compared (Garcia & Beam, 1994; Strube et al. 1996; Dietze et al. 1998). As described in these investigations, in the porcine cells studied here, Ca2+ release from the SR appeared at more negative potentials than the Ca2+ inward current. This is compatible with sequential reaction schemes for a dual control mechanism of the DHP receptor in which transitions between closed states – involved in gating the Ca2+ release channel of the SR – occur before the transition to the open state that allows Ca2+ entry from the extracellular space (Garcia et al. 1994).
RyR1 mutations causing malignant hyperthermia indicate functionally important locations of the Ca2+ release channel. In addition to modifying the response to chemical agonists (Otsu et al. 1994; Tong et al. 1997) they might influence the physiological interaction between the ryanodine and DHP receptors which could show up in alterations of Ca2+ conductance or of Ca2+ release. The voltage of half-maximal Ca2+ conductance and the maximal conductance per linear capacitance were not significantly different, but the steepness of the Ca2+ conductance activation curve was lowered. A similar change in voltage sensitivity is also evident from the current-voltage relations shown by Gallant et al. (1996). This may indicate a mild alteration in retrograde transmission from RyR1 to the DHP receptor (Fleig et al. 1996; Nakai et al. 1996; Grabner et al. 1999).
The selective shift of the activation curve for Ca2+ release by about 15 mV that we describe here fits well with observations by Gallant and co-workers on altered threshold concentrations of potassium for contractile activation in adult porcine muscle (Gallant & Donaldson, 1989; Gallant & Lentz, 1992). Furthermore, our experiments on myotubes show that the lowering of rheobase voltage for contractile activation from -6.9 to -22.6 mV reported by Gallant & Jordan (1996) can in fact be attributed to modified characteristics of voltage activation of Ca2+ release.
One may wonder how the voltage dependence of Ca2+ release can be changed without a corresponding change in the voltage dependence of L-type Ca2+ conductance if release and conductance activation are subsequent events caused by the same voltage sensor molecules (Garcia et al. 1994). The scheme in Fig. 4B (see figure legend for details) shows one possible explanation. In this five-state model, states three and five contribute to Ca2+ conductance while states four and five generate Ca2+ release. Equations (3) and (4) describe the probabilities of the corresponding state occupancies as functions of voltage
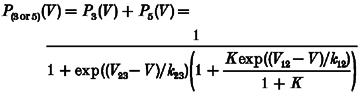 |
(3) |
and
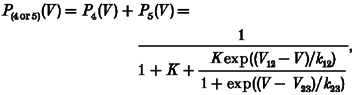 |
(4) |
where V12 and V23 are the voltages for 1:1 distribution and k12, k23 the voltage sensitivity constants for the 1-2 transitions and 2-3 transitions, respectively. K is the equilibrium constant for the RyR1 open-closed reaction (vertical transitions).
This model predicts strong changes in the voltage for half-maximal activation of Ca2+ release when changing the voltage-independent equilibrium constant K. The reaction described by K might be linked to the ligand-modulated gating of the isolated ryanodine receptor (e.g. Laver et al. 1997; Owen et al. 1997). The continuous curves in Fig. 4A show least-squares fits of eqns (3) and (4) to the experimental data. An eightfold decrease in K (causing a larger degree of opening at constant voltage) produced the selective negative shift of V½ of Ca2+ release. Thus, despite the fact that Ca2+ current and Ca2+ release activation have a voltage-dependent step in common (1-2 transition), only the voltage dependence of Ca2+ release is changed by varying the single voltage-independent parameter K. The model also shows that a change causing the observed effect may be completely independent of the actual mechanism that couples RyR1 to the voltage sensor. The mutation may, therefore, be far from the coupling region.
In summary, our measurements showed a selective shift in the voltage dependence of Ca2+ release activation to more negative potentials in porcine MHS myotubes. Thus, Arg615Cys does not only promote ligand-induced Ca2+ release but also the depolarization-induced release controlled by the DHP receptor voltage sensor. A simple model shows that one does not have to postulate a change in interaction domains of the ryanodine receptor with the DHP receptor nor two different forms of DHP receptors (inward-current generating and Ca2+ release activating) to explain these results.
Acknowledgments
We thank Drs W. Erhardt, H. Brinkmeier and R. Rüdel for support, stimulating discussions and the use of laboratory equipment, Mrs M. Rudolf-Dauner, Mrs S. Schäfer and Mr E. Schoch for expert technical help and Dr A. Struk and Mr R. P. Schuhmeier for providing calculation software. The project was supported by the IZKF-Ulm and by grants of the European Community (ERB-FMRX-CT96-0032) and the Deutsche Forschungsgemeinschaft (Me-713/10-1/2) to W.M.
References
- Baylor SM, Chandler WK, Marshall MW. Sarcoplasmic reticulum calcium release in frog skeletal muscle fibres estimated from Arsenazo III calcium transients. The Journal of Physiology. 1983;344:625–666. doi: 10.1113/jphysiol.1983.sp014959. [DOI] [PMC free article] [PubMed] [Google Scholar]
- Baylor SM, Hollingworth S. Model of sarcomeric Ca2+ movements, including ATP Ca2+ binding and diffusion, during activation of frog skeletal muscle. Journal of General Physiology. 1998;112:297–316. doi: 10.1085/jgp.112.3.297. [DOI] [PMC free article] [PubMed] [Google Scholar]
- Brinkmeier H, Seewald MJ, Eichinger HM, Rüdel R. Culture conditions for the production of porcine myotubes and myoballs. Journal of Animal Science. 1993;71:1154–1160. doi: 10.2527/1993.7151154x. [DOI] [PubMed] [Google Scholar]
- Brum G, Rios E, Stefani E. Effects of extracellular calcium on calcium movements of excitation-contraction coupling in frog skeletal muscle fibres. The Journal of Physiology. 1988;398:441–473. doi: 10.1113/jphysiol.1988.sp017052. [DOI] [PMC free article] [PubMed] [Google Scholar]
- Dietze B, Bertocchini F, Barone V, Struk A, Sorrentino V, Melzer W. Voltage-controlled Ca2+ release in normal and ryanodine receptor type 3 (RyR3)-deficient mouse myotubes. The Journal of Physiology. 1998;513:3–9. doi: 10.1111/j.1469-7793.1998.003by.x. [DOI] [PMC free article] [PubMed] [Google Scholar]
- Fleig A, Takeshima H, Penner R. Absence of Ca2+ current facilitation in skeletal muscle of transgenic mice lacking the type 1 ryanodine receptor. The Journal of Physiology. 1996;496:339–345. doi: 10.1113/jphysiol.1996.sp021689. [DOI] [PMC free article] [PubMed] [Google Scholar]
- Gallant EM, Balog EM, Beam KG. Slow calcium current is not reduced in malignant hyperthermic porcine myotubes. Muscle and Nerve. 1996;19:450–455. doi: 10.1002/(SICI)1097-4598(199604)19:4<450::AID-MUS4>3.0.CO;2-B. [DOI] [PubMed] [Google Scholar]
- Gallant EM, Donaldson SK. Skeletal muscle excitation-contraction coupling. II. Plasmalemma voltage control of intact bundle contractile properties in normal and malignant hyperthermic muscles. Pflügers Archiv. 1989;414:24–30. doi: 10.1007/BF00585622. [DOI] [PubMed] [Google Scholar]
- Gallant EM, Jordan RC. Porcine malignant hyperthermia: genotype and contractile threshold of immature muscles. Muscle and Nerve. 1996;19:68–73. doi: 10.1002/(SICI)1097-4598(199601)19:1<68::AID-MUS9>3.0.CO;2-6. [DOI] [PubMed] [Google Scholar]
- Gallant EM, Lentz LR. Excitation-contraction coupling in pigs heterozygous for malignant hyperthermia. American Journal of Physiology. 1992;262:C422–426. doi: 10.1152/ajpcell.1992.262.2.C422. [DOI] [PubMed] [Google Scholar]
- Garcia J, Beam KG. Measurement of calcium transients and slow calcium current in myotubes. Journal of General Physiology. 1994;103:107–123. doi: 10.1085/jgp.103.1.107. [DOI] [PMC free article] [PubMed] [Google Scholar]
- Garcia J, Tanabe T, Beam KG. Relationship of calcium transients to calcium currents and charge movements in myotubes expressing skeletal and cardiac dihydropyridine receptors. Journal of General Physiology. 1994;103:125–147. doi: 10.1085/jgp.103.1.125. [DOI] [PMC free article] [PubMed] [Google Scholar]
- Grabner M, Dirksen RT, Suda N, Beam KG. The II-III loop of the skeletal muscle dihydropyridine receptor is responsible for the bi-directional coupling with the ryanodine receptor. Journal of Biological Chemistry. 1999;274:21913–21919. doi: 10.1074/jbc.274.31.21913. [DOI] [PubMed] [Google Scholar]
- Iaizzo PA, Lehmann-Horn F. The in vitro determination of susceptibility to malignant hyperthermia. Muscle and Nerve. 1989;12:184–190. doi: 10.1002/mus.880120304. [DOI] [PubMed] [Google Scholar]
- Jurkat-Rott K, McCarthy T, Lehmann-Horn F. Genetics and pathogenesis of malignant hyperthermia. Muscle and Nerve. 2000;23:4–17. doi: 10.1002/(sici)1097-4598(200001)23:1<4::aid-mus3>3.0.co;2-d. [DOI] [PubMed] [Google Scholar]
- Klein MG, Simon BJ, Szücs G, Schneider MF. Simultaneous recording of calcium transients in skeletal muscle using high- and low-affinity calcium indicators. Biophysical Journal. 1988;53:971–988. doi: 10.1016/S0006-3495(88)83178-3. [DOI] [PMC free article] [PubMed] [Google Scholar]
- Laver DR, Owen VJ, Junankar PR, Taske NL, Dulhunty AF, Lamb GD. Reduced inhibitory effect of Mg2+ on ryanodine receptor-Ca2+ release channels in malignant hyperthermia. Biophysical Journal. 1997;73:1913–1924. doi: 10.1016/S0006-3495(97)78222-5. [DOI] [PMC free article] [PubMed] [Google Scholar]
- MacLennan DH, Phillips MS. Malignant hyperthermia. Science. 1992;256:789–794. doi: 10.1126/science.1589759. [DOI] [PubMed] [Google Scholar]
- Melzer W, Herrmann-Frank A, Lüttgau HC. The role of Ca2+ ions in excitation-contraction coupling of skeletal muscle fibres. Biochimica et Biophysica Acta. 1995;1241:59–116. doi: 10.1016/0304-4157(94)00014-5. [DOI] [PubMed] [Google Scholar]
- Melzer W, Rios E, Schneider MF. A general procedure for determining the rate of calcium release from the sarcoplasmic reticulum in skeletal muscle fibres. Biophysical Journal. 1987;51:849–863. doi: 10.1016/S0006-3495(87)83413-6. [DOI] [PMC free article] [PubMed] [Google Scholar]
- Mickelson JR, Louis CF. Malignant hyperthermia: excitation-contraction coupling, Ca2+ release channel, and cell Ca2+ regulation defects. Physiological Reviews. 1996;76:537–592. doi: 10.1152/physrev.1996.76.2.537. [DOI] [PubMed] [Google Scholar]
- Nakai J, Dirksen RT, Nguyen HT, Pessah IN, Beam KG, Allen PD. Enhanced dihydropyridine receptor channel activity in the presence of ryanodine receptor. Nature. 1996;380:72–75. doi: 10.1038/380072a0. [DOI] [PubMed] [Google Scholar]
- Otsu K, Nishida K, Kimura Y, Kuzuya T, Hori M, Kamada T, Tada M. The point mutation Arg615→Cys in the Ca2+ release channel of skeletal sarcoplasmic reticulum is responsible for hypersensitivity to caffeine and halothane in malignant hyperthermia. Journal of Biological Chemistry. 1994;269:9413–9415. [PubMed] [Google Scholar]
- Owen VJ, Taske NL, Lamb GD. Reduced Mg2+ inhibition of Ca2+ release in muscle fibers of pigs susceptible to malignant hyperthermia. American Journal of Physiology. 1997;272:C203–211. doi: 10.1152/ajpcell.1997.272.1.C203. [DOI] [PubMed] [Google Scholar]
- Shirokova N, Garcia J, Pizarro G, Rios E. Ca2+ release from the sarcoplasmic reticulum compared in amphibian and mammalian skeletal muscle. Journal of General Physiology. 1996;107:1–18. doi: 10.1085/jgp.107.1.1. [DOI] [PMC free article] [PubMed] [Google Scholar]
- Smith PD, Liesegang GW, Berger RL, Czerlinski G, Podolsky RJ. A stopped-flow investigation of calcium ion binding by ethylene glycol bis(beta-aminoethyl ether)-N, N′-tetraacetic acid. Analytical Biochemistry. 1984;143:188–195. doi: 10.1016/0003-2697(84)90575-x. [DOI] [PubMed] [Google Scholar]
- Strube C, Beurg M, Powers PA, Gregg RG, Coronado R. Reduced Ca2+ current, charge movement, and absence of Ca2+ transients in skeletal muscle deficient in dihydropyridine receptor beta 1 subunit. Biophysical Journal. 1996;71:2531–2543. doi: 10.1016/S0006-3495(96)79446-8. [DOI] [PMC free article] [PubMed] [Google Scholar]
- Tong J, Oyamada H, Demaurex N, Grinstein S, McCarthy TV, MacLennan DH. Caffeine and halothane sensitivity of intracellular Ca2+ release is altered by 15 calcium release channel (ryanodine receptor) mutations associated with malignant hyperthermia and/or central core disease. Journal of Biological Chemistry. 1997;272:26332–26339. doi: 10.1074/jbc.272.42.26332. [DOI] [PubMed] [Google Scholar]