

Abstract
Understanding the biophysical properties of single neurons and how they process information is fundamental to understanding how the brain works. However, action potential initiation and the preceding integration of the synaptic signals in neuronal processes of individual cells are complex and difficult to understand in the absence of detailed, spatially resolved measurements. Multi-site optical recording with voltage-sensitive dyes from individual neurons in situ was used to provide these kinds of measurements. We analysed in detail the pattern of initiation and propagation of spikes evoked synaptically in an identified snail (Helix aspersa) neuron in situ.
Two main spike trigger zones were identified. The trigger zones were activated selectively by different sets of synaptic inputs which also produced different spike propagation patterns.
Synaptically evoked action potentials did not always invade all parts of the neuron. The conduction of the axonal spike was regularly blocked at particular locations on neuronal processes.
The propagating spikes in some axonal branches consistently reversed direction at certain branch points, a phenomenon known as reflection.
These experimental results, when linked to a computer model, could allow a new level of analysis of the electrical structure of single neurons.
The present understanding of how individual nerve cells process information is incomplete. The classical model of the neuron (Rall, 1967) is one based on early studies of vertebrate spinal motoneurons (Coombs et al. 1957; Eccles, 1957; Fatt, 1957a,b) and the formal description developed by Rall using the simplifying assumption that dendrites behave as passive electrical elements. This model is currently being replaced by a more detailed description that involves complex, non-linear, active properties of the dendritic membrane (Wong et al. 1979; Llinás & Sugimori, 1980; Lasser-Ross & Ross, 1992; Stuart & Sakmann, 1994; De Schutter & Bower, 1994; Traub et al. 1994; Spruston et al. 1995; Chen et al. 1997; Cash & Yuste, 1999; Gongyu et al. 1999). An important consequence of active dendrites is that regional electrical properties of branching neuronal processes and the functional organization of individual neurons will be extraordinarily complex, dynamic and, in general, impossible to predict using a model derived in the absence of detailed measurements.
To obtain such measurements, one would ideally like to be able to monitor, at multiple sites, subthreshold events as they propagate from the sites of origin on neuronal processes and summate at particular locations to influence action potential initiation. It is important to be able to perform these measurements in at least partially intact neuronal structures (isolated invertebrate ganglia or tissue slices of vertebrate CNS) to ensure that highly specific regional electrical properties of individual neurons (Tauc & Hughes, 1963; Llinás & Sugimori, 1980; Stuart & Sakmann, 1994; Stuart & Häusser, 1994) and characteristic synaptic connections, largely lost in dissociated primary cultures, are preserved.
The development of recording methods that would approximate these ideal requirements has been slow. Direct electrical measurements of the detailed spatial distribution and dynamics of voltage transients from neuronal processes are not possible due to size considerations. A true multi-site recording might, however, be achieved by using voltage-sensitive dyes (Cohen & Salzberg, 1978; Wu & Cohen, 1993). Recently, the sensitivity of intracellular voltage-sensitive dye techniques for monitoring voltage transients from neuronal processes in situ, introduced by Grinvald et al. (1987), has been improved 100-fold (Antic & Zecevic, 1995). We have used this approach previously to analyse the metacerebral cell from the terrestrial snail, Helix aspersa, and found multiple spike trigger zones for action potentials evoked by electrical stimulation of the soma. It was possible to determine the precise position of one of these sites (Zecevic, 1996). The metacerebral neuron is a bilaterally paired serotonergic modulatory interneuron whose activity accounts for some aspects of food-induced arousal in Helix, Aplysia and other molluscs (Kupferman & Weiss, 1982; Yeoman et al. 1996). The metacerebral neurons innervate the muscles controlling biting and serve to modulate muscle contractions resulting from the firing of motoneurons during feeding. It has been proposed that the metacerebral cell has gating/enabling function in feeding behaviour because a minimum level of tonic firing was required to support feeding in fine-wire recording experiments in the intact animal (Yeoman et al. 1994). The metacerebral cell fires action potentials in response to food stimuli applied to the lips of the animal. It has been postulated that excitatory inputs to metacerebral cells are mediated through interneurons (Horn et al. 1999). However, the exact nature of these synaptic inputs is unknown.
Here, we analysed the initiation and propagation of action potentials evoked synaptically. First, the location of two trigger zones for synaptically evoked spikes was determined. The position of the trigger zones was stable and similar for both synaptically evoked action potentials and spikes elicited by electrical stimulation of the soma. Furthermore, we found that different sets of synaptic inputs activate different trigger zones. Also, we showed that a spike initiated at a remote axonal site did not always invade all parts of the neuron; the conduction of the axonal impulse was regularly blocked at particular locations and the failure of propagation was monitored directly. Finally, the propagating spikes in some axonal branches consistently reversed direction at certain branch points, a phenomenon known as reflection.
METHODS
Preparation
Experiments were carried out on the identified giant metacerebral cell from the cerebral ganglia of Helix aspersa (Fig. 1) following the procedures described by Antic & Zecevic (1995). A total of 139 cells were analysed. The ganglia were dissected from the animal and placed in a Sylgard-coated chamber containing Helix saline (mM): 80 NaCl, 4 KCl, 5 MgCl2, 5 CaCl2, 5 Tris-HCl, adjusted to pH 7.8. After enzyme treatment, the thin connective tissue directly covering the neurons was removed. The cell bodies of the two giant metacerebral neurons are symmetrically situated on the ventral surface of the cerebral ganglion and their main axonal branches project into the commissure and peripheral nerves, also running on the surface. The cells from both the left and right cerebral ganglion were used. Thus, two possible left/right orientations of the cell appear in the illustrations (Figs 1, 2, 7 and 8, metacerebral cell from the left cerebral ganglion; Figs 3, 4, 5 and 6, metacerebral cell from the right cerebral ganglion).
Figure 1. The giant metacerebral interneuron of H. aspersa.
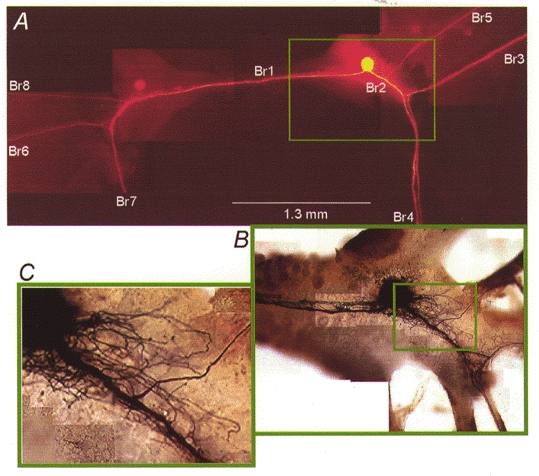
A, fluorescence image of a metacerebral cell in situ. The cell body and the processes are close to the surface of the ganglion and clearly visible in the unfixed preparation. Excitation, 540 ± 30 nm; dichroic mirror, 570 nm; barrier filter, 610 nm. Br1, cerebral commissure; Br4 and Br7, left and right cerebrobuccal connectives; Br3 and Br6, left and right external lip nerve; Br5 and Br8, left and right internal lip nerve. B and C, fine arborizations of dendritic branches, from the part of the neuron indicated in A, as revealed by cobalt-lysine intracellular staining. Images in A and in B and C are from different cells.
Figure 2. Position of the trigger zone for spikes evoked by ipsilateral EPSPs and soma stimulation.
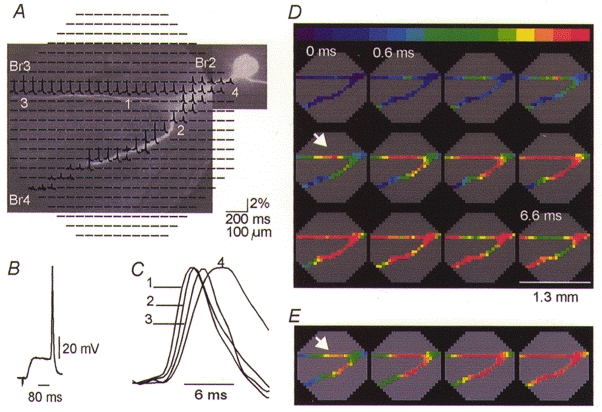
A, raw optical recordings of fluorescence signals (ΔF/F) associated with 85 mV action potentials from elements of photodiode array positioned over the fluorescence CCD image of the axonal arborizations of a metacerebral cell in situ, stained with the voltage-sensitive dye JPW 1114. In this and all subsequent figures the traces are arranged according to the disposition of the detectors in the array. A mask was applied to the recordings in A that revealed the data from relevant detectors only. Nine trials were averaged. Each diode received light from a 50 μm × 50 μm area in the object plane. Each trace represents the output of one diode for 100 ms centred around an evoked action potential. B, synaptically evoked action potential recorded by a microelectrode in the soma. C, superimposed recordings from individual detectors from different locations indicated in A, scaled to the same height, on an expanded time scale. D, colour-coded representation of the spatial and temporal dynamics of the synaptically evoked spike. The peak of the action potential is shown in red. Individual frames are separated by 0.6 ms and the position of the ipsilateral trigger zone is indicated by the arrow. E, position of the ipsilateral trigger zone (arrow) for the action potential evoked by direct stimulation of the soma under identical recording conditions to those in D.
Figure 7. Multiple site recording of spike propagation success (A) and failure (B) at the junction between axonal branches Br5 and Br2.

The recording area is indicated by multiple traces superimposed over the CCD image of the same intact neuron. Each trace represents the output of one diode for 70 ms centred around the peak of the spike. Four trials were averaged. The spatial and temporal characteristics of the propagation block are shown as a sequence of nine frames, 1 ms apart, in the colour-coded display. A, orthodromic action potential evoked by soma stimulation invaded all axonal branches. B, antidromic action potential evoked peripherally in Br5, by a current pulse delivered through a suction electrode attached to the cut end of the peripheral nerve, failed at the bifurcation. C and D, decline of the relative spike amplitude with distance from the region of full excitability in the direction of the site of propagation block. In D, the y-axis shows the relative spike amplitude.
Figure 8. Multiple site recording of spike propagation failure at the junction between axonal branch Br1 and the soma.
In A, the recording region is indicated by an outline of a subset of individual detectors, superimposed over a CCD image of the neuron in situ.B, multiple site recording of the propagation of an action potential evoked by direct stimulation of the soma. Each trace is the output of one diode for 100 ms centred around the peak of the spike. Each diode received light from a region of 14 μm × 14 μm in the object plane. Nine trials were averaged. C, propagation of an action potential evoked by a contralateral EPSP, recorded under identical conditions to those in B. B′ and C′, colour-coded representation of the data shown in B and C. The orthodromic spike evoked by soma stimulation was propagated throughout the neuron (B′). Propagation of the antidromic nerve impulse was blocked in the vicinity of the cell body (C′). D, relative spike amplitude (y-axis) as a function of the distance from the region of full excitability in the direction of the site of propagation block.
Figure 3. Propagation of an action potential initiated by EPSPs evoked by electrical stimulation of the ipsilateral middle lip nerve.
A, two separate recordings were obtained from the ipsi- and contralateral side of the cell as indicated on a CCD image of the neuron by the outline of an octagonal array on each side of the soma. B, pattern of spike propagation shown by comparing optical recordings from six different regions, indicated by rectangles on the CCD image of the cell. Vertical lines a and b indicate peaks of the first spike (trace 7) and the intrasomatic action potential (trace 3), respectively. C, spatial and temporal characteristics of spike propagation shown as a colour-coded display of the data from the same measurement. Nine trials were averaged. The position of the ipsilateral trigger zone is indicated by the arrow. See text for explanation.
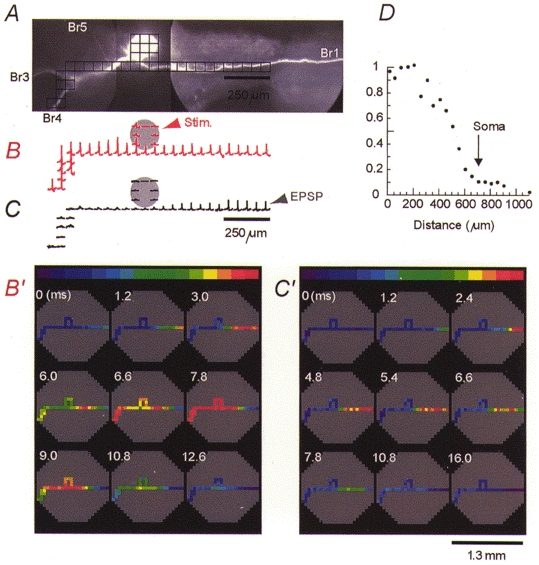
Figure 4. Position of the trigger zone for spikes evoked by contralateral EPSPs and soma stimulation.
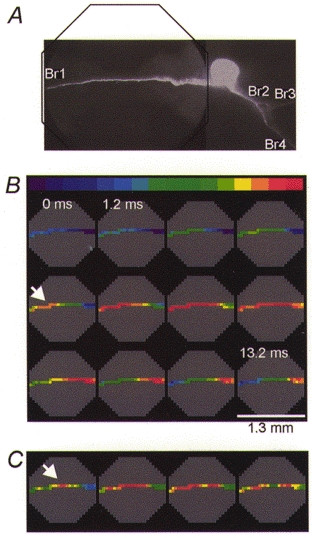
A, optical recording was made from a 1.3 mm region on axonal branch Br1, as indicated by the outline of the octagonal array superimposed over the CCD image of the cell in situ.B, colour-coded representation of the spatial and temporal dynamics of the synaptically evoked action potential. Individual frames are separated by 1.2 ms. The position of the trigger zone is indicated by the arrow. Nine trials were averaged. C, position of the contralateral trigger zone (arrow) for the action potential evoked by direct stimulation of the soma under identical recording conditions to those in B.
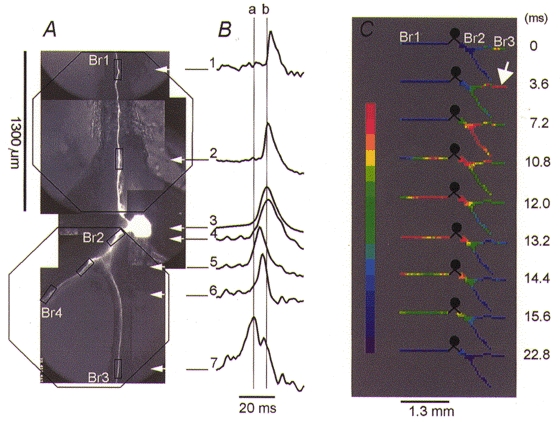
Figure 5. Pattern of initiation and propagation of the nerve impulse evoked in the contralateral trigger zone by polysynaptic EPSPs.
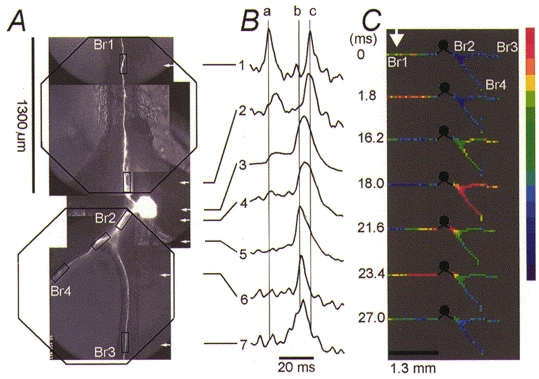
A, composite CCD image of the neuron in situ. Two measurement series of nine averaged trials were made from different regions of the cell, as indicated by the outline of an octagonal array on each side of the soma. B, pattern of spike propagation obtained by comparing optical recordings from six different regions, indicated by rectangles in A. Trace 3 is an electrical recording from the soma. C, colour-coded display of the same data showing the spatial and temporal dynamics of the spike generation and propagation. See text for explanation.
Figure 6. Initiation and propagation of action potentials evoked by spontaneous EPSPs.
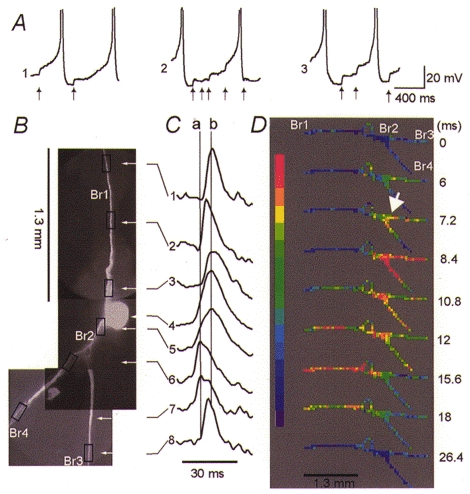
A, action potentials evoked by spontaneous EPSPs (arrows), recorded with the microelectrode in the soma during three optical recording trials (1–3). B, CCD image of the neuron in situ.C, pattern of spike propagation shown by comparing optical recordings from seven different regions, indicated by rectangles in B. Trace 4 is an electrical recording from the soma. D, colour-coded display of the same data showing the spatial and temporal dynamics of the spike generation and propagation. Single trial recording. See text for explanation.
Dye injection
Neurons were impaled under visual control. The tip of a sharp microelectrode was backfilled with the voltage-sensitive styryl dye JPW 1114 (3 mg ml−1). This compound was synthesized according to the palladium-catalysed coupling pathway described by Hassner et al. (1984). The final step involved the alkylation of β-[2-(diethylamino)-6-napthyl]-4-vinylpyridine with (2-bromoethyl)trimethylammonium bromide. The resultant dye (also called di-2-ANEPEQ) is a doubly positively charged analogue of the ANEPPS series of lipophilic voltage-sensitive dyes that is still sufficiently water soluble to be used for microinjection. JPW 1114 has recently become available from Molecular Probes Inc. (Eugene, OR, USA). After the injection was completed the preparation was typically incubated at 15°C for 12 h to allow the dye to spread into the distal processes before optical recordings were made (Antic & Zecevic, 1995). The slow spread is not caused by the size of the dye molecule because other dyes of similar size can diffuse very quickly (Grinvald et al. 1987; Antic & Zecevic, 1995). The spread of JPW 1114 is limited by its high affinity for lipid membranes.
In a typical experiment, the cell was stimulated to produce action potentials while optical signals were recorded simultaneously from multiple sites on the neuron.
Optical recording
A recording system for fast, multi-site optical monitoring of membrane potential changes utilizing an array of silicon photodiodes was used. Detailed descriptions of the apparatus have appeared in Cohen & Lesher (1986) and Wu & Cohen (1993). The preparation was positioned on the stage of a microscope and the image of the stained cell projected onto the photodiode array positioned at the primary image plane. A 250 W xenon arc lamp (Osram, XBO 250 W/CR ORF) powered by a low ripple power supply (model 1700XT/A, Opti-Quip, Highland Mills, NY, USA) was used as a light source. The best signals were obtained using an excitation interference filter of 520 ± 45 nm, a dichroic mirror with central wavelength of 570 nm and a Schott RG610 nm barrier filter. The optical signals were recorded with a 464 element photodiode array (in a 24 × 24 grid with the corner elements omitted; Centronix Inc., Newbury Park, CA, USA). The output current of each diode was converted to voltage and individually amplified. High-frequency noise in the recording was limited by the 300 Hz cut-off frequency of the low-pass filter in the amplifier (4 pole Bessel filter). The corner frequencies of 300 kHz optimized the signal-to-noise ratio while the shape of the optical signal was very little modified (Antic & Zecevic, 1995). A high-pass RC filter with a cut-off frequency of 1.7 Hz was used to limit low-frequency noise. The high-pass RC filter to a large extent attenuated slow changes in light intensity, including signals related to synaptic potentials. The amplifier outputs were digitized using the data acquisition system for an IBM-PC computer (model DAP 3200e/214, Microstar Laboratories Inc., Bellevue, WA, USA). The system provides for 512 analog inputs and a 769 kHz throughput rate with 12 bit A/D resolution. The fastest acquisition rate, limited by a single conversion time of 1.3 μs, was 0.6 ms per full frame with 464 pixels. Faster frame rates were achieved by monitoring a subset of individual detectors under software control. A similar system is available commercially as NeuroPlex (RedShirtImaging, LLC, Fairfield, CT, USA). The analyses and display of data were made using the NeuroPlex program written in IDL (Interactive Data Language, Research systems Inc., Boulder, CO, USA) running on both a Silicon Graphics Indy workstation and an IBM-PC computer.
RESULTS
Morphology of the metacerebral neuron
There are two mirror-symmetrical giant metacerebral cells (Kandel & Tauc, 1965) with the same axonal branching pattern in every preparation. The morphology of the main axonal branches was examined (n = 15; n refers to the number of cells throughout) using an anatomical fluorescent dye (dextran, tetramethylrhodamine, 3000 MW; Molecular Probes Inc.). Figure 1A shows the fluorescence image of an injected cell following 24 h incubation at 15°C. The cell body was situated on the ventral surface of the cerebral ganglion (ipsilateral ganglion). One main axonal branch (Br2) projected into three peripheral nerves on the ipsilateral side (Br3, Br4 and Br5). The other main axonal branch (Br1) projected across the commissure into three analogous peripheral nerves on the contralateral side (Br6, Br7 and Br8). Fine dendritic branches were not visible under fluorescence but could be examined (n = 8) in detail using cobalt-lysine intracellular staining (Altrup & Peters, 1982). Figure 1B and C illustrates typical dendritic arborizations. The majority of the dendrites originated from the main axonal branches close to the cell body and around axonal branch points in both the ipsilateral (Fig. 1B) and the contralateral ganglion (not shown). It has been found by electron microscopy that most or all of the synaptic contacts onto the metacerebral cell are located on these dendritic branches (Chase & Tolloczko, 1992). It is likely that the thin dendritic branches significantly influence the electrical behaviour of this neuron. The exact contribution of thin processes to the pattern of spike initiation, including the possibility of direct electrical connection between axonal branches, bypassing the soma, would require computer simulation which was outside the scope of this work.
Action potential initiation and propagation
The purpose of the measurements described below was to determine two fundamental indicators of the electrical structure of a neuron: the number and the position of trigger zones for spikes evoked by synaptic inputs and the pattern of action potential propagation within a neuron.
We explored the patterns of initiation and propagation of action potentials evoked in the metacerebral cell by two types of excitatory synaptic inputs: (1) EPSPs elicited by electrical stimulation of specific peripheral nerves, and (2) spontaneous EPSPs that occur in the absence of any external stimulation. Also, the electrical behaviour of the cell in response to synaptic inputs was compared, in the same experiment, with the responses evoked by direct electrical stimulation of the soma. The aim of these measurements was to establish the robustness of both the trigger zone position and the pattern of neuronal response under different modes of stimulation (synaptic or electrical). A total of 56 neurons were examined.
Evoked EPSPs
It is known that polysynaptic EPSPs can be initiated in the metacerebral cell by stimulating certain peripheral nerves (Kandel & Tauc, 1965). We used ipsi- and contralateral middle lip nerve stimulation to initiate spikes by activating two different pools of synaptic inputs, while monitoring the position of the spike trigger zone optically. There is no axon from the metacerebral cell in these nerves.
Ipsilateral stimulation
In this series of measurements a suction electrode was attached to the cut end of the ipsilateral middle lip nerve. Stimulus current pulses delivered to the suction electrode evoked subthreshold polysynaptic excitatory potentials in the ipsilateral metacerebral neuron. Trains of two or three pulses were usually sufficient to evoke an action potential recorded electrically by the microelectrode in the soma (Fig. 2B; the second EPSP in a train of 2 shown) and monitored optically from multiple sites (Fig. 2A).
The position of the spike initiation site was determined from optical data as illustrated in Fig. 2. Figure 2A shows how recordings from individual detectors were mapped onto the cell shape. A CCD image of the cell, obtained by positioning a conventional CCD camera (CCD-300-RC, Dage-MTI Inc., Michigan City, IN, USA) in the primary image plane of the microscope in place of the photodiode array, was superimposed over the recordings from the diode array. Using a Wild ×10/0.4 NA objective, with an actual magnification of ×14 on our microscope, the image on the diode array corresponds to a circle of 1.3 mm in diameter in the object plane. The 464 traces from individual diodes in Fig. 2A are arranged on the display according to their position in the array. In this way, recordings from individual detectors can be assigned to particular regions of the neuron. Each optical trace in Fig. 2A represents 100 ms of recording centred around the peak of the evoked action potential. The optical signals, corresponding to evoked action potentials, were normalized to resting light intensity for each detector (ΔF/F). Nine trials were averaged to improve the signal-to-noise ratio.
It is obvious that after normalizing the signals to the resting light intensity for each detector, by dividing the signal (ΔF) by the resting light intensity (F), it was still not possible to determine the actual voltage change from optical recordings. The fractional change in light intensity (ΔF/F) is proportional to voltage, but the proportionality is different at different sites. This is because the proportionality constant depends on the ratio of the dye that is bound to membranes that do not change potential (inactive dye) to the dye that is bound to the excitable membrane being monitored (active dye). The inactive dye contributes to the resting fluorescence only, while light from the active dye contributes to the resting fluorescence and also carries the signal. It is generally the case that the ratio of active dye to inactive dye is unknown and different for different regions of a neuron. Furthermore, if the autofluorescence (not related to the voltage-sensitive dye) from the object contributes significantly, and to a different degree, to the resting fluorescence recorded by each detector, the fractional change in light intensity caused by the same change in membrane potential will be different for different regions. The differences in the ΔF/F signal size shown in Fig. 2A are due to these effects. For instance, a lower fractional fluorescence change in the thick axonal region close to the soma (location 4) could be explained by a lower surface-to-volume ratio resulting in a lower ratio of active to inactive dye. The sudden fall-off in signal amplitude in the distal region of Br4 might be explained by very low resting fluorescence making the contribution of autofluorescence to the total resting light significant. In this region the thin axonal branch Br4 was out of focus.
In this and all other experiments where signal averaging was applied, all individual trials were inspected to confirm that averaging did not introduce errors. Figure 2A shows that optical signals associated with 85 mV action potentials, expressed as fractional changes in fluorescent light intensity (ΔF/F), were between 1 and 3 % in recordings from neuronal processes.
From these data, determination of the site of initiation of the earliest action potential is straightforward. Individual traces from selected regions of the cell (1–4 in Fig. 2A and C), scaled to the same height, are compared on an expanded time scale in Fig. 2C. The action potential appeared first at location 1 and, after a progressively longer delay, at locations 2, 3 and 4.
The shape of individual optical signals and the temporal relationship between spikes are best represented by plotting the signal amplitude as a function of time, as in Fig. 2C. However, the simultaneous presentation of the temporal and spatial dynamics of action potential propagation requires a colour-coded display (Fig. 2D). A relative scale was applied separately to each optical channel. The minimum value of the signal amplitude is represented by purple and the peak of the action potential by red. To make the use of the relative scale possible, we applied a mask that revealed only detectors with signals. Each frame in Fig. 2D is a colour-coded representation of the spatial distribution of membrane potential at one point in time. The arrow indicates the peak of the first action potential and depicts the position of the spike trigger zone. The position of the trigger zone shown in Fig. 2D is representative of the series of measurements from different preparations (n = 25). The ipsilateral trigger zone for the synaptically evoked spike was located close to the branch point between Br2, Br3 and Br4. The location of the trigger zone in a given cell was stable, as determined in numerous repeated measurements. Slight variations between different neurons were most probably due to the observed individual differences in the morphology of neurons.
In 12 preparations the position of the ipsilateral trigger zone for the spike evoked synaptically (Fig. 2D) was compared, under identical recording conditions, with the location of the initiation site for the action potentials evoked by near-threshold electrical stimulation of the cell body (Fig. 2E). The results consistently showed that the spike was initiated at a similar location under both modes of stimulation. However, it appeared that in some neurons synaptic activation and direct stimulation of the soma both evoked independent spikes in two adjacent regions in the proximal part of Br3 and Br4 (compare Fig. 2D and E). Although this type of information might be essential for determining the precise physical location of synaptic inputs, it is difficult to assign significance to small variations in the position of the trigger zone because the exact location varied in different preparations (see Fig. 3C). The simplest explanation is that small differences in the morphology of individual metacerebral cells are responsible for the observed variations.
The propagation of the synaptically evoked spike from the trigger zone into the other parts of the neuron is shown, as a time sequence of frames, in Fig. 2D. However, the spike activity recorded from one side of the neuron does not provide a complete picture of action potential initiation and propagation. Thus, we monitored larger areas of the injected neuron by combining recordings from two separate measurements. (It was not possible to use lower magnification objectives for the same purpose because they have low light gathering power. Lower light levels would dramatically degrade the signal-to-noise ratio in our measurements.) In the experiment shown in Fig. 3, two outlines of the octagonal photodiode array are superimposed on a CCD image of the neuron (A) indicating the two regions of the cell that were monitored in separate recordings. The data files from the two measurements were subsequently combined. The recordings were positioned according to the time of the peak of the evoked action potential recorded electrically from the cell body, and aligned spatially according to CCD images taken at the two recording positions. In this way, it was possible to reconstruct the pattern of spike initiation and propagation in a larger portion of a neuron. The reconstruction is based on the reasonable assumption that the pattern of spike initiation and propagation is the same in successive recording trials. This was confirmed in numerous experiments in which repeated single-trial measurements from the same region produced identical results.
The pattern of spike propagation in response to an ipsilateral EPSP, shown in Fig. 3, was invariant. In Fig. 3B, the electrical recording from the soma (trace 3) and optical recordings from six different regions of the neuron are compared on an expanded time scale. Each optical trace is a spatial average of three detectors from regions indicated by rectangles in the CCD image of the neuron (Fig. 3A). The spatial and temporal characteristics of spike propagation are shown together in the colour-coded display of the same data (Fig. 3C). The data indicate a simple spike propagation pattern. The left vertical line (a) in Fig. 3B is positioned at the peak of the first action potential (trace 7) recorded from the ipsilateral trigger zone (arrow in Fig. 3C). The second vertical line (b) is positioned at the peak of the action potential recorded by a microelectrode in the soma (trace 3). The peak of the spike occurred with a delay of 7.5 ms in the soma and was detected in the most distal region on axonal branch Br1 (trace 1) after 9.5 ms. Careful inspection of the data shown in Fig. 3C, between 12.0 and 15.6 ms, indicates that the initial spike in the ipsilateral part of the neuron was followed by an action potential in the remote trigger zone in the contralateral axon (Br1) that preceded the discharge of the soma. The spike then propagated in the orthograde direction along axon Br1 and in the retrograde direction, towards the soma. A similar result was obtained in five neurons.
Contralateral stimulation
We presumed that stimulation of the contralateral lip nerve would activate a different set of presynaptic neurons and synapses that might trigger an action potential at a different location in the metacerebral neuron. Accordingly, we found, in all preparations tested (n = 29), that the nerve impulse evoked by polysynaptic EPSPs driven by contralateral stimulation clearly originated in the axonal branch Br1 in the contralateral part of the neuron. In one group of neurons (n = 13) this conclusion was based on the antidromic propagation of the spike because the trigger zone was at the edge of or outside the recording field. In measurements from other neurons (n = 16) it was possible to determine precisely the position of the trigger zone in axon Br1. A typical result, showing the position of the contralateral trigger zone (arrow), is illustrated in Fig. 4B. The trigger zone was located at a distance that varied, in different preparations, from 550 to 1200 μm from the soma.
The position of the contralateral trigger zone for the spike evoked synaptically was compared, in the same experiment and under identical recording conditions, with the location of the initiation site for the action potentials evoked by near-threshold electrical stimulation of the cell body. The results (n = 16) consistently showed that the spike was initiated at a similar location under both modes of stimulation. However, depolarizing current pulses delivered to the soma usually resulted in a slight shift of the trigger zone in the axonal branch Br1 proximally towards the cell body (Fig. 4B and C). A similar shift of the trigger zone towards the depolarized region has been described previously for a leech neuron (Melinek & Muller, 1996).
The series of measurements of the propagation of action potentials initiated by contralateral EPSPs in different neurons showed that two different patterns occurred under the same experimental conditions. In one group of neurons (n = 11) the antidromic action potential evoked in Br1 failed to propagate across the somatic region into the ipsilateral side of the neuron (Fig. 8). The failure of spike propagation will be described in a separate section below.
The second pattern of spike propagation evoked by contralateral EPSPs, found in 18 neurons, is illustrated in Fig. 5. As in the previous example, the earliest spike was evoked in the contralateral trigger zone (arrow in Fig. 5C) but this response was characterized by the presence of an additional, second nerve impulse that was restricted to the contralateral side of the cell (note the double spike in Br1; Fig. 5B, traces 1 and 2). The left vertical line (a) in Fig. 5B is positioned at the peak of the first action potential generated at the trigger zone in axonal branch Br1. As it travelled antidromically, this spike was depressed in amplitude some distance from the soma, presumably due to the loading effect of the somatic membrane (Fig. 5B, trace 2). The depressed impulse eventually acted as an electrical stimulus for the somatic membrane and the axonal arbor on the opposite, ipsilateral side containing the other trigger zone. As a result, a full-size action potential was first seen at the ipsilateral trigger zone (vertical line b, trace 5), on the other side of the soma, before the somatic membrane was discharged. The spike from the ipsilateral trigger zone was followed by a full discharge of the soma, as recorded electrically by the microelectrode in the soma (trace 3) and optically (trace 4). The somatic discharge occurred with a delay of 20 ms from the initiation of the earliest spike. At that time the axonal branch Br1 had fully recovered from inactivation and the somatic spike was propagated in the opposite direction, as an orthodromic impulse in axonal branch Br1. The peak of this spike (right vertical line c, trace 1) was detected in the distal part of axonal branch Br1 with a delay of 3 ms following somatic discharge. Thus, two neuronal impulses in Br1 were propagated in succession, but travelling in opposite directions. The propagation sequence of the two impulses is shown in the colour-coded display in Fig. 5C. There is evidence that this type of neuronal response might have physiological meaning. At the nerve terminals of the leech, reflection produced a rapid and reversible enhancement of synaptic transmission (Baccus, 1998).
The loading effect of the cell body could be modified, as expected, by polarizing the soma by current injection. Soma depolarization during contralateral synaptic activation of the cell facilitated spike propagation and prevented propagation block and action potential reflection. Hyperpolarization of the cell body effectively decoupled the two trigger zones and blocked spike propagation into the ipsilateral side of the neuron (not shown).
Spontaneous EPSPs
It was of interest to establish whether or not the responses described above, evoked by activating presynaptic neurons and synapses by non-physiological stimulation of peripheral nerves, are similar to the activity that normally occurs in this nerve cell.
The metacerebral cell is usually silent. However, in some preparations it is possible to record a series of spontaneous EPSPs in the absence of any external stimulation. The spontaneous EPSPs summate and initiate action potentials. In two experiments it was possible to record optically the full pattern of initiation and spread of these spontaneous, synaptically evoked, action potentials.
In the experiment shown in Fig. 6, three separate, single trial recordings of the same duration were made. Each recording included the spontaneous generation of two action potentials (Fig. 6A1–3). The preparation was repositioned for each recording to cover the area shown on the CCD image in Fig. 6B. The data files from three measurements were subsequently combined. The results were analysed by comparing recordings from individual detectors (Fig. 6C) and by using the colour-coded display (Fig. 6D). In Fig. 6C, each trace is a spatial average of three detectors from a region indicated by a rectangle superimposed on the CCD image of the neuron. Each of the individual action potentials (Fig. 6A) recorded in the three separate measurements produced the same pattern of spike initiation. This confirmed the assumption that the sequence of events was the same for every spike. The earliest spike evoked by spontaneous synaptic inputs clearly originated in the trigger zone on the ipsilateral side of the neuron, located near the axonal branch point (arrow in Fig. 6D). The left vertical line (a) in Fig. 6C is positioned at the peak of the earliest spike (trace 6). From the site of initiation the spike propagated both orthodromically (traces 7 and 8), towards the periphery, and antidromically, towards the cell body. The earliest action potential in the axonal branch Br1 appeared first in the contralateral trigger zone (Fig. 6C, trace 2) away from the soma. It was followed by the discharge of the cell body with a delay of about 4 ms (vertical line b, trace 4). This response was very similar to the propagation pattern of the action potential evoked by ipsilateral EPSPs (see Fig. 3).
Spike propagation failure
A characteristic feature of the metacerebral cell is that action potentials initiated at certain locations did not always invade all parts of the neuron. These partial responses were the result of spike propagation block at specific sites, characterized by a sharp increase in diameter. Two blocking sites were identified: the junction between axonal branches Br2 and Br5 and the junction between axon Br1 and the soma (Fig. 1). The propagation failure at both of these sites occurred only in the direction from the smaller to larger structure.
Figure 7 shows a typical result of the imaging of spike propagation failure at the junction between axonal branches Br5 and Br2. The recording area is indicated by multiple recording traces superimposed on the CCD image of the neuron. Time zero in the colour-coded display is arbitrary. We compared the propagation of the action potential through the junction point in both the orthodromic (Fig. 7A) and antidromic (Fig. 7B) direction, from exactly the same area. Direct somatic stimulation evoked an action potential that propagated into all axonal branches. The spike in Br5 preceded the discharge of the soma and the adjacent thick axon Br2 (Fig. 7A), indicating the presence of a third remote trigger zone in the thin axonal branch (n = 3). This trigger zone was not explored further. Peripheral stimulation of axonal branch Br5 by a current pulse delivered through a suction electrode (Fig. 7B) evoked an antidromic spike that failed to propagate across the branch point. It was possible to determine the rate of decline of the amplitude of the spike with distance from the region of full excitability (region 1) in the direction of the propagation block (Fig. 7B-D). Similar results were obtained in two other cells.
Figure 8 illustrates the recording of spike propagation failure at the junction between axonal branch Br1 and the soma. The same result was obtained in a total of 11 neurons. The propagation of the action potential through the junction point (Fig. 8A) was monitored for an orthodromic action potential evoked by direct soma stimulation (Fig. 8B) and for an antidromic spike evoked by contralateral synaptic stimulation (Fig. 8C). The recording region is indicated in Fig. 8A by the outline of a subset of individual detectors used in this measurement, superimposed over the CCD image of the neuron. As expected, direct stimulation of the soma resulted in an action potential that propagated into all parts of the neuron and could be recorded optically from multiple sites (Fig. 8B). Figure 8B′ shows a colour-coded representation of the same data. A different result was obtained for the action potential evoked peripherally in Br1 by synaptic stimulation. The spike was blocked at some distance from the cell body, as recorded optically (Fig. 8C) and shown in the colour-coded display (Fig. 8C′). The decline in the spike amplitude with distance from the region of full excitability (covered by the first 5 detectors on the left), in the direction of the propagation block, is plotted in Fig. 8D.
DISCUSSION
We investigated several aspects of the functional organization of an individual nerve cell, the Helix metacerebral neuron, in situ, by recording temporal and spatial dynamics of electrical activity in its processes using voltage-sensitive dyes. The action potentials were evoked by synaptic stimulation and by direct stimulation of the soma. We found that: (1) the metacerebral giant neuron had two distinct trigger zones that were remote from the cell body; (2) the two trigger zones were associated with different sets of synaptic inputs; (3) the conduction of the nerve impulse within a neuron was blocked at particular locations; and (4) propagating spikes, at certain junction points characterized by the steep increase in diameter, elicited, with a delay, a secondary impulse travelling in the opposite direction in the same axon (spike reflection).
Spike trigger zones
Voltage-sensitive dye recordings, described in this paper and in a previous publication (Zecevic, 1996), provide direct evidence that independent action potentials are initiated at multiple trigger zones located in distal processes of the metacerebral cell. The information from a number of recent experiments indicates that action potentials of vertebrate neurons are normally initiated in the axonal segment remote from the cell body (Stuart & Sakmann, 1994; Spruston et al. 1995; Magee & Johnston, 1995; Stuart et al. 1997; Hoffman et al. 1997). Modelling studies suggest that the remote position of the trigger zone in vertebrate neurons arises from the high current density (higher channel densities) and electrical isolation from the soma (Mainen et al. 1995). Similar considerations might apply to invertebrate neurons that are multi-polar (Tauc & Hughes, 1963) and hence, characterized by multiple trigger zones.
We have no indication that spike trigger zones are anatomically different from other regions of the metacerebral cell. Also, it is not possible to predict, without a detailed computer simulation, whether non-uniform channel distribution is the only possible way to account for remote trigger zones in this particular neuron.
The existence of multiple trigger zones is in contrast to the classical view that all inputs to a postsynaptic neuron are integrated at a single point. Bullock & Terzuolo (1957) were the first to describe independent action potentials in different parts of a neuron (crustacean cardiac ganglion cell), showing indirectly that more than one locus for spike initiation can be present in a single nerve cell. They inferred the existence of at least two separate trigger zones from microelectrode measurements from a single site (soma). The existence of multiple trigger zones in individual neurons has been subsequently demonstrated, using extra- and intracellular electrical recordings, in a variety of both invertebrate and vertebrate preparations, including crayfish interneurons (Hughes & Wiersma, 1960; Calabrese & Kennedy, 1974), Aplysia nerve cells (Tauc & Hughes, 1963), fish motoneurons (Kriebel et al. 1969; Korn & Bennett, 1971), locust sensory neurons (O'Shea, 1975; Heitler & Goodman, 1978), lobster motor (Vedel & Moulins, 1978) and sensory (Combes et al. 1993) neurons, leech interneurons (Calabrese, 1980), rabbit sensory neurons (Ducreux et al. 1993) and mitral cells of the mammalian olfactory bulb (Chen et al. 1997).
The functional significance of multiple spike initiation sites is not clear. In general, the existence of more than one locus for spike initiation can make signal integration in individual neurons far more complex. For instance, it has been proposed that multiple trigger zones could functionally subdivide the neuron (Tauc & Hughes, 1963; Korn & Bennett, 1971; Vedel & Moulins, 1978; Combes et al. 1993). Also, the initiation sites are controlled by specific synaptic inputs that can change the impulse origin, the direction of impulse propagation and, presumably, the input-output relationship of the neuron (Chen et al. 1997).
Our results show directly (Figs 2 and 4) that different trigger zones are associated with different sets of synaptic inputs. Activation of a particular set of excitatory inputs evoked the earliest action potential at a specific site, resulting in a characteristic pattern of spike propagation within a neuron. It has been hypothesized that if each site of impulse initiation is associated with a different set of excitatory inputs, inhibitory pathways could be directed selectively at specific modalities of excitation within a single cell (Calabrese & Kennedy, 1974; O'Shea, 1975). It remains to be investigated whether this kind of selective activation of trigger zones occurs under more physiological conditions, in semi-intact preparations and in response to sensory inputs. The full understanding of the functional relevance of multiple trigger zones that can be independently activated would require knowledge of the computational task of the metacerebral neuron, which is as yet incomplete (Yeoman et al. 1994).
It was not expected that near-threshold electrical stimulation of the soma would evoke action potentials at remote sites in the processes even though the electrotonic gradient favours regions that are the closest to the stimulating electrode in the soma. However, the sites of spike initiation, in response to soma stimulation, were similar to the trigger zones for synaptically evoked spikes. The stable position of the trigger zones indicates that they are determined by the regional electrical properties of the metacerebral cell and are at least partly independent of the mode of stimulation.
Spike propagation failure and reflection
The functional subdivision of individual neurons that was postulated in the early work on Aplysia neurons (Tauc & Hughes, 1963) and more recently on lobster nerve cells (Vedel & Moulins, 1978; Combes et al. 1993) will depend critically on the ability of a neuron to initiate partial responses that do not invade the entire neuron. In the metacerebral cell, we found that spike propagation failure occurred at specific sites, characterized by a steep increase in diameter resulting in a low safety factor for impulse propagation. These results indicate that some parts of the metacerebral neuron may function as independent units.
Similar conclusions were inferred in other neurons from the correlation of intracellular soma recordings and extracellular recordings from different axonal branches of the same neuron. The action potentials initiated in one axonal branch did not necessarily invade the other axonal branches or the soma. Instead, the impulses failed to propagate at specific axonal branch points that had a low safety margin (Yau, 1976; Heitler & Goodman, 1978; Grossman et al. 1979; Gu, 1991; Ducreux et al. 1993; Combes et al. 1993; Wall, 1995). The proposed functions for spike propagation failure include low-pass filtering of spike trains at the blocking site (Wong & Pearson, 1975; Yau, 1976; Heitler & Goodman, 1978; Grossman et al. 1979; Smith, 1980; Ducreux et al. 1993), changing the pattern of functional connections with postsynaptic targets and sharpening of receptive fields (Gu, 1991; Combes et al. 1993), and controlled modulation of afferent activity (Ducreux et al. 1993; Wall, 1995).
In principle, the lack of active impulse propagation could be due to geometrical factors (impedance mismatch; Goldstein & Rall, 1974; Heitler & Goodman, 1978; Gu, 1991; Segev & Schneidman, 1999) and/or to non-uniform distribution of voltage-gated channels (Heitler & Goodman, 1978; Huguenard et al. 1989; Combes et al. 1993). The relative contribution of these two mechanisms is not known but some of the possibilities (e.g. uniform channel distribution throughout the neuron) might be excluded using numerical simulations.
The impedance mismatch that causes conduction block can also result in the reflection of action potentials (Tauc, 1962). We observed this phenomenon in the metacerebral cell where regions that have a low safety margin for impulse propagation would sometimes generate a second action potential that propagated in the reverse direction. The action potential reflection in an axonal branch develops when an impulse is delayed as it enters the region with much larger diameter (cell body or another axonal branch). This delay may be explained by the strong loading effect of the large area of the soma membrane. Reflection is difficult to study by standard electrical recording from the soma, but is readily detected by multi-site optical recording (Fig. 5).
The significance of spike reflection for the function of a neuron is not clear. In one case, direct evidence for a functional implication of reflection has been obtained. It was shown that reflection enhances synaptic transmission from individual axon branches by rapidly activating synapses twice, thereby producing facilitation (Baccus, 1998; Baccus et al. 2000).
Acknowledgments
We thank Avrum Cohen and Chun X. Falk for the data acquisition and analysis software, Lawrence Cohen and Knox Chandler for useful discussions, and Dr Jovan Mijovic for expert advice. This work was supported by NSF grants IBN-9604356 and IBN-9812301 and NIH grants NS-08437 and GM-35063.
References
- Altrup U, Peters M. Procedure of intracellular staining of neurons in the snail Helix pomatia. Journal of Neuroscience Methods. 1982;5:161–165. doi: 10.1016/0165-0270(82)90063-2. [DOI] [PubMed] [Google Scholar]
- Antic S, Zecevic D. Optical signals from neurons with internally applied voltage-sensitive dyes. Journal of Neuroscience. 1995;15:1392–1405. doi: 10.1523/JNEUROSCI.15-02-01392.1995. [DOI] [PMC free article] [PubMed] [Google Scholar]
- Baccus SA. Synaptic facilitation by reflected action potentials: enhancement of transmission when nerve impulses reverse direction at axon branch points. Proceedings of the National Academy of Sciences of the USA. 1998;95:8345–8350. doi: 10.1073/pnas.95.14.8345. [DOI] [PMC free article] [PubMed] [Google Scholar]
- Baccus SA, Burrell BD, Sahley CL, Muller KJ. Action potential reflection and failure at axon branch points cause stepwise changes in EPSPs in a neuron essential for learning. Journal of Neurophysiology. 2000;83:1693–1700. doi: 10.1152/jn.2000.83.3.1693. [DOI] [PubMed] [Google Scholar]
- Bullock TH, Terzuolo CA. Diverse forms of activity in the somata of spontaneous and integrating ganglion cells. The Journal of Physiology. 1957;138:341–364. doi: 10.1113/jphysiol.1957.sp005855. [DOI] [PMC free article] [PubMed] [Google Scholar]
- Calabrese RI. Control of multiple impulse-initiation sites in a leech interneuron. Journal of Neurophysiology. 1980;44:878–896. doi: 10.1152/jn.1980.44.5.878. [DOI] [PubMed] [Google Scholar]
- Calabrese RI, Kennedy D. Multiple sites of spike initiation in a single dendritic system. Brain Research. 1974;82:316–321. doi: 10.1016/0006-8993(74)90612-x. [DOI] [PubMed] [Google Scholar]
- Cash S, Yuste Y. Linear summation of excitatory inputs by CA1 pyramidal neurons. Neuron. 1999;22:383–394. doi: 10.1016/s0896-6273(00)81098-3. [DOI] [PubMed] [Google Scholar]
- Chase R, Tolloczko B. Synaptic innervation of the giant cerebral neuron in sated and hungry snails. Journal of Comparative Neurology. 1992;318:93–102. doi: 10.1002/cne.903180107. [DOI] [PubMed] [Google Scholar]
- Chen W, Midtgaard J, Shepherd G. Forward and backward propagation of dendritic impulses and their synaptic control in mitral cells. Science. 1997;278:463–467. doi: 10.1126/science.278.5337.463. [DOI] [PubMed] [Google Scholar]
- Cohen LB, Lesher S. Optical monitoring of membrane potential: methods of multi-site optical measurement. Society of General Physiologists Series. 1986;40:71–99. [PubMed] [Google Scholar]
- Cohen LB, Salzberg BM. Optical measurement of membrane potential. Reviews of Physiology Biochemistry and Pharmacology. 1978;83:35–88. doi: 10.1007/3-540-08907-1_2. [DOI] [PubMed] [Google Scholar]
- Combes D, Simmers J, Nonnotte L, Moulins M. Tetrodotoxin-sensitive dendritic spiking and control of axonal firing in a lobster mechanoreceptor neuron. The Journal of Physiology. 1993;460:581–602. doi: 10.1113/jphysiol.1993.sp019488. [DOI] [PMC free article] [PubMed] [Google Scholar]
- Coombs JS, Curtis DR, Eccles JC. The interpretation of spike potentials of motoneurons. The Journal of Physiology. 1957;139:198–231. doi: 10.1113/jphysiol.1957.sp005887. [DOI] [PMC free article] [PubMed] [Google Scholar]
- De Schutter E, Bower JM. An active membrane model of the cerebellar Purkinje cell. I. Simulation of current clamps in slice. Journal of Neurophysiology. 1994;71:375–400. doi: 10.1152/jn.1994.71.1.375. [DOI] [PubMed] [Google Scholar]
- Ducreux C, Reynaud JC, Puizillout JJ. Spike conduction properties of T-shaped C neurons in the rabbit nodose ganglion. Pflügers Archiv. 1993;424:238–244. doi: 10.1007/BF00384348. [DOI] [PubMed] [Google Scholar]
- Eccles JC. The Physiology of Nerve Cell. London: Oxford University Press; 1957. [Google Scholar]
- Fatt P. Electrical potentials occurring around a neuron during its antidromic activation. Journal of Neurophysiology. 1957a;20:27–60. doi: 10.1152/jn.1957.20.1.27. [DOI] [PubMed] [Google Scholar]
- Fatt P. Sequence of events in synaptic activation of a motoneurone. Journal of Neurophysiology. 1957b;20:61–80. doi: 10.1152/jn.1957.20.1.61. [DOI] [PubMed] [Google Scholar]
- Goldstein SS, Rall W. Changes of action potential shape and velocity for changing core conductor geometry. Biophysical Journal. 1974;14:731–757. doi: 10.1016/S0006-3495(74)85947-3. [DOI] [PMC free article] [PubMed] [Google Scholar]
- Gongyu YS, Chen WR, Midtgaard J, Shepherd GM, Hines ML. Computational analysis of action potential initiation in mitral cell soma and dendrites based on dual patch recordings. Journal of Neurophysiology. 1999;82:3006–3020. doi: 10.1152/jn.1999.82.6.3006. [DOI] [PubMed] [Google Scholar]
- Grinvald A, Salzberg BM, Lev-Ram V, Hildesheim R. Optical recording of synaptic potentials from processes of single neurons using intracellular potentiometric dyes. Biophysical Journal. 1987;51:643–651. doi: 10.1016/S0006-3495(87)83389-1. [DOI] [PMC free article] [PubMed] [Google Scholar]
- Grossman Y, Parnas I, Spira ME. Ionic mechanisms involved in differential conduction of action potentials at high frequency in a branching axon. The Journal of Physiology. 1979;295:307–322. doi: 10.1113/jphysiol.1979.sp012970. [DOI] [PMC free article] [PubMed] [Google Scholar]
- Gu X. Effects of conduction block at axon bifurcations on synaptic transmission to different postsynaptic neurons in the leech. The Journal of Physiology. 1991;441:755–778. doi: 10.1113/jphysiol.1991.sp018777. [DOI] [PMC free article] [PubMed] [Google Scholar]
- Hassner A, Birnbaum D, Loew LM. Charge shift probes of membrane potential. Synthesis. Journal of Organic Chemistry. 1984;49:2546–2551. [Google Scholar]
- Heitler WJ, Goodman CS. Multiple sites of spike initiation in a bifurcating locust neuron. Journal of Experimental Biology. 1978;76:63–84. [Google Scholar]
- Hoffman DA, Magee JC, Colbert CM, Johnston D. K+ channel regulation of signal propagation in dendrites of hippocampal pyramidal neurons. Nature. 1997;387:869–875. doi: 10.1038/43119. [DOI] [PubMed] [Google Scholar]
- Horn CC, Benjamin PR, Weiss KR, Kupfermann I. Decrement of the response of a serotonergic modulatory neuron (the metacerebral cell) in Aplysia, during repeated presentation of appetitive (food) stimuli. Neuroscience Letters. 1999;267:161–164. doi: 10.1016/s0304-3940(99)00339-0. [DOI] [PubMed] [Google Scholar]
- Hughes GM, Wiersma CAG. Neuronal pathways and synaptic connections in the abdominal cord of the crayfish. Journal of Experimental Biology. 1960;37:291–307. [Google Scholar]
- Huguenard JR, Hamill OP, Prince DA. Sodium channels in dendrites of rat cortical pyramidal neurons. Proceedings of the National Academy of Sciences of the USA. 1989;86:2473–2477. doi: 10.1073/pnas.86.7.2473. [DOI] [PMC free article] [PubMed] [Google Scholar]
- Kandel ER, Tauc L. Input organization of two symmetrical giant cells in the snail brain. The Journal of Physiology. 1965;183:269–286. doi: 10.1113/jphysiol.1966.sp007866. [DOI] [PMC free article] [PubMed] [Google Scholar]
- Korn H, Bennett MVL. Dendritic and somatic impulse initiation in fish oculomotor neurons during vestibular nystagmus. Brain Research. 1971;27:169–175. doi: 10.1016/0006-8993(71)90379-9. [DOI] [PubMed] [Google Scholar]
- Kriebel ME, Bennett MVL, Waxman SG, Pappas GD. Oculomotor neurons in fish: Electrotonic coupling and multiple sites of impulse initiation. Science. 1969;166:520–524. doi: 10.1126/science.166.3904.520. [DOI] [PubMed] [Google Scholar]
- Kupferman I, Weiss KR. Activity of the identified serotonergic neuron in free moving Aplysia correlates with behavioral arousal. Brain Research. 1982;241:334–337. doi: 10.1016/0006-8993(82)91072-1. [DOI] [PubMed] [Google Scholar]
- Lasser-Ross N, Ross WN. Imaging voltage and synaptically activated sodium transients in cerebellar Purkinje cells. Proceedings of the Royal Society B. 1992;247:35–39. doi: 10.1098/rspb.1992.0006. [DOI] [PubMed] [Google Scholar]
- Llinás R, Sugimori M. Electrophysiological properties of in vitro Purkinje cell dendrites in mammalian cerebellar slices. The Journal of Physiology. 1980;305:197–213. doi: 10.1113/jphysiol.1980.sp013358. [DOI] [PMC free article] [PubMed] [Google Scholar]
- Magee JC, Johnston D. Synaptic activation of voltage-gated channels in the dendrites of hippocampal pyramidal neurons. Science. 1995;268:301–304. doi: 10.1126/science.7716525. [DOI] [PubMed] [Google Scholar]
- Mainen ZF, Joerges J, Huguenard JR, Sejnowski TJ. A model of spike initiation in neocortical pyramidal neurons. Neuron. 1995;15:1427–1439. doi: 10.1016/0896-6273(95)90020-9. [DOI] [PubMed] [Google Scholar]
- Melinek R, Muller JK. Action potential initiation site depends on neuronal excitation. Journal of Neuroscience. 1996;16:2585–2591. doi: 10.1523/JNEUROSCI.16-08-02585.1996. [DOI] [PMC free article] [PubMed] [Google Scholar]
- O'Shea M. Two sites of axonal spike initiation in a bimodal interneuron. Brain Research. 1975;96:93–98. doi: 10.1016/0006-8993(75)90577-6. [DOI] [PubMed] [Google Scholar]
- Rall W. Distinguishing theoretical synaptic potentials computed for different soma-dendritic distributions of synaptic inputs. Journal of Neurophysiology. 1967;30:1138–1168. doi: 10.1152/jn.1967.30.5.1138. [DOI] [PubMed] [Google Scholar]
- Segev I, Schneidman E. Axons as computing devices: Basic insight gained from models. The Journal of Physiology (Paris) 1999;93:263–270. doi: 10.1016/s0928-4257(00)80055-8. [DOI] [PubMed] [Google Scholar]
- Smith DO. Mechanisms of action potential propagation failure at sites of axon branching in the crayfish. The Journal of Physiology. 1980;301:243–259. doi: 10.1113/jphysiol.1980.sp013202. [DOI] [PMC free article] [PubMed] [Google Scholar]
- Spruston N, Schiller Y, Stuart GJ, Sakmann B. Activity-dependent action potential invasion and calcium influx into hippocampal CA1 dendrites. Science. 1995;268:297–300. doi: 10.1126/science.7716524. [DOI] [PubMed] [Google Scholar]
- Stuart GJ, Häusser M. Initiation and spread of sodium action potentials in cerebellar Purkinje cells. Neuron. 1994;13:703–712. doi: 10.1016/0896-6273(94)90037-x. [DOI] [PubMed] [Google Scholar]
- Stuart GJ, Sakmann B. Active propagation of somatic action potentials into neocortical pyramidal cell dendrites. Nature. 1994;367:69–72. doi: 10.1038/367069a0. [DOI] [PubMed] [Google Scholar]
- Stuart G, Spruston N, Sakmann B, Häusser M. Action potential initiation and backpropagation in neurons of the mammalian CNS. Trends in Neurosciences. 1997;20:125–131. doi: 10.1016/s0166-2236(96)10075-8. [DOI] [PubMed] [Google Scholar]
- Tauc L. Site of origin and propagation of spike in the giant neuron of Aplysia. Journal of General Physiology. 1962;45:1077–1097. doi: 10.1085/jgp.45.6.1077. [DOI] [PMC free article] [PubMed] [Google Scholar]
- Tauc L, Hughes GH. Modes of initiation and propagation of spikes in the branching axon of molluscan central neurons. Journal of General Physiology. 1963;46:533–549. doi: 10.1085/jgp.46.3.533. [DOI] [PMC free article] [PubMed] [Google Scholar]
- Traub RD, Jefferys JG, Miles R, Whittington MA, Tóth K. A branching dendritic model of a rodent CA3 pyramidal neuron. The Journal of Physiology. 1994;481:79–95. doi: 10.1113/jphysiol.1994.sp020420. [DOI] [PMC free article] [PubMed] [Google Scholar]
- Vedel JP, Moulins M. A motor neuron involved in two centrally generated motor patterns by means of two different spike initiating sites. Brain Research. 1978;138:347–352. doi: 10.1016/0006-8993(77)90751-x. [DOI] [PubMed] [Google Scholar]
- Wall DP. Do nerve impulses penetrate terminal arborizations? A pre-presynaptic control mechanism. Trends in Neurosciences. 1995;18:99–103. doi: 10.1016/0166-2236(95)93883-y. [DOI] [PubMed] [Google Scholar]
- Wong RKS, Pearson KG. Limitations on impulse conduction in the terminal branches of insect sensory nerve fibers. Brain Research. 1975;100:431–436. doi: 10.1016/0006-8993(75)90496-5. [DOI] [PubMed] [Google Scholar]
- Wong RKS, Prince DA, Busbaum AI. Intradendritic recordings from hippocampal neurons. Proceedings of the National Academy of Sciences of the USA. 1979;76:986–990. doi: 10.1073/pnas.76.2.986. [DOI] [PMC free article] [PubMed] [Google Scholar]
- Wu JY, Cohen LB. Fast multi-site optical measurement of membrane potential. In: Mason WT, editor. Fluorescent and Luminescent Probes for Biological Activity. New York: Academic Press; 1993. pp. 389–404. [Google Scholar]
- Yau KW. Receptive fields, geometry and conduction block of sensory neurons in the central nervous system of the leech. The Journal of Physiology. 1976;263:513–538. doi: 10.1113/jphysiol.1976.sp011643. [DOI] [PMC free article] [PubMed] [Google Scholar]
- Yeoman MS, Brierley M, Benjamin PR. Central pattern generator interneurons are targets for the modulatory serotonergic cerebral giant cell in the feeding system of Lymnaea. Journal of Neurophysiology. 1996;75:11–25. doi: 10.1152/jn.1996.75.1.11. [DOI] [PubMed] [Google Scholar]
- Yeoman MS, Kemenes G, Benjamin PR, Elliott CJ. Modulatory role for the serotonergic cerebral giant cells in the feeding system of the snail, Lymnaea. II. Photoinactivation. Journal of Neurophysiology. 1994;72:1372–1381. doi: 10.1152/jn.1994.72.3.1372. [DOI] [PubMed] [Google Scholar]
- Zecevic D. Multiple spike-initiation zones in single neurons revealed by voltage-sensitive dyes. Nature. 1996;381:322–325. doi: 10.1038/381322a0. [DOI] [PubMed] [Google Scholar]