

Abstract
In the present study Ca2+ entry via different voltage-dependent membrane channels was examined with a fluorescent Ca2+ indicator before and after β-adrenergic stimulation.
To clearly distinguish between Ca2+ influx and Ca2+ release from the sarcoplasmic reticulum the Ca2+ store was blocked with 0.1 μm thapsigargin and 10 μm ryanodine. Omitting Na+ from the pipette filling solution minimized Ca2+ entry via Na+-Ca2+ exchange.
Individual guinea-pig ventricular myocytes were voltage clamped in the whole-cell configuration of the patch-clamp technique and different membrane currents were activated using specific voltage protocols. The intracellular Ca2+ concentration was simultaneously recorded with a laser-scanning confocal microscope using fluo-3 as a Ca2+ indicator.
Ca2+ entry pathways were discriminated using pharmacological blockers under control conditions and during β-adrenergic stimulation with 1 μm isoproterenol (isoprenaline) in the bathing solution or 100 μm cAMP in the patch-clamp pipette.
Isoproterenol or cAMP potentiated the Ca2+ influx signals recorded during L-type Ca2+ current activation but, more interestingly, also during Na+ current (INa) activation. The Ca2+ influx signal arising from L-type Ca2+ current activation was usually blocked by 50 μm Cd2+. However, the Ca2+ influx signal elicited by the Na+ current activation protocol was only curtailed to 56.4 ± 28.2% by 100 μm Ni2+ but was reduced to 17.9 ± 15.1% by 50 μm Cd2+ and consistently eliminated by 5 mm Ni2+.
The pronounced Cd2+ and moderate Ni2+ sensitivity of the Ca2+ influx signals suggested that the predominant source of Ca2+ influx during the Na+ current activation – before and during β-adrenergic stimulation – was a spurious activation of the L-type Ca2+ current, presumably due to voltage escape during Na+ current activation.
Calculations based on the relationship between Ca2+ current and fluorescence change revealed that, on average, we could reliably detect rapid Ca2+ concentration changes as small as 5.4 ± 0.7 nm. Thus, we can estimate an upper limit for the Ca2+ permeability of the phosphorylated TTX-sensitive Na+ channels which is less than 0.04:1 for Ca2+ ions flowing through Na+ channels via the proposed ‘slip-mode’ Ca2+ conductance. Therefore the slip-mode Ca2+ conductance of Na+ channels does not contribute noticeably to the Ca2+ signals observed in our experiments.
Excitation-contraction coupling (EC coupling) and Ca2+ signalling in cardiac muscle are thought to be mediated by Ca2+ influx via the L-type Ca2+ current which subsequently triggers a much larger Ca2+ release from the sarcoplasmic reticulum (SR) by Ca2+-induced Ca2+ release (CICR) (Fabiato, 1985; Bers, 1991). In contrast, skeletal muscle EC coupling is believed not to require an influx of Ca2+. Instead, a direct mechanical connection links the voltage sensors with the SR Ca2+ release channels to control Ca2+ release by an allosteric interaction (Schneider & Chandler, 1973; Rios et al. 1992). Recently, several additional pathways that may trigger Ca2+ release from the SR of cardiac muscle have been proposed. These include Ca2+ entry via the voltage-sensitive Na+-Ca2+ exchange during the depolarization (Levi et al. 1994), possibly enhanced by subsarcolemmal Na+ accumulation during INa activation (Leblanc & Hume, 1990; Lipp & Niggli, 1994). In addition, Ca2+ influx via the T-type Ca2+ current has been reported to trigger slow CICR (Sipido et al. 1998).
Even more trigger pathways have been noted in cardiac muscle after β-adrenergic stimulation. One of these mechanisms has been attributed to Ca2+ influx via TTX-sensitive Na+ channels occurring after phosphorylation (‘slip-mode Ca2+ conductance’; Santana et al. 1998; Cruz et al. 1999). By analogy with skeletal muscle, the existence of a purely voltage-activated SR Ca2+ release mechanism operating in the same voltage range has also been proposed (Hobai et al. 1997b; Ferrier et al. 1998). However, after β-adrenergic stimulation the CICR mechanism may operate under a high gain regime where a tiny influx of Ca2+ could be sufficient to trigger Ca2+ release. It is very difficult to rule out a small amount of Ca2+ entry via, for example, incompletely blocked Ca2+ channels (Trafford & Eisner, 1998). Therefore, we decided to apply a fluorescent indicator technique to examine Ca2+ influx via voltage-dependent membrane channels activated during the voltage-clamp protocols used in this study, both before and during β-stimulation. To analyse Ca2+ influx without contamination by Ca2+ release from the SR, CICR was suppressed with ryanodine and SR Ca2+ uptake was blocked with thapsigargin, except in a few initial control experiments. Ca2+ influx via the Na+-Ca2+ exchange was minimized by omitting Na+ from the pipette filling solution because this pathway has been investigated in separate studies (Lipp & Niggli, 1994; Niggli & Lipp, 1996). Preliminary findings on the analysed Ca2+ influx pathways have been communicated to the Biophysical Society in abstract form (DelPrincipe et al. 1999).
METHODS
Cell preparation
Experiments were performed on single ventricular myocytes isolated from the guinea-pig (Cavia porcellus). Adult animals were killed by cervical dislocation and the hearts rapidly removed and retrogradely perfused on a Langendorff perfusion system at 37°C. The perfusion solution contained (mm): NaCl 135, KCl 5.4, MgCl2 1, NaH2PO4 0.33, Hepes 5, glucose 11, pH adjusted to 7.3 with NaOH. After 5 min, collagenase B (Boehringer Mannheim, Rotkreuz, Switzerland) and protease type XIV (Sigma, Buchs, Switzerland) were added to final concentrations of 0.2 mg ml−1 and 0.04 mg ml−1, respectively, and the perfusion continued for another 4–6 min. Subsequently, the ventricles were minced and placed in perfusion solution containing 200 μm CaCl2 on a rocking table to allow for dissociation of the tissue.
Cells were taken from the supernatant, transferred into a recording chamber with a coverslip floor and mounted onto the stage of an inverted microscope (Diaphot TMD, Nikon, Küsnacht, Switzerland). Ca2+ resistant cells readily adhered to the uncoated coverslip and were constantly superfused (1–2 ml min−1) with extracellular solution containing (mm): NaCl 140, KCl 5, MgCl2 1, CaCl2 1, Hepes 10, glucose 10, pH adjusted to 7.4 with NaOH. Most experiments were carried out at room temperature (22°C), but some control experiments were performed at 37°C.
Electrophysiological recordings
Recording electrodes were pulled from filamented borosilicate glass capillaries (GC150F, Clark Electromedical Instruments, Pangbourne, UK) on a horizontal puller (DMZ, Zeitz Instrumente, Augsburg, Germany) and filled with intracellular solution containing (mm): caesium aspartate 120, TEA-Cl 20, Hepes 10, MgATP 5, MgCl2 1, fluo-3 0.1, pH adjusted to 7.2 with CsOH. Sodium was omitted to minimize Ca2+ entry via reverse-mode operation of the Na+-Ca2+ exchanger. Typical pipette resistances were around 2 MΩ. Cells were voltage clamped in the whole-cell configuration and held at −70 mV without correction for junction potentials using an Axopatch 200 amplifier (Axon Instruments, Foster City, CA, USA).
Na+ inward currents were activated by holding the voltage at −90 mV for 1.5 s before stepping to −40 mV for 50 ms. In the presence of 5 mm Ni2+ we observed a shift of the Na+ current activation curve of about +20 mV which was due to surface charge screening effects (McLaughlin, 1989). Therefore, to activate a Na+ current of similar amplitude in the presence of 5 mm Ni2+ the voltage was stepped to −20 mV. L-type Ca2+ currents were activated by holding the voltage at −40 mV for 1.5 s before stepping to +10 mV for 200 ms. During the Ca2+ release experiments, the cells were paced with a series of depolarizing voltage pulses (from −70 to 0 mV for 200 ms at 1 Hz) before each sweep to activate L-type Ca2+ currents and refill the SR.
Series resistance was compensated to about 60–75% with the built-in compensation circuit of the amplifier. Current recordings showing poor voltage control due to changes in series resistance were not used for analysis. No on-line leak subtraction was performed. For calculations, where the pure Ca2+ current was to be integrated, the current recorded in the presence of 50 μm Cd2+ was subtracted off-line. Currents were low-pass filtered at 5 or 10 kHz and digitized at 10 kHz using an A/D converter and the LabView acquisition software (National Instruments, Ennetbaden, Switzerland). Data were stored on hard disk for later analysis with the IgorPro software (WaveMetrics, Lake Oswego, OR, USA).
Confocal Ca2+ measurements
Cells were viewed with a × 63 oil-immersion objective lens (Neofluar, NA = 1.25, Zeiss, Oberkochen, Germany) and loaded with fluo-3 through the recording pipette. Fluo-3 was excited with the 488 nm line of an argon laser (model 5000, Ion Laser Technology, Salt Lake City, USA) at 150 μW intensity on the cell. The fluorescence was detected at 540 ± 15 nm with the photomultiplier tube (PMT) of a laser-scanning confocal system (MRC 1000, Bio-Rad, Glattbrugg, Switzerland) operated in the line-scan mode. The scan speed was set to 2 or 6 ms per line. The 512 lines recorded in one frame thus corresponded to 1.024 or 3.072 s, respectively. When long current trains were recorded, the speed was set to 13.28 ms per line. Each line-scan image contained a signal from a red light diode which was synchronized with the voltage protocol and recorded with the second PMT of the confocal system (> 600 nm).
Fluorescence images were processed using a customized version of the public domain NIH Image program (developed at the US National Institutes of Health and available on the Internet at http://rsb.info.nih.gov/nih-image/). Mean Ca2+ concentration profiles were extracted from fluorescence images and calculated with the IgorPro software using an established self-ratio calibration procedure (Cheng et al. 1993). We assumed a resting Ca2+ concentration of 100 nm at the beginning of each experiment and a Kd for fluo-3 of 500 nm.
Materials
All chemicals used were of reagent grade and dissolved in distilled water of cell culture grade. Thapsigargin and tetrodotoxin (TTX) were purchased from Alomone Labs (Jerusalem, Israel), ryanodine from Calbiochem (La Jolla, CA, USA), isoproterenol ([-]-N-isopropyl-l-noradrenaline hydrochloride) from Fluka (Buchs, Switzerland), cAMP (adenosine 3′,5′-monophosphate, free acid) from Sigma (Buchs, Switzerland) and fluo-3 (pentapotassium salt) from TefLabs (Austin, TX, USA).
Cells were incubated with thapsigargin and ryanodine for 30 min after the dissociation process to block the SR Ca2+ pump and the ryanodine receptor. Thapsigargin was dissolved as 1 mm stock in ethanol and used at 0.1 μm. Ryanodine was dissolved as 1 mm stock in distilled water and used at a concentration of 10 μm. Isoproterenol was freshly prepared as a 10 mm stock in an aqueous 1 mm L-ascorbic acid solution before each experiment and added at a concentration of 1 μm to the extracellular solution. Cyclic AMP was freshly prepared as a 10 mm aqueous stock and added to the pipette solution at a concentration of 100 μm. Drugs were delivered to the cells by means of a gravity-driven rapid superfusion system placed in the vicinity (∼200 μm) of the cell selected for an experiment.
RESULTS
Potentiation of Ca2+ signals by β-adrenergic stimulation
In most experiments we used isoproterenol as an agonist for the β-adrenergic receptors. The β-adrenergic receptors represent the starting point of the signalling cascade leading to elevated levels of cAMP and subsequent activation of protein kinases (for reviews, see Tsien, 1977; Reuter, 1983). The main advantage of isoproterenol over cAMP is its convenient and rapid extracellular administration, which allowed us to record data under control and test conditions in one and the same cell. In addition, by comparing test data with control values we could check for the presence of the complete signalling cascade. The concentration of isoproterenol used, 1 μm, is about 100-fold the EC50 (Katsube et al. 1996; Calaghan et al. 1998) and was chosen to activate a large fraction of the β-receptors. To assess the effects of isoproterenol on the Ca2+ current, the Na+ current and Ca2+ release from the SR, we applied a specific voltage protocol based on the activation and inactivation curves of each current. L-type Ca2+ currents were activated by depolarizing from a holding potential of −40 mV to +10 mV for 200 ms, whereas Na+ currents were activated by depolarizing the cell from −90 mV to −40 mV for 50 ms (Weidmann, 1955). In previous experiments we had confirmed that under our experimental conditions we activated maximal currents and that the currents were separable with these voltage protocols. This could be verified from the amplitudes and from the distinct time courses of the two currents.
Figure 1 shows representative results obtained from two cells. In the absence of ryanodine and thapsigargin activation of L-type Ca2+ currents produced large Ca2+ signals as a result of Ca2+ influx and CICR from the SR (Fig. 1A, left panel). The administration of 1 μm isoproterenol to the same cell resulted in a ∼2-fold potentiation of both the L-type Ca2+ current and the Ca2+ transient (Fig. 1A, right panel). In most cells, activation of the Na+ current produced a clear Ca2+ signal which was markedly smaller than that produced by activation of the Ca2+ current, even before β-adrenergic stimulation (Fig. 1B, left panel; note change in scale). In some cells, no Ca2+ signal could be detected at all during a Na+ current voltage-clamp protocol. However, after the application of 1 μm isoproterenol the Ca2+ signal either increased in amplitude (Fig. 1B, right) or became visible in the cells where it was not detectable in the control solution. The Ca2+ signals activated by INa had a faster onset than the Ca2+ signals activated by ICa, typically peaking within 6 ms. Occasionally, the inactivation of INa appeared to be slowed down and formed a shoulder in the inactivation phase of the current (Fig. 1, expanded current traces shown in red; see below for discussion). In general, the amplitude of the recorded INa was quite variable among different cells under both control conditions and β-adrenergic stimulation.
Figure 1. Simultaneous recording of inward current and Ca2+ release.
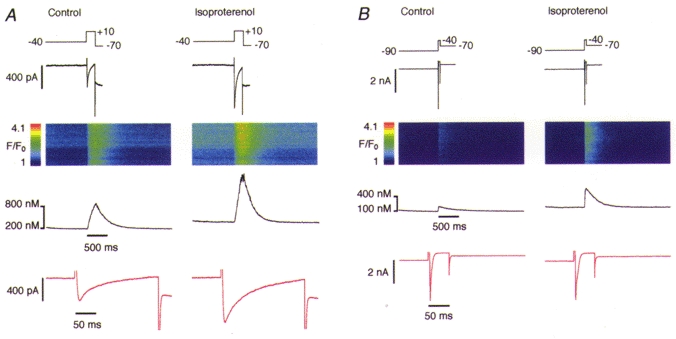
A, activation of the L-type Ca2+ current (200 ms) elicited a substantial Ca2+ release signal. Both the current and the Ca2+ signal were markedly enhanced by administration of 1 μm isoproterenol in the bathing solution. B, in an analogous experiment, activation of the Na+ current (50 ms) in a different cell showed smaller Ca2+ signal amplitudes but similar β-adrenergic potentiation. Traces show from top to bottom: voltage protocol (mV), current record, line-scan image, mean Ca2+ concentration profile, same current record expanded 10 times (red traces, not temporally aligned to the other signals).
Potentiation of Ca2+ influx by β-adrenergic stimulation
As mentioned above, the positive feedback of CICR can vary considerably under different SR Ca2+ loads (Han et al. 1994; Spencer & Berlin, 1995; Bassani et al. 1995). The gain can reach levels where the influx of a minute amount of Ca2+ could trigger some Ca2+ release from the SR by Ca2+-induced Ca2+ release, which then becomes self-sustaining. Particularly in the presence of high levels of cAMP, the SR Ca2+ pump is disinhibited due to phosphorylation of phospholamban, whereby Ca2+ uptake into the SR is increased and Ca2+ release is enhanced (Tsien & Weingart, 1976; Calaghan et al. 1998). An increased SR Ca2+ load presumably renders the SR Ca2+ release channels more sensitive to trigger Ca2+ (Györke & Györke, 1998). To obtain direct information about the various Ca2+ influx pathways and how they might be modulated by β-adrenergic stimulation we used pharmacological tools that allowed us to reduce the complexity inherent in cardiac Ca2+ signalling. For this purpose, we suppressed the SR Ca2+ release and uptake with 10 μm ryanodine and 0.1 μm thapsigargin. Thus, after the initial control experiments shown above, we recorded Ca2+ signals arising exclusively from Ca2+ influx via the plasmalemma and we relied on the confocal microscope system for the detection of Ca2+ influx signals without any amplification by the SR. Residual SR activity would manifest itself in the form of Ca2+ sparks or Ca2+ waves in the line-scan images. Figure 2 shows examples of Ca2+ influx signals elicited by ICa and INa in a cell with blocked SR function. The amplitudes of the Ca2+ influx transients were severalfold smaller than in cells not treated with ryanodine and thapsigargin, confirming the absence of a Ca2+ release component (note the absence of sparks). Nevertheless, a potentiation of the Ca2+ influx transient by isoproterenol was still evident in all cells analysed with both voltage-clamp protocols (i.e. during both ICa and INa).
Figure 2. Simultaneous recording of inward current and Ca2+ influx.
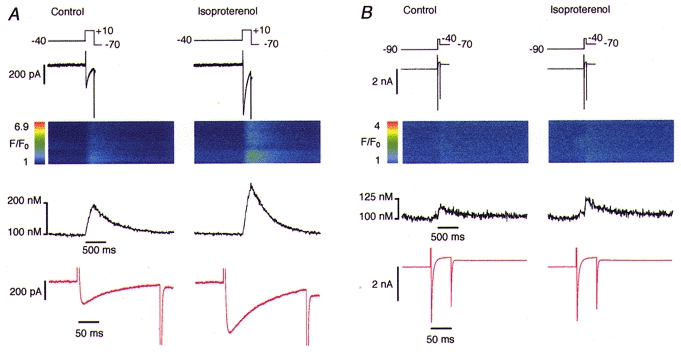
SR Ca2+ release was blocked by treating the cells with 0.1 μm thapsigargin and 10 μm ryanodine. Na+ current was activated in the presence of 1 μm isoproterenol. A, activation of L-type Ca2+ current elicited an detectable Ca2+ influx signal with reduced amplitude due to the blockade of the SR release (note the absence of sparks). A potentiating effect of isoproterenol on the current amplitude and the Ca2+ signal is evident. B, analogous experiment with activation of the Na+ current. Note the change in the scale and the small amplitude of the Ca2+ signals. Traces are arranged in the same way as in Fig. 1.
Identification of Ca2+ influx pathways during β-adrenergic stimulation
While an increase of the Ca2+ influx signal via L-type Ca2+ current during β-adrenergic stimulation can easily be explained by the known effect of L-type Ca2+ channel phosphorylation (Kameyama et al. 1985; Katsube et al. 1996), the reason for the changes observed during the INa activation protocol was not clear. Having a reproducible experimental protocol available to show the significant potentiating effect of β-stimulation on Ca2+ influx, we tried to identify the Ca2+ entry pathway that, first, was enhanced by β-stimulation and, second, was manifest during the voltage-clamp protocol designed to activate INa only. Considering the known Ca2+ entry pathways present in heart cells (Bers, 1991; Boyett et al. 1996), we used pharmacological tools to block L- and T-type Ca2+ channels and also the Na+-Ca2+ exchanger.
Initially, we applied various concentrations of Ni2+, an ion that is known to block T-type Ca2+ currents at micromolar concentrations and L-type Ca2+ currents (and the Na+-Ca2+ exchange current, INa-Ca) at millimolar concentrations (McDonald et al. 1994; Lee et al. 1999). The effect of Ni2+ on the Ca2+ influx signal observed during INa in our experiments was strongly dose dependent (see Fig. 3). The Ca2+ influx amplitude was reduced to 80.9 ± 19.4% of the control by 50 μm Ni2+ (n = 7). With 100 μm Ni2+ in the extracellular solution the Ca2+ influx signal amplitude was 56.4 ± 28.2% of the control (n = 8). Interestingly, the Ca2+ influx signal elicited by INa activation was only reduced to undetectable levels by a high concentration of Ni2+ (5 mm; n = 15 cells). Figure 3B shows the blocking effect of 5 mm Ni2+ on a substantial Ca2+ influx signal. Note that in the presence of 5 mm Ni2+ the activation curve for INa was shifted by +20 mV and thus we had to depolarize the cell to −20 mV to elicit a comparable current amplitude (Fig. 3B, right panel, top trace). Thus, it appeared that millimolar concentrations of Ni2+ were required to reliably suppress Ca2+ influx during the voltage-clamp protocol designed to elicit INa.
Figure 3. Pharmacological identification of the Ca2+ influx pathway.
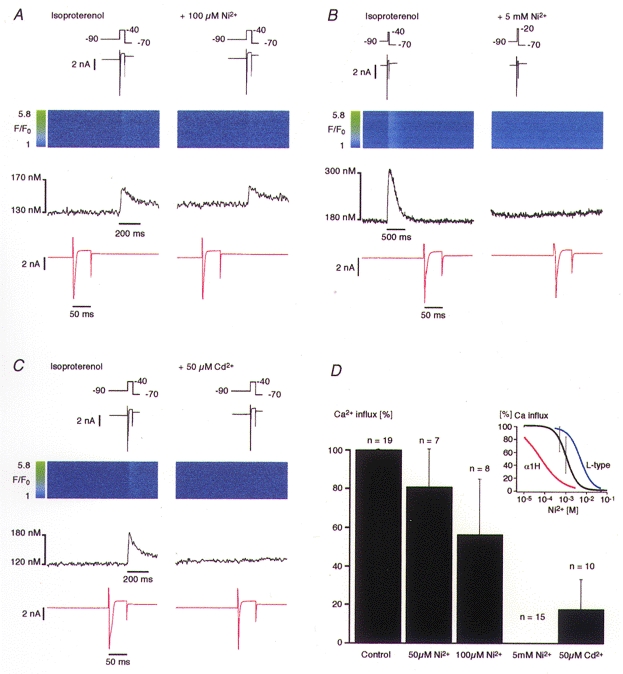
All cells were treated with 0.1 μm thapsigargin and 10 μm ryanodine. Na+ current was activated in the presence of 1 μm isoproterenol. A, the administration of 100 μm Ni2+ failed to block the Ca2+ influx signal. However, a slight reduction of the Ca2+ signal amplitude is noticeable. B, the administration of 5 mm Ni2+ blocked the Ca2+ signal completely. C, the Ca2+ influx signal was eliminated by 50 μm Cd2+. Traces are arranged in the same way as in Fig. 1. D, normalized Ca2+ influx amplitudes versus different concentrations of Ni2+ and of 50 μm Cd2+. Data are plotted as means ±s.d. The inset shows a Hill function fitted to the data points of the Ni2+ block. The calculated IC50 was 114 ± 33.2 μm (95% confidence); the Hill coefficient was 1.71. For comparison, the Hill function of the Ni2+ dose-response curves of the L-type current in guinea-pig ventricular myocytes (blue trace, taken from Hobai et al. 1998) and in the human heart T-type α1H subunit (T-type, red trace, taken from Lee et al. 1999) have been added.
For a quantitative analysis the averaged and normalized Ca2+ influx amplitudes were plotted against the Ni2+ concentration and fitted with a Hill function (Fig. 3D, inset). The function revealed an IC50 of 114 ± 33.2 μm (confidence interval 95%) and a Hill coefficient of about 1.71. These values are approximately in the same range as the values obtained for Ni2+-induced block of the L-type Ca2+ current in guinea-pig ventricular myocytes stimulated with 100 μm cAMP (IC50 of about 510 μm and a Hill coefficient of about 1.48: Hobai et al. 1998; see Fig. 3D, inset, blue line). For comparison, the Hill function of the human heart T-type α-subunit (α1H) is also plotted in the same graph (Fig. 3D, inset, red line). The dose-response data for this line were obtained from recombinant α1H subunits expressed in human embryonic kidney HEK-293 cells or Xenopus oocytes (Lee et al. 1999). In contrast to the L-type Ca2+ current, these data yielded an IC50 of about 12 μm (HEK-293) or 5.7 μm (oocytes), with Hill coefficients of about 0.77. It is worth noting that we measured fluorescence changes caused by Ca2+ influx and not a membrane current. Thus, a direct comparison is not straightforward. Nevertheless, the IC50 for Ni2+-induced block of Ca2+ influx that we obtained is comparable to that for L-type Ca2+ channels but 10- to 20-fold higher than that for the T-type Ca2+ channels.
The next tool we used was Cd2+ which should noticeably block the L-type Ca2+ current at 50 μm while minimally affecting the T-type Ca2+ current or the Na+-Ca2+ exchanger (Hobai et al. 1997a). Figure 3C shows the blocking effect of 50 μm Cd2+ on the Ca2+ influx signal. This low dose of Cd2+ reduced the Ca2+ influx signal observed during INa activation to an average of 17.9 ± 15.1% of control values (n = 10; Fig. 3D). In addition, the shoulder present during INa inactivation was removed by this inhibitor, suggesting that it was carried by a Cd2+-sensitive current, most likely the L-type Ca2+ current. The clear-cut effect of Cd2+, suggesting Ca2+ influx via L-type Ca2+ channels, does not imply that other sources of Ca2+ cannot contribute to a Ca2+ signal under different conditions, particularly when Na+-Ca2+ exchange is not minimized (Leblanc & Hume, 1990; Lipp & Niggli, 1994; Niggli & Lipp, 1996) or when the amplification by SR Ca2+ release is not suppressed (Santana et al. 1998).
We were also interested in examining whether the same results could be reproduced by elevating intracellular cAMP directly via the patch pipette instead of applying isoproterenol. In these experiments the concentration of cAMP in the pipette solution was 100 μm to provide maximal stimulation of cAMP-dependent protein kinase (Kameyama et al. 1985). In addition, the high concentration in the pipette was necessary to counteract the reduction in cAMP concentration caused by phosphodiesterase activity (Kameyama et al. 1985). To maximize putative Ca2+ entry via phosphorylated sodium channels (Santana et al. 1998), we also increased extracellular Ca2+ to 10 mm in some of these experiments. The results obtained in the presence of intracellular cAMP were essentially the same as those with isoproterenol added to the bath. Figure 4A shows a representative recording where the Ca2+ influx signal, in the presence of 100 μm cAMP in the pipette, was completely abolished by 5 mm Ni2+.
Figure 4. Ca2+ influx under elevated cAMP and blockade by TTX.
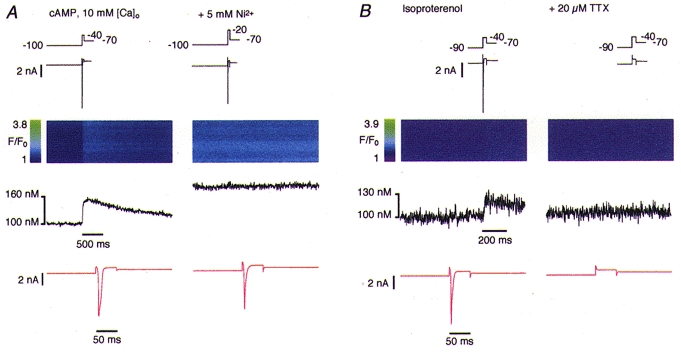
A, with 100 μm cAMP in the pipette filling solution, activation of INa elicited a Ca2+ influx signal which was blocked by 5 mm Ni2+. Note the increase in fluorescence in the right line-scan, which is due to elevated extracellular Ca2+ (10 mm). B, the Na+ current and the Ca2+ influx signal elicited in the presence of 1 μm isoproterenol were completely blocked by 20 μm TTX.
To provide evidence that the Ca2+ influx signal we observed was related to INa and not to the voltage change or to shifts of ICa activation and gating we blocked the Na+ channels with 10–20 μm TTX. Figure 4B shows that as INa disappeared after application of 20 μm TTX the Ca2+ influx signal also vanished, suggesting that activation of INa is indeed required to initiate the observed Ca2+ influx.
Ca2+ influx during trains of INa
Inspired by a recent report on Ca2+ influx via sodium channels (Santana et al. 1998), we adopted a strategy designed to favour Ca2+ entry through this proposed pathway using a vigorous voltage-clamp protocol. To obtain better control over the voltage we used lower resistance electrodes (∼1 MΩ) and attempted to elicit larger Na+ currents. In addition, we applied trains of INa in order to accumulate the presumably small Ca2+ influx signal which we otherwise might have missed with our detection system (see below).
Figure 5A documents an experiment where we applied a train of 50 depolarizing voltage pulses at 33 Hz in the presence of 1 μm isoproterenol. Care was taken to space the pulses appropriately to allow INa to recover from inactivation. This protocol led to a substantial current amplitude (Fig. 5A, expanded current shown in red). The Ca2+ influx signal increased progressively during the train reaching a plateau at the end (Fig. 5A, left). However, the Ca2+ influx signal was again completely abolished in the presence of 5 mm Ni2+ (Fig. 5A, right). Figure 5B shows a similar experiment that was performed with 100 μm cAMP in the pipette instead of administration of isoproterenol and with a train of 100 depolarizing pulses. Once more, the Ca2+ influx was abolished by 5 mm Ni2+. To test whether the proposed Ca2+ influx through TTX-sensitive Na+ channels was sensitive to temperature under these conditions, like, for instance, the proposed voltage-sensitive Ca2+ release (Hobai et al. 1997b; Ferrier et al. 1998), the same experiments were repeated at 37°C (n = 6). The results were identical to those observed at room temperature (data not shown).
Figure 5. Forced Ca2+ influx under extreme conditions.
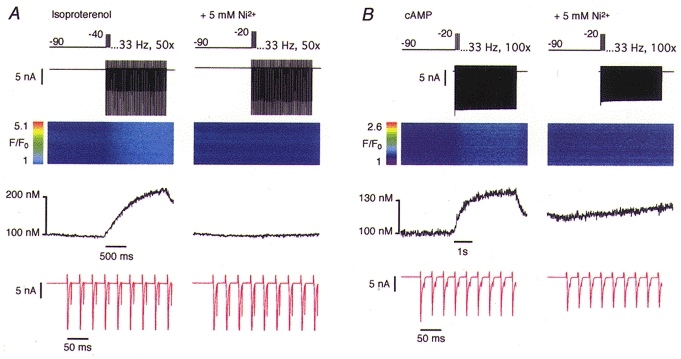
SR release was blocked and the Na+ current was activated repetitively in the presence of 1 μm isoproterenol. A, a Ca2+ influx signal could be elicited by a train of 50 depolarizing pulses at 33 Hz. The Ca2+ influx signal was eliminated by 5 mm Ni2+. B, an analogous experiment was performed in the absence of isoproterenol but with 100 μm cAMP in the pipette filling solution. Sodium currents were activated repetitively 100 times at 33 Hz.
Sometimes a small and slowly progressive elevation of the resting Ca2+ concentration was detectable (see, for example, Figs 3B and 5B). However, this rise did not coincide temporally with the voltage-clamp pulses. This monotonic rise in [Ca2+]i may be attributed to block of the Na+-Ca2+ exchanger by 5 mm Ni2+ which prevented any extrusion of Ca2+ entering by slow leakage through the plasmalemma.
Estimation of the detection limit for Ca2+ entry
As we relied on confocal Ca2+ fluorescence measurements to detect Ca2+ influx across the sarcolemma, we were interested in determining the detection limit of our system. This would enable us, based on theoretical assumptions, to estimate the minimal amount of Ca2+ entering the cell that can be detected. In addition, we could indirectly calculate the maximal permeability of TTX-sensitive Na+ channels to Ca2+ ions that would be consistent with our results. Since we were dealing with changes in Ca2+ concentration, the relevant parameter determining the detection limit was the signal-to-noise ratio of the fluorescence record. Therefore, we determined the noise in a typical line-scan image recorded at the beginning of an experiment. We assumed a resting Ca2+ concentration of 100 nm and a Kd of fluo-3 for Ca2+ of 500 nm, values on which we based our calibrations for all data presented. Statistical analysis of different mean Ca2+ concentration profiles yielded a mean noise level of 1.78 ± 0.24 nm (r.m.s. ±s.d., n = 10).
In a subsequent computer simulation, we added step increases of [Ca2+] to a Ca2+ concentration profile recorded from one particular cell and were thus mimicking the Ca2+ influx signal observed during INa activation (Fig. 6). The amplitudes of the steps corresponded to multiples of the standard deviation of the noise derived from the same record. We identified the [Ca2+] step which we could detect by eye and defined our detection limit to be 3 standard deviations of the noise. This turned out to be ∼8 nm in the fairly noisy record shown in Fig. 6, or ∼5.34 nm on average. It is well known that each calibration procedure relies on several assumptions. The Kd of fluo-3 in the cytoplasmic environment can differ considerably from the in vitro value (Harkins et al. 1993). In addition, in the presence of a low intracellular Na+ concentration the resting Ca2+ concentration could be lower than 100 nm in a quiescent guinea-pig myocyte, because a low [Na+]i increases the driving force of the Na+-Ca2+ exchanger for Ca2+ removal. Hovever, calibrating with a Kd of 1000 nm instead of 500 nm would not change the Ca2+ concentrations appreciably (they would increase by factor of ∼1.2) whereas assuming a resting [Ca2+] of 50 nm would improve our detection limit by a factor of ∼2.4 (data not shown).
Figure 6. Estimation of the detection limit and relationship to a calculated permeability ratio.
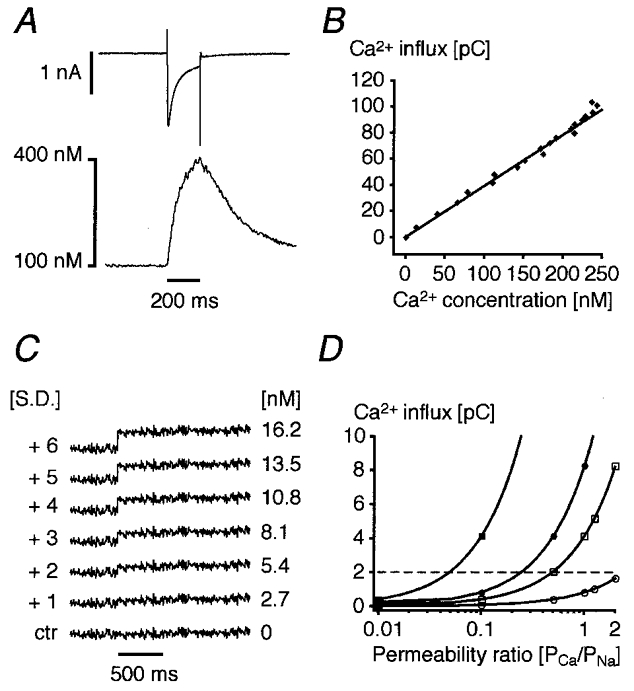
A, in a cell with blocked SR CICR an L-type Ca2+ current and the resulting Ca2+ influx signal were recorded simultaneously under control conditions. B, the Cd2+-sensitive difference current was integrated and plotted against the rising phase of the Ca2+ signal. The fitted line relates the observed Ca2+ influx fluorescence amplitude to the corresponding Ca2+ current in this given cell and corresponds to a cytosolic buffer capacity of about 28 (note that the SR was blocked). C, an mean Ca2+ concentration profile was plotted from a line-scan image and the standard deviation of the noise was calculated. After 500 ms, a step increase in Ca2+ was simulated by adding a concentration jump corresponding to a multiple of the s.d. The first step that is clearly visible coincides with +3 s.d. and, for this particular cell, corresponds to a concentration change of ∼8 nm[Ca2+]i. Taking the relationship illustrated in B we can estimate our mean detection limit for Ca2+ influx to be around 2 pC (dashed horizontal line in D). D, using the Goldmann-Hodgkin-Katz equation, the permeability ratio PCa/PNa was calculated for a 50 nA (□, ▪) or 10 nA Na+ current (○, •) and for 10 mm (•, ▪) or 1 mm[Ca2+]o (○, □), respectively.
Finally, we could relate the observed Ca2+ concentration change to Ca2+ influx using the relationship between the measured and numerically integrated Ca2+ current (Cd2+-sensitive difference) and the corresponding Ca2+ influx fluorescence signal (Fig. 6A). The linear relationship obtained by plotting the integral of the Ca2+ current versus the Ca2+ concentration allowed us to determine the minimal Ca2+ influx needed to produce a detectable Ca2+ signal, which on average was ∼2 pC (Fig. 6B). Based on this amount of charge it is possible to calculate the maximal permeability of the Na+ channel to Ca2+ which would be consistent with our data. The Goldmann-Hodgkin-Katz current equation (Hille, 1992) of the form:
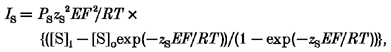 |
was used to calculate the absolute permeability for Na+ at the ionic concentrations, membrane potential and measured current obtained under our experimental conditions. We introduced the ionic concentrations for Na+ ([S]i = 1 mm, [S]o = 140 mm), the charge (zS =+1), and the driving force (E = Em–ES =−164 mV for these Na+ concentrations) and calculated the absolute permeability PS for assumed current amplitudes. F stands for the Faraday constant, R for the universal gas constant and T for the absolute temperature. The index ‘S’ refers to the ionic species in question. By introducing assumed values for the absolute permeability of Ca2+ (PS) into the same equation and taking the variables [S]i, [S]o, zS and E for Ca2+ we derived a fractional current amplitude (IS) carried by Ca2+ ions.
This current was numerically integrated to obtain a theoretical Ca2+ influx. The Ca2+ permeability was expressed as permeability ratio, PCa/PNa, and plotted against the expected Ca2+ influx (Fig. 6D). The horizontal dashed line separates the detectable Ca2+ influx signals (above) from the undetectable signals (below). It represents the mean detection limit calculated from the mean noise (1.78 nm) using a Kd of 500 nm and a resting [Ca2+] of 100 nm. Whole-cell patch-clamp Na+ current measurements usually underestimate the real current amplitude because of the access resistance. For large Na+ currents (50 nA: Brown et al. 1981; Makielski et al. 1987) and high extracellular Ca2+ (10 mm) we should detect signals elicited by single Na+ currents corresponding to a permeability ratio of about 0.04:1. Furthermore, the detection for Ca2+ influx during trains consisting of 50 or 100 Na+ currents would be considerably more sensitive. Using the same noise analysis procedure we estimated that we could detect a slow elevation of Ca2+ concentration during a current train if the deviation from a control trace at the end of the train corresponded to ∼8 nm (or 3 s.d. of the noise). Therefore, the detection limit in a train would correspond to about 0.16 nm per single Na+ current or to a Ca2+/Na+ permeability ratio of 0.0012: 1.
DISCUSSION
The Ca2+ influx signals mainly result from activation of L-type Ca2+ channels
During voltage-clamp protocols designed to activate L-type Ca2+ currents our experimental results confirmed the expected changes in Ca2+ influx after β-adrenergic stimulation. Activation of β-receptors is known to induce a signalling cascade which ultimately leads to phosphorylation of various Ca2+ signalling proteins and membrane channels by protein kinase A (PKA), including the L-type Ca2+ channels (Kameyama et al. 1985). After PKA phosphorylation, L-type Ca2+ channels exhibit a higher open probability (Tsien et al. 1986). In contrast, the mechanism underlying the increase in the Ca2+ influx signals during voltage-clamp protocols tailored to specifically activate Na+ currents was less clear. Before reaching a conclusion, several experimental difficulties and possible pitfalls need to be considered. It is well known that Na+ currents have very large amplitudes in cardiac myocytes (Brown et al. 1981; Makielski et al. 1987). Consequently, it is notoriously difficult, if not impossible, to control the clamp voltage during the activation of the current with conventional amplifiers and patch-clamp recording pipettes (Makielski et al. 1987; Hüser et al. 1996). As a consequence, during INa activation the membrane potential briefly escapes away from the imposed clamp potential towards the Na+ reversal potential and hence towards the voltage range for the activation of L-type Ca2+ currents. In principle, L-type Ca2+ channels could be activated and carry Ca2+ influx during such voltage escape. Since the L-type Ca2+ channels are phosphorylated by cAMP-dependent protein kinase after β-stimulation, the Ca2+ influx signal generated during voltage escape may become larger after the application of isoproterenol. In addition, it has to be considered that isoproterenol not only increases the amplitude of ICa but also shifts its activation threshold towards more negative potentials (Katsube et al. 1996). This may lead to the activation of some L-type Ca2+ channels during the INa protocol (at −40 mV) after β-stimulation. The proposed voltage-activated Ca2+ release mechanism has also been reported to be facilitated by β-stimulation (Hobai et al. 1997b; Ferrier et al. 1998). However, in the present study any Ca2+ release from the SR was eliminated by ryanodine and thapsigargin and a contribution by SR Ca2+ release can thus be excluded. Other Ca2+ entry pathways which may possibly be involved are discussed below.
Considering all these pitfalls and after analysing the voltage sensitivity and the pharmacological profile of the Ca2+ influx signal observed in this study, we reached the conclusion that the major fraction of these Ca2+ influx signals was indeed generated by spurious activation of L-type Ca2+ channels during escape of the membrane potential from voltage clamp. β-Stimulation of these channels then led to a more pronounced manifestation of this effect, presumably by increasing the open probability and by shifting the activation of the L-type Ca2+ channels. Several lines of evidence suggested this conclusion. First, the analysis of the current traces (INa) revealed an apparent slowing of inactivation after exposure to isoproterenol. In some cases a distinct shoulder appeared during the late phase of the inactivation, indicating that another current had been activated (Fig. 3C). Interestingly, this shoulder, as well as the Ca2+ influx signal, turned out to be Cd2+ sensitive. Second, the sensitivity of the Ca2+ influx signal to 5 mm Ni2+ also suggested the participation of either the L- or T-type Ca2+ current (or both). However, the small or absent effect of low concentrations of Ni2+ (50–100 μm) indicates that T-type Ca2+ channels contribute very little, if at all, since they are known to exhibit a much higher Ni2+ sensitivity (Sipido et al. 1998; but see also Lee et al. 1999). In this case, the relatively small effect of low Ni2+ concentrations on the influx of Ca2+ could be explained by the known overlap of the dose-response curves for T- and L-type Ca2+ channels (i.e. even low Ni2+ concentrations have a minor blocking effect on L-type Ca2+ current). The almost complete block by 50 μm Cd2+, which is an indicator of the involvement of the L-type Ca2+ current (Hobai et al. 1997a), provides strong support for the view that most of the Ca2+ influx during the INa protocol was carried by L-type Ca2+ channels. As mentioned above, the depolarisation to −40 mV during the INa activation protocol could activate a small fraction of the L-type Ca2+ channels, particularly following the leftward shift in activation after β-stimulation. However, the disappearance of the Ca2+ influx signal upon administration of 20 μm TTX clearly suggests that the depolarization to −40 mV did not per se induce any detectable Ca2+ influx, not even after β-stimulation. This result can be explained if block of INa with TTX prevents voltage escape. The following experimental observation provides further support for this view. When the series resistance compensation of the voltage-clamp amplifier was impaired on purpose, the Ca2+ influx signals during INa activation clearly increased in amplitude (not shown). Thus, precise control of the membrane potential seems to prevent the activation of ICa.
Involvement of T-type Ca2+ channels
We expected that the INa activation protocol (depolarization from −90 mV to −40 mV) would also activate T-type Ca2+ currents which could have led to a noticeable Ca2+ influx. However, the weak sensitivity of the Ca2+ signal to 50 μm Ni2+, a concentration which was shown to be discriminative for cardiac T-type Ca2+ channels (Sipido et al. 1998; Lee et al. 1999), suggests that this pathway only contributed a small fraction of the detectable Ca2+ influx. It is also worth mentioning that the T-type Ca2+ current has been reported to be insensitive to β-stimulation in the guinea-pig heart (Tytgat et al. 1988; Balke et al. 1993; but see Vassort & Alvarez, 1994). Based on these findings and on the Cd2+ sensitivity discussed above, we believe that a significant participation of the T-type Ca2+ channels in the generation of a Ca2+ influx signal sensitive to β-stimulation is unlikely.
Contribution of the Na+-Ca2+ exchanger to the Ca2+ influx signal
In the present study, we were concerned with Ca2+ influx via voltage-dependent membrane channels and therefore tried to minimize the reverse mode Na+-Ca2+ exchange by omitting Na+ from the intracellular solution. It is clear, however, that this procedure cannot completely prevent some accumulation of Na+ close to the membrane during INa activation, which in turn could elicit a small Ca2+ influx via Na+-Ca2+ exchange (Lederer et al. 1990; Lipp & Niggli, 1994; Niggli & Lipp, 1996). In our experiments, this pathway would also be blocked by 5 mm Ni2+. Therefore this pathway is indistinguishable from spurious activation of ICa based on this observation alone. However, it has to be pointed out that the Ca2+ influx signal observed in the absence of Na+ in the pipette filling solution was suppressed by the administration of 50 μm Cd2+ or the L-type Ca2+ channel blocker nifedipine (10 μm; not shown). Cd2+ is known to block the Na+-Ca2+ exchange only at much higher concentrations (IC50 320 μm; Hobai et al. 1997a). Taken together, these findings strongly suggest that Ca2+ influx via the Na+-Ca2+ exchanger only played a small role when Na+ was omitted from the patch pipette solution.
Other sources for Ca2+ influx
Potential additional pathways for Ca2+ influx via Na+ channels have been reported recently in guinea-pig (Cole et al. 1997) and rat ventricular myocytes (Aggarwal et al. 1997). These voltage-activated currents were blocked by TTX and were insensitive to 50 μm Ni2+. However, no evidence was provided that Ca2+ influx really occurred, nor that Ca2+ release could be triggered. Moreover, the current presumably carried by Ca2+ ions in these experiments was only observed when Na+ was completely absent from the extracellular solution because blocked the current at micromolar concentrations. Since we used physiological Na+ concentrations in all experiments, the participation of these currents in generating a Ca2+ influx can be excluded.
The possibility of Ca2+ permeation through TTX-sensitive Na+ channels, even with physiological extracellular Na+ concentrations, was discussed several years ago (Sorbera & Morad, 1990; Johnson & Lemieux, 1991; Hume et al. 1991; Lederer et al. 1990). Recently, experimental support for this controversial pathway has been reported by Santana et al. (1998). They observed SR Ca2+ release triggered by Ca2+ apparently entering through TTX-sensitive Na+ channels, but only after β-adrenergic stimulation. In addition, the permeability ratio PCa/PNa was shifted from almost 0: 1 to 1.25: 1. This newly described peculiarity of the Na+ channels was termed ‘slip-mode Ca2+ conductance’. A salient feature of this proposed mode of conductance is the insensitivity of the Ca2+ release to 5 mm Ni2+.
Since this TTX-sensitive β-stimulation-dependent Ca2+ influx signal had several characteristics resembling the Ca2+ influx signals observed in the present study, we also tried to detect Ca2+ influx via slip-mode conductance, taking advantage of the insensitivity of the influx to 5 mm Ni2+. This allowed us to supress all other known Ca2+ entry pathways with a single unspecific blocker. During such experiments, we anticipated that the Ca2+ fluorescence signal would be small since we had suppressed any amplification by CICR. The estimate of the detection limit of our confocal fluorescence measurement suggested that we should be able to detect Ca2+ influx through slip-mode conductance during a single INa as soon as the Ca2+/Na+ permeability ratio exceeded 0.04: 1. This estimate of the detection limit is very conservative because the real Na+ current is presumably larger than the measured current. Indeed, experiments carried out with low access resistance electrode systems had suggested peak currents of up to 140 nA in rat ventricular myocytes (Brown et al. 1981; Makielski et al. 1987). For trains of 100 INa activations, which rapidly accumulate the Ca2+ influx, the detection would be correspondingly more sensitive.
In conclusion, we believe that when Ca2+ entry via Na+-Ca2+ exchange is minimized, and in the absence of blockers for L-type Ca2+ channels, escape of the voltage clamp, leading to spurious activation of L-type Ca2+ channels, is the most important pathway for Ca2+ influx during INa activation protocols. Ca2+ entry via the slip-mode conductance of the Na+ channels did not participate in the generation of measureable Ca2+ influx under our experimental conditions. In principle, a much smaller Ca2+ influx than ∼8 nm into the diadic space could still be sufficient to trigger Ca2+ release from the SR, but such a small slip-mode conductance would then not be consistent with the Ca2+/Na+ permeability ratio determined from shifts of the reversal potential (Santana et al. 1998).
Acknowledgments
This work was supported by the Swiss National Science Foundation (grant no. 31-50564.97 to EN). We thank Dr S. Thomas for comments and correction of the manuscript and D. Lüthi for technical assistance.
References
- Aggarwal R, Shorofsky SR, Goldman L, Balke CW. Tetrodotoxin-blockable calcium currents in rat ventricular myocytes; a third type of cardiac cell sodium current. The Journal of Physiology. 1997;505:353–369. doi: 10.1111/j.1469-7793.1997.353bb.x. [DOI] [PMC free article] [PubMed] [Google Scholar]
- Balke CW, Rose WC, O'Rourke B, Mejia-Alvarez R, Backx P, Marban E. Biophysics and physiology of cardiac calcium channels. Circulation. 1993;87:VII-49–VII-53. [Google Scholar]
- Bassani JWM, Yuan WL, Bers DM. Fractional SR Ca release is regulated by trigger Ca and SR Ca content in cardiac myocytes. American Journal of Physiology. 1995;37:C1313–1319. doi: 10.1152/ajpcell.1995.268.5.C1313. [DOI] [PubMed] [Google Scholar]
- Bers DM. Excitation-Contraction Coupling and Cardiac Contractile force. Boston, London: Kluwer Academic, Dortrecht; 1991. [Google Scholar]
- Boyett MR, Harrison SM, Janvier NC, McMorn SO, Owen JM, Shui Z. A list of vertebrate cardiac ionic currents: nomenclature, properties, function and cloned equivalents. Cardiovascular Research. 1996;32:455–481. [PubMed] [Google Scholar]
- Brown AM, Lee KS, Powell T. Sodium current in single rat heart muscle cells. The Journal of Physiology. 1981;318:479–500. doi: 10.1113/jphysiol.1981.sp013879. [DOI] [PMC free article] [PubMed] [Google Scholar]
- Calaghan SC, White E, Colyer J. Co-ordinated changes in cAMP, phosphorylated phospholamban, Ca2+ and contraction following β-adrenergic stimulation of rat heart. Pflügers Archiv. 1998;436:948–956. doi: 10.1007/s004240050728. [DOI] [PubMed] [Google Scholar]
- Cheng H, Lederer WJ, Cannell MB. Calcium sparks: elementary events underlying excitation-contraction coupling in heart muscle. Science. 1993;262:740–744. doi: 10.1126/science.8235594. [DOI] [PubMed] [Google Scholar]
- Cole CC, Chartier D, Martin M, Leblanc N. Ca2+ permeation through Na+ channels in guinea pig ventricular myocytes. American Journal of Physiology. 1997;273:H128–137. doi: 10.1152/ajpheart.1997.273.1.H128. [DOI] [PubMed] [Google Scholar]
- Cruz J, Dos S, Santana LF, Frederick CA, Isom LL, Malhorta JD, Mattei LN, Kass RS, An RH, Lederer WJ. Whether ‘slip mode conductance’ occurs? (Technical comment) Science. 1999;284:711a. [Google Scholar]
- DelPrincipe F, Egger M, Niggli E. Pathways for Ca2+ entry in cardiac myocytes. Biophysical Journal. 1999;76:A462. (abstract) [Google Scholar]
- Fabiato A. Time and calcium dependence of activation and inactivation of calcium-induced release of calcium from the sarcoplasmic reticulum of a skinned canine cardiac Purkinje cell. Journal of General Physiology. 1985;85:247–289. doi: 10.1085/jgp.85.2.247. [DOI] [PMC free article] [PubMed] [Google Scholar]
- Ferrier GR, Zhu J, Redondo IM, Howlett SE. Role of cAMP-dependent protein kinase A in activation of a voltage-sensitive release mechanism for cardiac contraction in guinea-pig myocytes. The Journal of Physiology. 1998;513:185–201. doi: 10.1111/j.1469-7793.1998.185by.x. [DOI] [PMC free article] [PubMed] [Google Scholar]
- Györke I, Györke S. Regulation of the cardiac ryanodine receptor channel by luminal Ca2+ involves luminal Ca2+ sensing sites. Biophysical Journal. 1998;75:2801–2810. doi: 10.1016/S0006-3495(98)77723-9. [DOI] [PMC free article] [PubMed] [Google Scholar]
- Han S, Schiefer A, Isenberg G. Ca2+ load of guinea-pig ventricular myocytes determines efficacy of brief Ca2+ currents as trigger for Ca2+ release. The Journal of Physiology. 1994;480:411–421. doi: 10.1113/jphysiol.1994.sp020371. [DOI] [PMC free article] [PubMed] [Google Scholar]
- Harkins AB, Kurebayashi N, Baylor SM. Resting myoplasmic free calcium in frog skeletal muscle fibers estimated with fluo-3. Biophysical Journal. 1993;65:865–881. doi: 10.1016/S0006-3495(93)81112-3. [DOI] [PMC free article] [PubMed] [Google Scholar]
- Hille B. Ionic Channels of Excitable Membranes. 2. Sunderland, MA, USA: Sinauer Associates; 1992. [Google Scholar]
- Hobai IA, Bates JA, Howarth FC, Levi AJ. Inhibition by external Cd2+ of Na/Ca exchange and L-type Ca2+ channel in rabbit ventricular myocytes. American Journal of Physiology. 1997a;272:H2164–2172. doi: 10.1152/ajpheart.1997.272.5.H2164. [DOI] [PubMed] [Google Scholar]
- Hobai IA, Hancox JC, Levi AJ. Inhibition of the L-type Ca2+ channel by external nickel in guinea-pig ventricular myocytes dialysed with cAMP-free and cAMP-containing solutions. The Journal of Physiology. 1998;511.P:80P. (abstract) [Google Scholar]
- Hobai IA, Howarth FC, Pabbathi VK, Dalton GR, Hancox JC, Zhu JQ, Howlett SE, Ferrier GR, Levi AJ. Voltage-activated Ca release’ in rabbit, rat and guinea-pig cardiac myocytes, and modulation by internal cAMP. Pflügers Archiv. 1997b;435:164–173. doi: 10.1007/s004240050496. [DOI] [PubMed] [Google Scholar]
- Hume JR, Levesque PC, Leblanc N. Sodium-calcium exchange. Science. 1991;251:1370–1371. [Google Scholar]
- Hüser J, Lipp P, Niggli E. Confocal microscopic detection of potential-sensitive dyes used to reveal loss of voltage control during patch-clamp experiments. Pflügers Archiv. 1996;433:194–199. doi: 10.1007/s004240050267. [DOI] [PubMed] [Google Scholar]
- Johnson EA, Lemieux RD. Sodium-calcium exchange. Science. 1991;251:1370–1371. [PubMed] [Google Scholar]
- Kameyama M, Hofmann F, Trautwein W. On the mechanism of beta-adrenergic regulation of the Ca2+ channel in the guinea-pig heart. Pflügers Archiv. 1985;405:285–293. doi: 10.1007/BF00582573. [DOI] [PubMed] [Google Scholar]
- Katsube Y, Yokoshuki H, Nguyen L, Sperelakis N. Differences in isoproterenol stimulation of Ca2+ current of rat ventricular myocytes in neonatal compared to adult. European Journal of Pharmacology. 1996;317:391–400. doi: 10.1016/s0014-2999(96)00745-5. [DOI] [PubMed] [Google Scholar]
- Leblanc N, Hume JR. Sodium current-induced release of calcium from cardiac sarcoplasmic reticulum. Science. 1990;248:372–376. doi: 10.1126/science.2158146. [DOI] [PubMed] [Google Scholar]
- Lederer WJ, Niggli E, Hadley RW. Sodium-calcium exchange in excitable cells: fuzzy space. Science. 1990;248:283. doi: 10.1126/science.2326638. [DOI] [PubMed] [Google Scholar]
- Lee J-H, Gomora JC, Cribbs LL, Perez-Reyes E. Nickel block of three cloned T-type calcium channels: low concentrations selectively block α1H. Biophysical Journal. 1999;77:3034–3042. doi: 10.1016/S0006-3495(99)77134-1. [DOI] [PMC free article] [PubMed] [Google Scholar]
- Levi AJ, Spitzer KW, Kohmoto O, Bridge JH. Depolarization-induced Ca2+ entry via Na+-Ca2+ exchange triggers SR release in guinea pig cardiac myocytes. American Journal of Physiology. 1994;266:H1422–1433. doi: 10.1152/ajpheart.1994.266.4.H1422. [DOI] [PubMed] [Google Scholar]
- Lipp P, Niggli E. Sodium current-induced calcium signals in isolated guinea-pig ventricular myocytes. The Journal of Physiology. 1994;474:439–446. doi: 10.1113/jphysiol.1994.sp020035. [DOI] [PMC free article] [PubMed] [Google Scholar]
- McDonald TF, Pelzer S, Trautwein W, Pelzer DJ. Regulation and modulation of calcium channels in cardiac, skeletal and smooth muscle cells. Physiological Reviews. 1994;74:365–507. doi: 10.1152/physrev.1994.74.2.365. [DOI] [PubMed] [Google Scholar]
- McLaughlin S. The electrostatic properties of membranes. Annual Review of Biophysics and Biophysical Chemistry. 1989;18:113–137. doi: 10.1146/annurev.bb.18.060189.000553. [DOI] [PubMed] [Google Scholar]
- Makielski JC, Sheets MF, Hanck DA, January CT, Fozzard HA. Sodium current in voltage clamped internally perfused canine cardiac Purkinje cells. Biophysical Journal. 1987;52:1–11. doi: 10.1016/S0006-3495(87)83182-X. [DOI] [PMC free article] [PubMed] [Google Scholar]
- Niggli E, Lipp P. Elementary events of INa- and ICa-triggered EC coupling. Biophysical Journal. 1996;70:A275. (abstract) [Google Scholar]
- Reuter H. Calcium channel modulation by neurotransmitters, enzymes and drugs. Nature. 1983;301:569–574. doi: 10.1038/301569a0. [DOI] [PubMed] [Google Scholar]
- Rios E, Pizarro G, Stefani E. Charge movement and the nature of signal transduction in skeletal muscle excitation-contraction coupling. Annual Review of Physiology. 1992;54:109–133. doi: 10.1146/annurev.ph.54.030192.000545. [DOI] [PubMed] [Google Scholar]
- Santana LF, Gomez AM, Lederer WJ. Ca2+ flux through promiscuous cardiac Na+ channels: slip-mode conductance. Science. 1998;279:1027–1033. doi: 10.1126/science.279.5353.1027. [DOI] [PubMed] [Google Scholar]
- Schneider MF, Chandler WK. Voltage dependent charge movement of skeletal muscle: a possible step in excitation-contraction coupling. Nature. 1973;242:244–246. doi: 10.1038/242244a0. [DOI] [PubMed] [Google Scholar]
- Sipido KR, Carmeliet E, Van de Werf F. T-type Ca2+ current as a trigger for Ca2+ release from the sarcoplasmic reticulum in guinea-pig ventricular myocytes. The Journal of Physiology. 1998;508:439–451. doi: 10.1111/j.1469-7793.1998.439bq.x. [DOI] [PMC free article] [PubMed] [Google Scholar]
- Sorbera LA, Morad M. Atrionatiuretic peptide transforms cardiac sodium channels into calcium-conducting channels. Science. 1990;247:969–973. doi: 10.1126/science.2154853. [DOI] [PubMed] [Google Scholar]
- Spencer CI, Berlin JR. Control of sarcoplasmic reticulum calcium release during calcium loading in isolated rat ventricular myocytes. The Journal of Physiology. 1995;488:267–279. doi: 10.1113/jphysiol.1995.sp020965. [DOI] [PMC free article] [PubMed] [Google Scholar]
- Trafford AW, Eisner DA. Another trigger for the heartbeat. The Journal of Physiology. 1998;513:1. doi: 10.1111/j.1469-7793.1998.001by.x. [DOI] [PMC free article] [PubMed] [Google Scholar]
- Tsien RW. Cyclic AMP and contractile activity in the heart. Advances in Cyclic Nucleotide Research. 1977;8:363–420. [PubMed] [Google Scholar]
- Tsien RW, Bean BP, Hess P, Lansman JB, Nilius B, Nowycky MC. Mechanisms of calcium channel modulation by beta-adrenergic agents and dihydropyridine calcium agonists. Journal of Molecular and Cellular Cardiology. 1986;18:691–710. doi: 10.1016/s0022-2828(86)80941-5. [DOI] [PubMed] [Google Scholar]
- Tsien RW, Weingart R. Inotropic effect of cyclic AMP in calf ventricular muscle studied by a cut end method. The Journal of Physiology. 1976;260:117–147. doi: 10.1113/jphysiol.1976.sp011507. [DOI] [PMC free article] [PubMed] [Google Scholar]
- Tytgat J, Nilius B, Vereecke J, Carmeliet E. The T-type Ca channel in guinea-pig ventricular myocytes is insensitive to isoprotenerol. Pflügers Archiv. 1988;411:704–706. doi: 10.1007/BF00580872. [DOI] [PubMed] [Google Scholar]
- Vassort G, Alvarez J. Cardiac T-type calcium current: Pharmacology and roles in cardiac tissue. Journal of Cardiovascular Pharmacology. 1994;5:376–393. doi: 10.1111/j.1540-8167.1994.tb01175.x. [DOI] [PubMed] [Google Scholar]
- Weidmann S. The effect of the cardiac membrane potential on the rapid availability of the sodium carrying system. The Journal of Physiology. 1955;127:213–224. doi: 10.1113/jphysiol.1955.sp005250. [DOI] [PMC free article] [PubMed] [Google Scholar]