

Abstract
Large (up to +400 %) transient (∼20 s) increases of blood flow were observed in the external iliac arteries of resting conscious dogs (n = 10) in the absence of major alerting or muscular activity. At the same time arterial pressure (AP) fellslightly while heart rate (HR) rose.
The vasodilatations were resistant to atropine, ganglionic, β-adrenergic and NO-synthase inhibition, but were suppressed by spinal or general anaesthesia.
Vasodilatations of similar appearance were elicited by an alerting sound; these were abolished by atropine.
The spontaneous vasodilatations occurred simultaneously and their magnitudes were well correlated between both legs, but were not correlated to the amount of concomitant activation of the surface electromyogram. The duration of this activation almost never outlasted 10 s.
The reactive hyperaemia observed after a total occlusion of the artery even for 16 s was not large enough to explain the size of the spontaneous vasodilatations. Occlusion during peak flow of the vasodilatations did not affect the size of the reactive hyperaemia.
Spectral analysis made separately for data segments with and without vasodilatation revealed that the vasodilatations substantially enhanced the variability of AP and HR at frequencies below ∼0.1 Hz.
In conclusion, large coordinated skeletal muscle vasodilatations were identified in resting conscious dogs, which are initiated neurally, but not by sympathetic-cholinergic or nitroxidergic fibres and which do not show any clear correlation to muscular contraction. The vasodilatations substantially affect the regulation of skeletal muscle blood flow and explain a significant portion of AP and HR variability.
Current concepts of the regulation of blood flow in skeletal muscle include not only sympathetic vasoconstriction, metabolic factors, myogenic response, and muscle vein pump but also neural vasodilator pathways (Shepherd, 1983; Lash, 1996). The latter are believed to be represented predominantly, if not exclusively, by sympathetic cholinergic nerves (Shepherd, 1983; Lash, 1996). Since these fibres are classically associated with the defence reaction (Uvnas, 1963; Hilton, 1982) or at least its alerting stage (Abrahams et al. 1964), their physiological role under undisturbed conditions remained questionable (Marshall, 1995).
With respect to this background, previous observations made in our laboratory (authors' previous unpublished observations) and those reported by other authors working on conscious dogs (Ludens et al. 1970; Caraffa-Braga et al. 1973) re-wakened our interest: we had seen large transient increases in hindlimb blood flow occurring in dogs apparently in the absence of alerting stimuli and major muscular activity. In addition, in previous studies on blood pressure variability (Just et al. 1995,1998a,b) we had observed that characteristic transient drops of arterial pressure (AP) occurred in resting dogs after ganglionic blockade. The duration and frequency of these hypotensive periods was so astonishingly similar to those of the vasodilatations, that this suggested to us that the changes in AP and the vasodilatations may both reflect the same phenomenon.
If this should be true, these observations raise two important implications. First, they suggest the existence of a vasodilator pathway, whether neural, humoral or metabolic, which is independent of the sympathetic cholinergic nerves. Second, if the changes in AP are indeed caused by the vasodilatations, they would provide a previously unrecognised source of resting variability of AP and possibly also of HR. Although the variabilities of both AP and HR are increasingly used as indicators of sympathovagal balance (Malliani et al. 1994; Mancia et al. 1998) and clinical prognosis (Malliani et al. 1994; Camm et al. 1996; Malik, 1998), our understanding of the underlying causes is still incomplete (Parati et al. 1995; Karemaker, 1997).
Therefore, we decided to study these hindlimb vasodilatations in more detail. For this purpose, experiments were designed to characterise the vasodilatations and their possible association to changes in HR and AP, to elucidate the mode of transmission, and to identify the frequency range of the effect on the variability of AP and HR.
METHODS
Sixty-six experiments were made on 10 conscious foxhounds (29–38 kg) in accordance with the national guidelines for the care and use of research animals (Reg. Präs. Karlsruhe license no. 37-9185.81/156/96). The dogs were held under an artificial light–dark cycle (6.00 h to 18.00 h light) and were fed a standard dog diet (SSNIFF Spezialdiäten GmbH, Soest, Germany) with free access to tap water.
Chronic instrumentation
The dogs were surgically prepared under sterile conditions. After premedication with atropine (0.5 mg s.c.; Braun, Melsungen, Germany) and propionylpromazine (0.5 mg kg−1s.c.; Combelen, Bayer, Leverkusen, Germany) anaesthesia was induced by sodium pentobarbitone (20 mg kg−1, Nembutal, Sanofi, Libourne Cedex, France) and maintained by halothane (0.8–1.0 %, Fluothane, Zeneca, Planckstadt, Germany) and N2O (0.5 l min−1). Depth of anaesthesia was checked by repeated testing of the eyelid reflex. At the induction, masseter relaxation was also assessed. Via a midline abdominal incision a polyurethane catheter was implanted into the abdominal aorta and an ultrasonic transit time flow probe (Transonic, Ithaca, NY, USA) was placed on the left external iliac artery. In four of the dogs a second flow probe was placed on the contralateral external iliac artery. In three of these dogs also an inflatable vascular occluder was implanted on the left artery distal to the flow probe. Catheter and cable(s) were brought through the abdominal wall subcostally on the left flank and were then subcutaneously led to the animal's neck, where they were exteriorised. At least 10 days were allowed for recovery before experiments were started. On the day of surgery and on days 3 and 6 thereafter, the dogs received a combination of benzylpenicilline and sulphatolamide (Tardomycel, Bayer, Leverkusen, Germany, 3 ml s.c.). The catheter was flushed every 2nd or 3rd day and filled with a solution of heparin (1700 i.u. ml−1).
Measurements
AP was measured with the aortic catheter by a pressure transducer connected to an amplifier (Statham P23XL with Gould Pressure Processor; Gould). Blood flow in the left or in both iliac arteries (IBF) was obtained by an external flowmeter (Transonic T401) connected to the flow probe(s). A surface electromyogram (EMG) was recorded via self-adhesive electrodes (Neuroline 7 10 05-K, Medicotest, Olstykke, Denmark) pasted to areas of shaved and depilated skin on the lateral aspect of both thighs. The signals were preamplified by custom designed high-resistance AC-coupled small (20 × 20 × 40 mm) headstages taped to the respective leg less than 10 cm apart from the electrodes, and were subsequently further amplified to a total of × 20000, rectified and integrated (τ = 0.1 s). All data were recorded continuously on a computer at 20 Hz for 2 or 4 h, while the dog was resting on its right side as trained before (for more detail see Just et al. 1995, 1998a). After all experiments had been completed the dogs received an overdose of sodium pentobarbitone (Nembutal, 60–100 mg kg−1i.v.)
Protocols
4 h recordings
For the general characterisation of the vasodilatations, data were recorded continuously for a period of 4 h.
4 h recordings with drug administration
The same recordings were also made after ganglionic blockade alone (hexamethonium bromide, Sigma-Aldrich, 5 mg kg−1 bolus i.v. followed by infusion of 5 mg kg−1 h−1i.v.) as well as in combination with atropine (atropine methyl nitrate, Sigma-Aldrich, 0.5 mg kg−1 bolus, followed by 0.25 mg kg−1 h−1 infusion i.v.). Hexamethonium was started 20 min and atropine 15 min before the recording, while in the control experiments a corresponding period of 20 min was given. The order in which the 4 h recordings with or without drugs were made in each dog was randomly assigned.
2 h recordings with drug administration
In order to delineate the transmission pathways of the vasodilatations further, additional recordings were made over 2 h. The first hour always served as control. Drugs were then given and the recording continued for another hour. Each drug was given in a separate experiment on a separate day. In addition, time-control experiments were made by continuous recordings for 2 h without any intervention. Effects of the drugs were compared with the second hour of these control experiments. The following drugs were used: hexamethonium bromide (Sigma-Aldrich), 5 mg kg−1 bolus i.v. followed by 5 mg kg−1 h−1 continuous infusion i.v.; atropine methyl nitrate (Sigma-Aldrich), 0.5 mg kg−1 bolus + 0.25 mg kg−1 h−1; dl-propranolol-HCl (Sigma-Aldrich), 0.5 mg kg−1 bolus i.v.; nitro-l-arginine methyl ester (l-NAME, Sigma-Aldrich), 50 mg kg−1 bolus i.v.
Spinal anaesthesia
Two days before the experiment an epidural catheter was inserted at L7/S1 and was advanced rostrally for about 5 cm under general anaesthesia (sodium pentobarbitone, Nembutal, 30 mg kg−1i.v.; Sanofi). In the experiment 13 ml of bupivacain (Carbostesin, Astra, Wedel, Germany) was injected into the catheter over 15 min. In three dogs, this was started after 1 h of control recording, while in the other three dogs it was begun after 1 h of control and 1 h of hexamethonium. In each case, only the 45 min following the final dose of bupivacain was taken for analysis.
General anaesthesia
For induction of general anaesthesia a single dose of sodium pentobarbitone (Nembutal, 30 mg kg−1i.v.; Sanofi) was given after the first hour of control recording.
After hexamethonium, atropine, propranolol, spinal and general anaesthesia, an additional day was given for recovery; after l-NAME a week was allowed. The experiment with l-NAME was performed last in five of the six dogs.
Alerting response
An alerting sound was produced by dropping one of two hinged plastic boards onto the other from a defined height. The exact timing of the stimulus was stored on the computer via a mechanical sensor on the boards. As the dogs rapidly habituated to the sound, the alerting response was evoked only at two instances during the first, and at two instances during the second hour and only in the time-control experiments and those with atropine.
Test for the involvement of vasoactive intestinal peptide (VIP)
An attempt was made in three dogs to investigate the involvement of VIP by using the VIP antagonist d-Phe2-VIP (Minkes et al. 1992; Sigma and Dr R. Frank, Zentrum für Molekulare Biologie, Heidelberg). After injection of this drug (1.5 mg) into the aortic catheter the magnitude of the vasodilatations was suppressed in the same manner as were the dilator responses to exogenous boli of VIP (0.3 μg i.a.; Alexis). However, d-Phe2-VIP elicited the same attenuation on the dilator responses to isoproterenol (0.1 μg i.a.; Sigma-Aldrich) or nitroglycerine (Nitrolingual, 0.05 mg i.a.; Pohl-Boskamp, Hohenlockstedt, Germany), indicating that the effect of this antagonist was rather unspecific. Another VIP antagonist, VIP(6–28) (Fishbein et al. 1994; 1.0 mg i.a.; Bachem, Heidelberg, Germany), did not exert any inhibitory effect on the dilator responses to exogenous VIP in our dogs.
Iliac artery occlusion
In order to investigate a possible contribution of metabolic vasodilatation, IBF and EMG were recorded simultaneously from both legs for a duration of 2–3 h. During the intervals between spontaneous vasodilatations the external iliac artery was occluded for durations of 1, 2, 4, 8 and 16 s. Each occlusion period was assessed at least three times, the order being randomly assigned. At least 100 s were allowed between the occlusions. In addition, it was attempted to occlude the artery as soon as the occurrence of a spontaneous vasodilatation could be anticipated from the increase in the IBF or the EMG signals. The occluding cuff was controlled by air from a 50 ml syringe with a long connecting tube, so that the operator could not be seen by the dog. The pressure in the occluder tube was measured by a transducer (Model BTE 4005G0, Sensor-Technics) and recorded with the other data at 20 Hz.
Data analysis
HR was determined off-line beat by beat from the pressure signal. For automatic detection of the vasodilatations, the 20 Hz blood flow data were digitally low-pass filtered (finite impulse response-type, order 100, cut-off 2 Hz), resampled at 4 Hz and again low-pass filtered (cut-off 0.1 Hz). A vasodilatation was detected to occur when IBF rose by more than 50 ml min−1 within 10 of these data points (2.5 s). For analysis in the time domain (Figs 1, 3 and 4 and Table 1), the original 20 Hz data of AP, HR and IBF were smoothed by sliding averages over 40 values (2 s) and resampled at 4 Hz. From these data, based on the detected time points, the maxima of IBF and EMG for each vasodilator event were determined and the respective time courses of all signals were ensemble averaged. The same averaging procedure was applied for the responses to auditory stimulation, but taking the time points from the recorded sensor signal as reference points. The same procedure was also applied to the responses to arterial occlusion, using the time points from the pressure signal of the occluder tube. For analysis in the frequency domain, the original 20 Hz data were low-pass filtered (finite impulse response, order 100, cut-off 3 Hz) before resampling at 4 Hz. Based on the time points at which a vasodilatation had been detected, data segments of 128 s duration (512 values, starting 120 values before the vasodilatation) were isolated. Corresponding segments were also derived from those periods in which no vasodilatation had been detected. Power density spectra were calculated by the Blackman-Tukey algorithm (Bendat & Piersol, 1986) from all segments and were averaged separately for those segments with and without vasodilatation.
Figure 1. Spontaneous vasodilatations in the hindlimb of conscious resting dogs.

A, original trace of mean blood flow in the left external iliac artery (MIBF) recorded for 4 h. B, averaged time course of MIBF determined from all vasodilatations observed during 4 h in each dog. Mean (continuous line) ± s.e.m. (dotted lines) of the averages from 10 dogs. Data were smoothed by sliding averages over 2 s at 4 Hz. C, mean averaged time course of mean arterial blood pressure (MAP) concurrent with the vasodilatation. D, mean averaged time course of heart rate (HR). E, frequency histogram of the magnitude of all episodes expressed by the maximum MIBF reached. Error bars denote s.e.m. from 10 dogs.
Figure 3. Vasodilator response of mean iliac blood flow (MIBF) to a sudden loud noise.

The sound was applied at time 0. Mean time course (continuous line) ± s.e.m. (dotted lines) from six dogs. A, control conditions, averaged from six responses in each dog. Note the close similarity to the time course of the spontaneous vasodilatations in Fig. 1B. B, after atropine, the vasodilator response was completely abolished.
Figure 4. Correlation between the vasodilatation and the concomitant surface electromyogram activity (EMG) in both legs.

A, correlation between the total amount of flowed blood integrated from MIBF in the left (∫MIBF left) and the right iliac artery (∫MIBF right) during each of all individual vasodilatations detected in the 4 h recordings of four dogs. B, correlation between the integrated values of EMG and MIBF in the left leg (∫EMG left and ∫MIBF left; a.u., arbitrary units). C, correlation between integrated EMG activity recorded from the left (∫EMG left) and the right thigh (∫EMG right).
Table 1.
Haemodynamic data during the 4 h recordings
| MAP (mmHg) | HR (beats min−1) | MIBF (ml min−1) | Number (n) | Max MIBF (ml min−1) | |
|---|---|---|---|---|---|
| Control | 96 ± 3 | 78 ± 5 | 197 ± 21 | 25 ± 6 | 475 ± 25 |
| Hexamethonium | 88 ± 3* | 119 ± 6* | 219 ± 25 | 11 ± 2* | 451 ± 35 |
| Hexamethonium + atropine | 86 ± 2* | 117 ± 4* | 206 ± 8 | 11 ± 4* | 451 ± 14 |
MAP: mean arterial pressure, HR: heart rate, MIBF: mean iliac blood flow over the entire recording period. Number: number of vasodilatations observed per hour. Max MIBF: average maximum MIBF of all vasodilatations. Means ±s.e.m. from 6 dogs.
P < 0.05vs. the control experiment.
Statistical significance was tested by one-way ANOVA followed by Student-Newman-Keuls test. A P value of 0.05 was considered significant. All values are expressed as means ± s.e.m.
RESULTS
Transient vasodilatations
Although the dogs were quietly resting during the 4 h recording periods, large transient increases in mean IBF (MIBF) were observed; an original trace from one of the dogs is shown in Fig. 1A. Occasionally, these vasodilatations were accompanied by signs of minor alerting (pricking of ears, looking around or sometimes raising the head) and small hindlimb movements. Large vasodilatations were sometimes observed in conjunction with spontaneous stretching or incidental deep inspirations. However, often the dilatations apparently occurred spontaneously with no obvious alerting, and only negligible muscular activity such as minute wrinkling of the paws. Furthermore, there was no apparent relation between the magnitude of the dilatation and the size of muscular activity. In each of the 10 dogs, an average of 110 ± 17 such vasodilatations were detected by the algorithm over 4 h (28 ± 4 h−1). The average time course of the dilatation is shown in Fig. 1B. Separate evaluation of all dilatations in each individual dog revealed that MIBF reached average peak values of 494 ± 18 ml min−1. In relation to the individual mean value of MIBF over the entire 4 h recording period (∼200 ml min−1), this corresponds to an increase of +157 ± 18 % (n = 10). The histogram (Fig. 1E) shows that the modal magnitude was 450 ml min−1, but larger peak values of MIBF reaching more than 1000 ml min−1 (+400 %) also occurred. The vasodilatations were associated with a slight drop of mean AP (MAP; Fig. 1C) and a considerable tachycardia (Fig. 1D), suggesting that a larger fall in blood pressure due to an active vasodilatation was prevented by a reflex tachycardia.
Origin of the vasodilatations
After hexamethonium alone or in combination with atropine the vasodilator events were significantly less frequently detected as compared with the control experiments of the same six dogs (Table 1). However, the average magnitude of the vasodilatations (Table 1), the frequency distribution histogram of the magnitudes (data not shown) as well as the mean time course of MIBF during the vasodilatations (Fig. 7D)were not different from the control experiments. This demonstrates that about half of all vasodilatations were not due to activation of sympathetic cholinergic nerves.
Figure 7. Spontaneous vasodilatations during control conditions and after ganglionic blockade.

A, original traces of mean arterial pressure (MAP) and mean iliac blood flow (MIBF) during control conditions. B, original traces after ganglionic blockade. C, averaged time courses of MAP, heart rate (HR) and MIBF from all vasodilatations during control conditions. Means ± s.e.m. from six dogs. Data were smoothed by low pass filter < 3 Hz to allow spectral analysis. D, averaged time courses in the same six dogs after ganglionic blockade.
To identify the transmission pathways, recordings were made for 2 h in the same six dogs, in which specific pharmacological interventions were started after the first hour. Within the first hour of all 2 h experiments 21 ± 4 vasodilator events were detected, reaching an average maximum of 475 ± 10 ml min−1 corresponding to a rise of +111 ± 11 %. These data were not significantly different from the corresponding observations obtained from the second hour during the time-control experiments (Table 2). After hexamethonium, as in the 4 h recordings, fewer vasodilatations were detected (Table 2), while the average maximum of MIBF remained nearly identical (Table 2). The same effect was observed after atropine as depicted in the original traces from the second hour of the experiments in Fig. 2B and as listed in Table 2. After β-adrenergic blockade by propranolol neither the number of the vasodilator events nor their average magnitude was altered (Table 2). Blockade of NO synthesis by l-NAME also failed to abolish the vasodilator episodes, although the number of events was reduced (Table 2). The average maximum was also diminished after l-NAME (Table 2), but since basal MIBF was ∼50 % smaller (Table 2), the magnitude in percentage of basal flow was actually larger (+193 ± 11 %, P < 0.05) than in the control experiments.
Table 2.
Haemodynamic data during the 2 h recordings
| MAP (mmHg) | HR (beats min−1) | MIBF (ml min−1) | Number (n) | Max MIBF (ml min−1) | |
|---|---|---|---|---|---|
| Control | 103 ± 9 | 72 ± 5 | 227 ± 15 | 28 ± 6 | 503 ± 20 |
| Hexamethonium | 103 ± 9 | 130 ± 6* | 270 ± 7 | 10 ± 3* | 525 ± 21 |
| Atropine | 113 ± 7 | 181 ± 4* | 276 ± 23* | 15 ± 4* | 500 ± 40 |
| Propranolol | 96 ± 7 | 72 ± 5 | 199 ± 15 | 26 ± 7 | 503 ± 20 |
| l-NAME | 115 ± 6 | 45 ± 2 | 111 ± 8* | 9 ± 2* | 321 ± 15* |
| Epidural anaesthesia | 95 ± 4 | 106 ± 11* | 215 ± 17 | —1 | —1 |
| General anaesthesia | 102 ± 7 | 109 ± 8* | 235 ± 19 | —2 | —2 |
Abbreviations as in Table 1. Means ±s.e.m. from 6 dogs.
P < 0.05 vs. control (the 2nd hour of the time control experiment).
After epidural anaesthesia a single dilatation each was observed by the algorithm in two dogs, shortly after the last dose had been given (see arrows in Fig. 2C).
After sodium pentobarbitone one event was automatically detected in one dog at the end of the recording when the anaesthesia waned (see arrow in Fig. 2D).
Figure 2. Original traces of mean iliac blood flow (MIBF) during control conditions, after atropine, spinal and general anaesthesia.
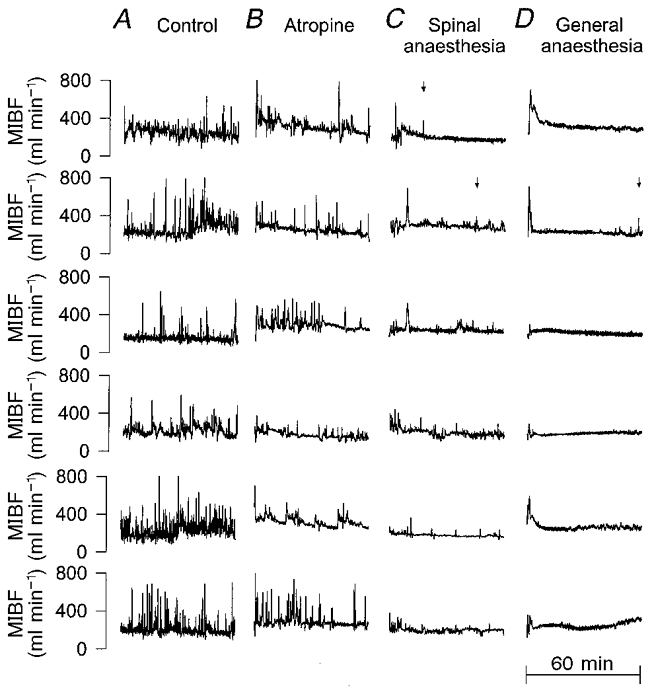
Original traces from the second hour of the 2 h recordings of all six dogs (2 s mean values). Each row of traces represents the data from the same individual; each column shows experiments of the same type. A, time-control experiment, in which no drug was given. B, atropine, given at the beginning of the trace. C, spinal anaesthesia. The anaesthetic was slowly injected over the first 15 min of the trace. After that time the vasodilatations were largely suppressed. The vasodilatations that remained were smaller and less steep than usual and were always associated with movements of the forelimbs and the upper trunk. The lower three traces were recorded after additional ganglionic blockade. D, general anaesthesia. Sodium pentobarbitone was injected during the first few minutes of the trace. This probably caused the initial vasodilatation. Subsequently, the vasodilatations were completely abolished, except for the reoccurrence in one dog towards the end of the trace, when the anaesthesia waned. Arrows mark the only instances in the traces of C and D, in which a vasodilatation was detected by the detection algorithm. In A and B detection is not indicated.
In order to investigate the involvement of any kind of nerves, the dogs were subjected to spinal anaesthesia. In three dogs, this was started after the first hour of control (the upper three traces in Fig. 2C). In the remaining three dogs the anaesthetic was injected after 1 h of control and 1 h with hexamethonium in order to exclude a contribution of the sympathetic cholinergic fibres (lower three traces of Fig. 2C). Note that the anaesthetic was injected slowly over a duration of approximately 15 min, so that the blockade is not expected to be complete during the first 15 min of the tracings shown in Fig. 2C. After this time, the vasodilatations were largely suppressed in both cases. Although some minor vasodilatations could still be observed, it should be noted that these were always associated with movements of the forelimbs and the upper trunk, and often were smaller and less steep than usual, so that only two of them were detected by our algorithm (one instance each in the two experiments shown in upper two traces of Fig. 2C and marked by an arrow, respectively). After general anaesthesia the vasodilatations were completely abolished (Fig. 2D), indicating the essential role of consciousness for these vasodilatations. Only in one dog were some minor vasodilatations observed at the end of the period when the anaesthetic depth waned (only one was detected by the algorithm, Table 2 and arrow in Fig. 2D). The initial dilator responses at the beginning of the traces were most probably caused by the bolus of sodium pentobarbitone, which was given during the first few minutes.
Response to arousal
In order to test the well-known cholinergic vasodilatation during an arousal response, the animals were aroused by a sudden loud noise. The dogs jerked, were alerted and sometimes raised their heads. The responses of MIBF, MAP and HR during the two control tests made during the first hour were not different from those during the second hour of the time-control experiments and also not from the two tests made in the first hour before atropine. The average time course of MIBF from these six control responses in each of the six dogs is depicted in Fig. 3A. While the time course of the MIBF response was very similar to that observed during the spontaneous vasodilatations (Fig. 1B), MAP increased during the arousal reaction and the tachycardia was more pronounced (data not shown). The cardiovascular response was thus closely similar to that observed by other authors (Caraffa-Braga et al. 1973; Timms, 1981; Marshall, 1995). Also, in accordance with previous reports, the arousal-induced vasodilatation was virtually abolished by atropine (Fig. 3B), while the alerting signs and jerking were not altered.
Contribution of skeletal muscle contraction
In order to elucidate a possible association of the vasodilator events with a contraction of the skeletal muscle, in four dogs EMGs were recorded from both legs together with the MIBF signals from the iliac arteries of both sides. It was observed that the vasodilatations occurred simultaneously in both legs. Moreover, the magnitude of the vasodilatation in all dilator events detected in the four dogs in terms of the total volume of blood flow integrated from MIBF between 2 s before and 20 s after detection of each event, was closely correlated on both sides (Fig. 4A, linear regression r = 0.92). The maximum of MIBF reached in each instance was also closely correlated on both sides (r = 0.87, data not shown). In contrast, there was no apparent correlation between the integrated values of EMG activity and MIBF during the vasodilatation, respectively (Fig. 4B, linear regression r = 0.21). Although most of the vasodilator events were indeed accompanied by brief (less than 10 s) activations of the EMG (Fig. 5A), in about 20 % of the cases no appreciable elevation of the EMG activity above the noise level could be detected, despite even large increases in MIBF. In addition, increases in the EMG activity were occasionally seen in a few single cases without any clear vasodilator response. The same observations were also made regarding the signals from the right side (data not shown). Also, in contrast to the close bilateral correlation of the vasodilator responses (Fig. 4A), the amount of EMG activation integrated during the dilator events was not correlated between the two legs (Fig. 4C, r = 0.42).
Figure 5. Comparison between spontaneous vasodilatation and reactive hyperaemia after artificial occlusion of the iliac artery.

A, mean iliac blood flow (MIBF, thick line) and integrated surface electromyogram activity (EMG, thin line) from a single vasodilatation. B, averaged response of MIBF to an occlusion of the iliac artery for a duration of 1, 2, 4, 8 or 16 s obtained in three dogs repeated at least three times in each dog. Numbers in the figure denote the duration of the occlusion. Data in A and B were smoothed by sliding averages over 2 s at 4 Hz.
Contribution of metabolic effects
In order to elucidate a possible contribution of secondary metabolic effects of muscular contraction to the observed vasodilatations, the reactive hyperaemia in response to a total occlusion of the iliac artery was investigated. One possibility of metabolic contribution would be that due to the increase in tissue pressure caused by muscle contractions arteriolar blood flow might be impeded, so that the observed vasodilator events may in fact result from a reactive hyperaemia. However, the dilator response to a complete occlusion of the iliac artery (Fig. 5B) was not large enough by far, to explain the spontaneous vasodilatations (Fig. 5A), even if the occlusion lasted as long as 16 s (Fig. 5B). From the frequency distribution (Fig. 1E) it can be calculated that the amount of vasodilatation observed after an occlusion of 8 s duration would explain at most 15 % of all vasodilator events. However, even this is likely to be an over-estimate for, in the vast majority of the cases, the duration of the EMG activation and thus the period of possible occlusion was as short as in the example shown in Fig. 5A and almost never outlasted 10 s. Furthermore, there was no evidence for a major impediment of MIBF prior to the vasodilatation (Figs 1B, 5A, 6 and 7C and D). In contrast, the rise of MIBF began almost at the same time as the activation of the EMG (Fig. 5A). The small delay of about 2 s between the responses of EMG and MIBF was a consistent finding in almost all vasodilatations and all dogs.
Figure 6. Reactive hyperaemia after occlusion of the left iliac artery at the time of spontaneous vasodilatation.

Time course of blood flow (MIBF) in the left (•) and in the right (○) iliac artery during single examples of spontaneous vasodilatation in three dogs. The left iliac artery was occluded as soon as a spontaneous vasodilatation could be anticipated. Data were smoothed by sliding averages over 2 s at 4 Hz.
Another possible explanation for the vasodilator events might be the release of vasoactive metabolites during the muscular contraction and their subsequent washout during the increase in flow. If this were true, the reactive hyperaemia should become accentuated when the artery is occluded at any time during the muscle vasodilatation. This was clearly not the case, as can be seen from the examples shown in Fig. 6.
Influence on cardiovascular variability
As described above (Fig. 1), in the normal animal with intact baroreceptor reflex function, the vasodilator events were always associated with considerable increases in HR (Figs 1D and 7C, middle panel), while MAP at the same time dropped slightly (Figs 1C and 7C, upper panel). In contrast, after ganglionic blockade in the same six dogs HR remained unchanged and MAP dropped considerably during the vasodilatations (Fig. 7D). However, the vasodilatations themselves were not affected in their magnitude and time course after hexamethonium (Fig. 7C and D, lower panels), although the number of occurrences was reduced (Tables 1 and 2). Blood pressure variability after ganglionic blockade was dominated by these falls in MAP (Fig. 7B). In contrast, under normal conditions blood pressure variability comprised an approximately equal amount of rises and falls of MAP (Fig. 7A).
In order to delineate the frequency range of the vasodilatations and their impact on the variability of blood pressure and heart rate, spectral analysis was performed from the data segments in which a vasodilatation had been detected and was compared to the spectra from the segments without these events. As can be seen from the spectra of MIBF under control conditions the vasodilatations raised the spectral content predominantly in the frequency range below ∼0.1 Hz by almost a factor of 10 (Fig. 8A and B, lower panels). In the absence of autonomic nervous influences, a smaller contribution is also seen at higher frequencies (Fig. 8B, lower panel). Under control conditions, this variability was reflected in enhanced fluctuations of MAP (Fig. 8A, upper panel) and HR (middle panel) in the frequency range below ∼0.1 Hz. After ganglionic blockade, the variability of AP was greatly reduced at the higher frequencies, but remained virtually unchanged below ∼0.05 Hz (Fig. 8B, upper panel). In contrast, the variability of HR was virtually abolished and was not affected any more by the vasodilator events (Fig. 8B, middle panel).
Figure 8. Spectral content with and without spontaneous vasodilatation.

A, power spectral density of mean arterial pressure (PSD-MAP), heart rate (PSD-HR) and mean iliac blood flow (PSD-MIBF) calculated from the data segments containing a spontaneous vasodilatation from Fig. 7C (thick line) as compared to spectra of those segments without vasodilatation (thin line). Means ± s.e.m. from six dogs. B, power density spectra from the same six dogs after ganglionic blockade.
DISCUSSION
In the present study we have identified large transient vasodilatations in skeletal muscle, which occur in conscious resting dogs in the absence of arousal stimulation or major muscular activity. Although the pathway of transmission could not be exactly defined, the transmission requires consciousness and is of neural nature but independent of the sympathetic cholinergic vasodilator nerves. Finally, these vasodilatations exert a major impact on the variability of AP and HR in the resting animal.
Transmission pathway
From the current concepts of vascular regulation in skeletal muscle (Shepherd, 1983; Lash, 1996), the most likely explanation for the observed vasodilatations would be an activation of the sympathetic cholinergic nerves. In fact, the responses to the alerting sound, which were susceptible to atropine, showed that these vasodilator fibres do exist in the dog and that they evoke a vasodilatation very similar to the spontaneous ones. Furthermore, the reduced number of vasodilatations after atropine or ganglionic blockade, suggests that indeed some of the spontaneous vasodilatations were of sympathetic cholinergic origin. This indicates that the sympathetic cholinergic nerves are in use physiologically even in the absence of major alerting stimuli and without a complete defence reaction.
However, the results also clearly demonstrate that a substantial number of the spontaneous vasodilatations are transmitted by a pathway that is independent of the sympathetic cholinergic fibres. Also this pathway does not involve β-adrenergic or nitroxidergic transmission. Nevertheless, it is of neural nature as demonstrated by the strong suppression after spinal anaesthesia. Therefore, the vasodilatations might be mediated by either an activation of the motor nerves or a separate neural pathway. The final transmission could be due to yet another transmitter or it could be a result of the activation of the skeletal muscle fibres.
A mediation through the motor nerves is a particularly attractive explanation, since a similar atropine resistant vasodilatation had been observed in response to electrical stimulation in the motor cortex of the cat (Hilton et al. 1979). The authors of that study had attributed the dilator response to the release of metabolic vasodilators secondary to even minor contractions of the skeletal muscle. This view is supported by the present observation, that most of the vasodilatations were indeed associated with concomitant activations of the EMG. Although about 20 % of the vasodilatations occurred in the absence of any measurable change in the EMG activity, it is quite conceivable that in these cases motor units were activated which were too far away from the recording site to be detected in the signal. However, the view of a mechanical or metabolic mediation of the vasodilatations is challenged by other results of the present study. First, even after occlusion of the entire vascular bed for periods longer than the duration of most activations of the EMG, the hyperaemia was by far not large enough to explain the size of the spontaneous vasodilatations. This renders a reactive hyperaemia resulting from an impairment of microvascular flow during contraction an unlikely explanation for the vasodilatations. Second, the reactive hyperaemia was not enhanced if the artery was occluded during peak flow of the spontaneous vasodilatations. Therefore, the vasodilatations cannot be due to a metabolite, which is slowly produced during muscular contraction such as lactate, CO2, or derivatives of ATP, and is washed out during the vasodilatation. This does not exclude a metabolite which is rapidly released during muscle activation but is also swiftly eliminated after initiation of the vasodilatation before or even independently of the increase in flow. A possible candidate for such a metabolite could be K+, which may act as a hyperpolarising and relaxing factor in arteries (Edwards et al. 1998). Nevertheless, this explanation can also be questioned, because of the complete absence of any correlation between the size of the vasodilatation and the amount of EMG activation. If such a mechanism should play a role in mediating the vasodilatations, it would need to be confined to only a small subset of motor units, which do not contribute to the signals obtained from the recording electrodes.
On the other hand, the occasional observation of elevations of the EMG activity in the absence of any clear vasodilatation suggests that the usually observed association of EMG elevation and vasodilatation may be due to a parallel activation rather than to a causal relationship. Indeed, the strong correlation between the size of the vasodilatations in both iliac arteries in view of the concomitant absence of any correlation between EMG and MIBF as well as between the EMGs on both sides seems to suggest that these vasodilatations may be mediated by a transmitter released directly from the motor or other nerves independently of the magnitude of muscular activation. A possible transmitter released from the motor nerves may be acetylcholine, as has been demonstrated in the retractor muscle of the hamster cheek pouch (Welsh & Segal, 1997). However, this explanation is not in accord with the failure to abolish the vasodilatations by atropine in the present study. Other possible transmitters co-released from the motor nerves or released from separate nerves include VIP and calcitonin gene related peptide (CGRP; Pernow, 1989). VIP is an attractive candidate, since it exerts strong vasodilator responses (Järhult et al. 1980; Uddman et al. 1981) and has been detected in the vasculature of skeletal muscle (Järhult et al. 1980; Uddman et al. 1981; Schulte Bockholt et al. 1993). Unfortunately, with the presently available antagonists we were unable to decide whether VIP is involved or not (see Methods).
AP and HR variability
The present study demonstrates the important contribution of the vasodilatations to the variability of HR and AP in the resting animal. This effect is most prominent in the frequency range below 0.1 Hz, corresponding to the lower frequencies of the low frequency range (LF-range) and to the very low frequency (VLF-range) (Camm et al. 1996). This variability, especially in the VLF-range seems to be of particular prognostic value for mortality after myocardial infarction (Bigger et al. 1993), but is to date only poorly understood (Parati et al. 1995; Camm et al. 1996; Karemaker, 1997). The strong association in the present data of HR changes with the vasodilatations and their abolition after ganglionic blockade strongly suggest that HR variability in this frequency range may derive from the baroreceptor reflex in response to the transient drop of total peripheral resistance induced by the vasodilatation. If this view is correct, a high coherence between AP and HR should be present, for this gives an estimate of the coupling between AP and HR and thus of the contribution of the baroreceptor reflex (Pagani et al. 1986). Although such coherence was found, in a recent study in humans, to be small in the frequency range below 0.03 Hz (Taylor et al. 1998), which may challenge our proposal, it should be noted that the coherence rose towards 0.03 Hz and had not been assessed at higher frequencies in that study. Therefore, some partition of HR variability between 0.03 and 0.1 Hz may derive from a baroreflex response to muscular vasodilatations. The spectral power of this variability may thus vary with the amount of vasodilatation as well as with the sensitivity of the baroreceptor reflex.
After ganglionic blockade the AP variability was characterised by drops of AP and was almost invariably associated with hindlimb vasodilatations, while under control conditions rises and falls of AP were equally distributed. The same predominance of increases in hindlimb blood flow under control conditions (Zhang et al. 1994; Janssen et al. 1995) and of depressor episodes after sympathectomy (Julien et al. 1993; Zhang et al. 1994) has been observed in conscious rats, indicating that these phenomena are not confined to the dog. It is also possible that the rapid depressor episodes observed during desynchronised sleep periods in baroreceptor denervated rats reflect the same type of vasodilatation (Junqueira & Krieger, 1976).
Perspectives
Large vasodilatations have been found to occur in the skeletal muscle of resting conscious dogs with almost negligible muscular activity. Whatever the nature of the underlying mechanism, it is in use under physiological conditions and provides a previously unrecognised source of AP and HR variability in the VLF-range. This also implies that the contribution of the central nervous system to AP variability is even more pronounced than had been estimated without taking this non-sympathetic vasodilator pathway into consideration (Just et al. 1995). Finally, the vasodilatations may provide the missing link in the understanding of the early vasodilator response during the first 10 s of exercise (Lash, 1996), which is known to be unaffected by sympathectomy (Donald et al. 1970) or autonomic blockade (Sheriff et al. 1993), but is not related to the metabolic demand (Sheriff et al. 1993). In this respect, the spontaneous vasodilatations may provide a state of readiness for a potential rapid onset of exercise.
Acknowledgments
We are grateful to I. Keller and L. Mahl for their excellent technical help. We thank Dr K. Becker, Institut für Versuchstierkunde, University of Heidelberg for instruction and help with the insertion of the epidural catheter. We thank Dr R. Frank, Zentrum für Molekulare Biologie Heidelberg (ZMBH) for the synthesis of d-Phe2-VIP. We thank staatl. gepr. Elektr. W.-D. Busse, Institut für Physiologie und Pathophysiologie, University of Heidelberg, for design and construction of the headstages for the recording of the EMG. We also thank PD Dr med. R. Wollny, Institut für Sport und Sportwissenschaft, University of Heidelberg for technical advice concerning EMG signals. This study was supported by the German Research Foundation (Graduiertenkolleg für Experimentelle Nieren- und Kreislaufforschung der Universität Heidelberg).
References
- Abrahams VC, Hilton SM, Zbrozyna AW. The role of active muscle vasodilatation in the alerting stage of the defence reaction. The Journal of Physiology. 1964;171:189–202. doi: 10.1113/jphysiol.1964.sp007371. [DOI] [PMC free article] [PubMed] [Google Scholar]
- Bendat JS, Piersol AG. Random Data: Analysis and Measurement Procedures. New York: Wiley; 1986. [Google Scholar]
- Bigger JTJ, Fleiss JL, Rolnitzky LM, Steinman RC. The ability of several short-term measures of RR variability to predict mortality after myocardial infarction. Circulation. 1993;88:927–934. doi: 10.1161/01.cir.88.3.927. [DOI] [PubMed] [Google Scholar]
- Camm AJ, Malik M, Bigger JT, Breithardt G, Cerutti S, Cohen RJ, Coumel P, Fallen EL, Kennedy HL, Kleiger RE, Lombardi F, Malliani A, Moss AJ, Rottman JN, Schmidt G, Schwartz PJ, Singer DH. Heart rate variability – standards of measurement, physiological interpretation, and clinical use (Task force of the European Society of Cardiology and the North American Society of Electrophysiology) Circulation. 1996;93:1043–1065. [PubMed] [Google Scholar]
- Caraffa-Braga E, Granata L, Pinotti O. Changes in blood flow distribution during acute emotional stress in dogs. Pflügers Archiv. 1973;339:203–316. doi: 10.1007/BF00587372. [DOI] [PubMed] [Google Scholar]
- Donald DE, Rowlands DJ, Ferguson DA. Similarity of blood flow in the normal and the sympathectomized dog hind limb during graded exercise. Circulation Research. 1970;26:185–199. doi: 10.1161/01.res.26.2.185. [DOI] [PubMed] [Google Scholar]
- Edwards G, Dora KA, Gardener MJ, Garland CJ, Weston AH. K+ is an endothelium-derived hyperpolarizing factor in rat arteries. Nature. 1998;396:269–272. doi: 10.1038/24388. [DOI] [PubMed] [Google Scholar]
- Fishbein VA, Coy DH, Hocart SJ, Jiang NY, Mrozinski JEJ, Mantey SA, Jensen RT. A chimeric VIP-PACAP analogue but not VIP pseudopeptides function as VIP receptor antagonists. Peptides. 1994;15:95–100. doi: 10.1016/0196-9781(94)90176-7. [DOI] [PubMed] [Google Scholar]
- Hilton SM. The defence-arousal system and its relevance for circulatory and respiratory control. Journal of Experimental Biology. 1982;100:159–174. doi: 10.1242/jeb.100.1.159. [DOI] [PubMed] [Google Scholar]
- Hilton SM, Spyer KM, Timms RJ. The origin of the hind limb vasodilatation evoked by stimulation of the motor cortex in the cat. The Journal of Physiology. 1979;287:545–557. doi: 10.1113/jphysiol.1979.sp012676. [DOI] [PMC free article] [PubMed] [Google Scholar]
- Janssen BJ, Oosting J, Slaaf DW, Persson PB, Struijker Boudier HA. Hemodynamic basis of oscillations in systemic arterial pressure in conscious rats. American Journal of Physiology. 1995;269:H62–71. doi: 10.1152/ajpheart.1995.269.1.H62. [DOI] [PubMed] [Google Scholar]
- Järhult J, Hellstrand P, Sundler F. Immunohistochemical localization and vascular effects of vasoactive intestinal polypeptide in skeletal muscle of the cat. Cell Tissue Research. 1980;207:55–64. doi: 10.1007/BF00239329. [DOI] [PubMed] [Google Scholar]
- Julien C, Zhang ZQ, Barres C. Role of vasoconstrictor tone in arterial pressure lability after chronic sympathectomy and sinoaortic denervation in rats. Journal of the Autonomic Nervous System. 1993;42:1–10. doi: 10.1016/0165-1838(93)90336-s. [DOI] [PubMed] [Google Scholar]
- Junqueira LFJ, Krieger EM. Blood pressure and sleep in the rat in normotension and neurogenic hypertension. The Journal of Physiology. 1976;259:725–735. doi: 10.1113/jphysiol.1976.sp011491. [DOI] [PMC free article] [PubMed] [Google Scholar]
- Just A, Kirchheim HR, Ehmke H. Buffering of blood pressure variability by the renin-angiotensin system in the conscious dog. The Journal of Physiology. 1998a;512:583–593. doi: 10.1111/j.1469-7793.1998.583be.x. [DOI] [PMC free article] [PubMed] [Google Scholar]
- Just A, Wagner CD, Ehmke H, Kirchheim HR, Persson PB. On the origin of low-frequency blood pressure variability in the conscious dog. The Journal of Physiology. 1995;489:215–223. doi: 10.1113/jphysiol.1995.sp021043. [DOI] [PMC free article] [PubMed] [Google Scholar]
- Just A, Wittmann U, Ehmke H, Kirchheim HR. Autoregulation of renal blood flow in the conscious dog and the contribution of the tubuloglomerular feedback. The Journal of Physiology. 1998b;506:275–290. doi: 10.1111/j.1469-7793.1998.275bx.x. [DOI] [PMC free article] [PubMed] [Google Scholar]
- Karemaker JM. Heart rate variability: why do spectral analysis? Heart. 1997;77:99–101. doi: 10.1136/hrt.77.2.99. [DOI] [PMC free article] [PubMed] [Google Scholar]
- Lash JM. Regulation of skeletal muscle blood flow during contractions. Proceedings of the Society for Experimental Biology and Medicine. 1996;211:218–235. doi: 10.3181/00379727-211-43965. [DOI] [PubMed] [Google Scholar]
- Ludens JH, Heitz DC, Brody MJ, Williamson HE. Differential effects of furosemide on renal and limb blood flows in the conscious dog. Journal of Pharmacology and Experimental Therapeutics. 1970;171:300–306. [PubMed] [Google Scholar]
- Malik M. Heart rate variability. Current Opinion in Cardiology. 1998;13:36–44. doi: 10.1097/00001573-199801000-00006. [DOI] [PubMed] [Google Scholar]
- Malliani A, Pagani M, Lombardi F. Physiology and clinical implications of variability of cardiovascular parameters with focus on heart rate and blood pressure. American Journal of Cardiology. 1994;73:C3–9. doi: 10.1016/0002-9149(94)90617-3. [DOI] [PubMed] [Google Scholar]
- Mancia G, Daffonchio A, di Rienzo M, Ferrari A U, Grassi G. Methods to quantify sympathetic cardiovascular influences. European Heart Journal. 1998;19(suppl. F):F7–13. [PubMed] [Google Scholar]
- Marshall JM. Cardiovascular changes associated with behavioral alerting. In: Jordan D, Marshall JM, editors. Cardiovascular Regulation. Cambridge: Portland Press; 1995. pp. 37–59. [Google Scholar]
- Minkes RK, McMahon TJ, Hood JS, Murphy WA, Coy DH, McNamara DB, Kadowitz PJ. Differential effects of PACAP and VIP on the pulmonary and hindquarters vascular beds of the cat. Journal of Applied Physiology. 1992;72:1212–1217. doi: 10.1152/jappl.1992.72.3.1212. [DOI] [PubMed] [Google Scholar]
- Pagani M, Lombardi F, Guzzetti S, Rimoldi O, Furlan R, Pizzinelli P, Sandrone G, Malfatto G, Dell'Orto S, Piccaluga E, Turiel M, Baselli G, Cerutti S, Malliani A. Power spectral analysis of heart rate and arterial pressure variabilities as a marker of sympatho-vagal interaction in man and conscious dog. Circulation Research. 1986;59:178–193. doi: 10.1161/01.res.59.2.178. [DOI] [PubMed] [Google Scholar]
- Parati G, Saul JP, di Rienzo M, Mancia G. Spectral analysis of blood pressure and heart rate variability in evaluating cardiovascular regulation: a critical appraisal. Hypertension. 1995;25:1267–1286. doi: 10.1161/01.hyp.25.6.1276. [DOI] [PubMed] [Google Scholar]
- Pernow J. Actions of constrictor (NPY and endothelin) and dilator (substance P, CGRP and VIP) peptides on pig splenic and human skeletal muscle arteries: involvement of the endothelium. British Journal of Pharmacology. 1989;97:983–989. doi: 10.1111/j.1476-5381.1989.tb12040.x. [DOI] [PMC free article] [PubMed] [Google Scholar]
- Schulte Bockholt A, Meier DA, Hopp K, Stadelmann A, Otterson MF, Telford GL, Koch TR. Gene expression and transcript size of the prepro-peptide VIP/PHM-27 in normal human tissue. Neuroscience Letters. 1993;164:101–104. doi: 10.1016/0304-3940(93)90867-k. [DOI] [PubMed] [Google Scholar]
- Shepherd JT. Circulation to skeletal muscle. In: Shephard JT, Abboud FM, Geiger SR, editors. Handbook of Physiology, section 2, The Cardiovascular System, Peripheral Circulation and Organ Blood Flow. part 1. III. Bethesda, MD, USA: American Physiological Society; 1983. pp. 319–370. [Google Scholar]
- Sheriff DD, Rowell LB, Scher AM. Is rapid rise in vascular conductance at onset of dynamic exercise due to muscle pump? American Journal of Physiology. 1993;265:H1227–1234. doi: 10.1152/ajpheart.1993.265.4.H1227. [DOI] [PubMed] [Google Scholar]
- Taylor JA, Carr DL, Myers CW, Eckberg DL. Mechanisms underlying very-low-frequency RR-interval oscillations in humans. Circulation. 1998;98:547–555. doi: 10.1161/01.cir.98.6.547. [DOI] [PubMed] [Google Scholar]
- Timms RJ. A study of amygdaloid defence reaction showing the value of Althesin in studies of the function of the forebrain in cats. Pflügers Archiv. 1981;391:49–56. doi: 10.1007/BF00580694. [DOI] [PubMed] [Google Scholar]
- Uddman R, Alumets J, Edvinsson L, Hakanson R, Sundler F. VIP nerve fibres around peripheral blood vessels. Acta Physiologica Scandinavica. 1981;112:65–70. doi: 10.1111/j.1748-1716.1981.tb06783.x. [DOI] [PubMed] [Google Scholar]
- Uvnas B. Sympathetic vasodilator system and blood flow. Physiological Reviews. 1963;43(suppl. 4):69–76. [PubMed] [Google Scholar]
- Welsh DG, Segal SS. Coactivation of resistance vessels and muscle fibers with acetylcholine release from motor nerves. American Journal of Physiology. 1997;273:H156–163. doi: 10.1152/ajpheart.1997.273.1.H156. [DOI] [PubMed] [Google Scholar]
- Zhang ZQ, Julien C, Gustin MP, Cerutti C, Barres C. Hemodynamic analysis of arterial pressure lability in sympathectomized rat. American Journal of Physiology. 1994;267:H48–56. doi: 10.1152/ajpheart.1994.267.1.H48. [DOI] [PubMed] [Google Scholar]