

Abstract
The single channel properties of P2X ATP receptors were investigated in outside-out patches from hippocampal granule cells in brain slices from 12-day-old rats. The results demonstrate that functional P2X ATP receptors are expressed in hippocampal granule cells and, combined with previously published information on the P2X subunits expressed in the hippocampus, suggest that the receptors may be heteromers of the P2X4 and P2X6 subunits or P2X1, P2X2, P2X4 and P2X6 subunits.
Two distinct types of P2X channel openings were observed. A flickery P2X receptor channel was observed in three patches with a mean chord conductance of 32 ± 6 pS, a mean open time of 1.0 ± 0.3 ms and a mean burst length of 11 ± 5 ms at a membrane potential of −60 mV. A large conductance P2X receptor was observed in 19 out of 98 patches with a mean conductance of 56 ± 1.8 pS, a linear current-voltage relationship between −80 and +60 mV with a reversal potential around 0 mV, a mean open time of 2.6 ± 0.2 ms and a mean burst length of 8.8 ± 1.8 ms at −60 mV. At an ATP concentration of 1 mm, these channels exhibited a low steady-state open probability (Popen, 0.07 ± 0.008; n = 15), little apparent desensitisation and were also activated by α,β-methylene ATP (α,β-meATP, 40 μm; Popen, 0.007 ± 0.0002; conductance, 57 ± 1.1 pS; n = 3). No decrease in the single channel conductance was observed on increasing the free extracellular calcium concentration from 0.3 to 0.85 mm.
Channel closed time distributions were fitted with five exponential components with time constants (and relative areas) of 90 μs (20%), 0.77 ms (32%), 10 ms (15%), 90 ms (18%) and 403 ms (15%) at 1 mm ATP. Of these, the first two components are suggested to represent gaps within single activations of the receptor based on the lack of agonist concentration dependence of these two shut time components between 1 μm and 1 mm ATP.
Suramin (40 μm) significantly increased the single channel conductance (19 ± 7%; n = 5) and produced a small decrease in Popen (39 ± 9%; n = 5) by decreasing mean open time, burst length and total open time per burst. These actions of suramin are not consistent with simple competitive antagonism.
Binding sites for ATP that are thought to correlate with P2X receptors are widely distributed throughout the CNS (Bo & Burnstock, 1994; Balcar et al. 1995) and many CNS neurons express the mRNA (Collo et al. 1996) and protein for one or more of the P2X receptor subunits (Vulchanova et al. 1996; Lêet al. 1998b). Neurons in the adult rat hippocampus have been shown to express mRNA encoding the P2X4 and P2X6 receptor subunits (Collo et al. 1996), and additionally, mRNA encoding the P2X1 and P2X2 subunits has been observed in neonatal rat hippocampus (Kidd et al. 1995). Subunit-specific antibodies against the P2X4 subunit have also confirmed the presence of this subunit in hippocampal neurons (Lêet al. 1998b). Electrophysiological studies of homomeric P2X receptors expressed in frog oocytes and mammalian cell lines have provided insights into their functional characteristics and have shown that P2X1 receptor subunit homomers differ from the homomeric P2X4 and P2X6 receptors in a number of ways. Firstly, recombinant homomeric P2X1 receptors exhibit rapid desensitisation and are sensitive to the synthetic agonist α,β-methylene ATP (α,β-meATP; Valera et al. 1994) while the homomeric P2X4 and P2X6 receptors show very slow desensitisation and are not sensitive to α,β-meATP (Bo et al. 1995; Collo et al. 1996). Secondly, homomeric P2X1 receptors are sensitive to the antagonists suramin and PPADS (Valera et al. 1994), but recombinant P2X4 and P2X6 homomeric receptors are insensitive to these compounds (Bo et al. 1995; Collo et al. 1996), while heteromeric P2X4/6 receptors are weakly sensitive to suramin (Lêet al. 1998a). In contrast to homomeric P2X1 receptors, P2X2 receptors are insensitive to α,β-meATP. Recent co-immunoprecipitation experiments using tagged P2X receptor protein have found that the P2X4 receptor subunit only forms heteromultimers with the P2X5 and P2X6 receptor subunits, suggesting that there are specific interactions between subunits that control which subunits can form functional receptors (Torres et al. 1999). In addition, the work of Torres et al. (1999) suggests that P2X6 subunits do not homo-oligomerise.
While there is ample evidence for the existence of functional P2X receptors in peripheral neurons (reviewed by Sneddon et al. 1996; Hoyle, 1996) and in brainstem nuclei, e.g. the locus coeruleus (Shen & North, 1993), there are only a few reports showing that functional P2X receptors exist in higher brain centres. P2X receptor-mediated calcium fluxes have been described in cultured cerebellar Purkinje cells (Mateo et al. 1998) and single channel currents mediated by P2X receptors from both Purkinje and cerebellar granule cells (Halliday & Gibb, 1997) have been observed. Synaptic transmission mediated by P2X receptors has been observed in the medial habenula (Edwards et al. 1992, 1997), spinal cord dorsal horn (Bardoni et al. 1997) and at some hippocampal Schaffer collateral-CA1 cell synapses (Pankratov et al. 1998).
Despite the evidence for expression of P2X receptor subunit mRNA and protein in the hippocampus, there is no information currently available concerning the single channel properties of P2X receptors in this brain region. The aim of the present study was to investigate the single channel properties of P2X receptors from dentate gyrus granule cells in hippocampal slices, and to compare the properties of these native receptors with those of P2X receptors expressed in recombinant systems. The results of these experiments provide detailed functional information on the properties of hippocampal P2X receptors and allow inferences to be made concerning the molecular composition of these receptors. Abstracts of some of these results have already been presented (Wong et al. 1998, 1999).
METHODS
Patch-clamp recording in brain slices
Patch-clamp recordings were made at room temperature (21–24°C) using brain slices obtained from 12-day-old Sprague-Dawley rats as previously described (Edwards et al. 1989). Rats were decapitated and 250 μm thick transverse slices of hippocampus were made in Krebs solution. Patch pipettes were pulled from borosilicate glass capillaries (Clark Electromedical GC150F-7.5) using a two-stage vertical puller (Narishige PP-83) coated with Sylgard (Dow Corning) and fire polished (Narishige MF-83) to a final tip diameter of around 1 μm. Pipettes had resistances of 12–16 MΩ when filled with internal solution. Dentate gyrus granule cells were identified visually using a Zeiss Axioskop FS microscope equipped with Nomarski differential interference contrast optics with a total magnification of × 640. Outside-out patches were formed from granule cells within the slice without prior cleaning following the method described by Hamill et al. (1981). Patches with resistances of greater than 50 GΩ were used for these experiments.
Solutions
The Krebs solution used for making brain slices had the following composition (mm): NaCl 125, NaHCO3 25, D-(+)-glucose 25, KCl 2.5, NaH2PO4 1.25, CaCl2 1 and MgCl2 2. The Krebs solution used during patch-clamp recording contained (mm): NaCl 125, NaHCO3 25, D-(+)-glucose 25, KCl 2.5, NaH2PO4 1.25 and CaCl2 1, and had a pH of 7.4 following gassing with 95% O2−5% CO2. All the reagents were from BDH (Poole, UK) and of AnalaR grade. The pipette solution consisted of (mm): CsCl 140, EGTA 10, Hepes 10 and CaCl2 1, adjusted to pH 7.3 using CsOH. ATP or α,β-meATP was bath applied in the presence of 10 μm 5,7-dichlorokynurenic acid (5,7-CK; Tocris) and 40 μm bicuculline methiodide (Sigma) to outside-out patches by manually switching a tap in the inflow to the recording chamber. In order to prevent degradation of ATP due to spontaneous hydrolysis or the action of ectonucleotidases within the slice, an ATP regenerating solution was made (MacDonald et al. 1989a) by including 20 mm phosphocreatine and 10 units ml−1 of creatine phosphokinase in addition to 1 mm ATP (all reagents from Sigma) in the recording Krebs solution. Suramin (40 μm; Bayer) was bath applied for at least 1 min before any agonist introduction. The free calcium concentration in the extracellular solution was calculated using the program ALEX written by Michel Vivaudou (Commissariat a l'Energie Atomique, Grenoble, France), which is based on the work of Fabiato (1988). Stability constants for HCO3−, HPO4−, ATP and phosphocreatine were taken from Smith & Martell (1982). The free extracellular Ca2+ concentration was estimated to be 0.3 mm when the ATP concentration was 1 mm, and 0.85 mm when the ATP concentration was 40 and 1 μm.
Data acquisition and analysis
Single channel currents were amplified using an Axopatch 200A Integrating Patch Clamp (Axon Instruments), filtered at 10 kHz (−3 dB) by an 8th order low-pass Bessel filter and stored on digital audio tape using a digital tape recorder (Biologic DTR-1202). Selected recordings were replayed, filtered at 2 kHz (−3 dB, Bessel) and digitised at 20 kHz using a CED 1401+ digital interface (Cambridge Electronic Design) connected to a Dell XPS P133c computer, and stored on hard disk.
Following digitisation, single channel records were analysed by the time course-fitting method using the single channel analysis program SCAN (Colquhoun & Sigworth, 1995). Open time, shut time and burst length distributions are displayed logarithmically binned with a square root transformation of the ordinate (McManus et al. 1987; Sigworth & Sine, 1987). Channel openings are referred to as ‘apparent openings’ where appropriate to indicate that many observed openings are likely to contain unresolved gaps. Dwell time distributions were fitted using the program EKDIST with a mixture of exponential components using the maximum likelihood method (Colquhoun & Sigworth, 1995). Open-shut point amplitude distributions, and distributions of amplitudes measured by time course fitting were constructed using openings and closings longer than 2.0 filter rise times (tr = 0.332 ms) and fitted with two or three Gaussian components using the maximum likelihood method. Distributions of the number of openings in bursts of openings were fitted with two geometric components.
The open probability of the channel (Popen) in the presence of ATP was calculated by dividing the mean open time by the sum of the mean open time and mean shut time. Mean open and shut times were calculated by integration of the exponential components fitted to open and shut time distributions, respectively.
Statistical analysis was by Student's paired two-tailed t test and a P value of ≤ 0.05 was considered significant. The slopes of the linear regression lines were tested for significance using an F test.
Definition of bursts
Bursts of openings were defined as openings separated by closed times shorter than a critical length, tcrit (Colquhoun & Sakmann, 1985). This was calculated so as to make the percentage of long closed times that were misclassified as being within bursts equal to the percentage of short closed times that were misclassified as being between bursts (Colquhoun & Sakmann, 1985). For each patch containing large conductance P2X receptors, the tcrit was calculated from the best-fit parameters of the shut time distribution, treating the second and third fastest components as being ‘within bursts’ and ‘between bursts’respectively. For patches containing the flickery P2X receptor, tcrit was calculated in an analogous way, using components three and four of the shut time distribution.
RESULTS
Single channel recordings from native tissue preparations have demonstrated that ATP is able to activate channels with conductances between 9 and 63 pS (Benham & Tsein, 1987; Krishtal et al. 1988; Fieber & Adams, 1991; Silinsky & Gerzanich, 1993; Nakazawa & Hess, 1993) in 1 or 2 mm external Ca2+. These conductances differ from those of recombinant homomeric P2X1, P2X2, P2X3 or P2X4 receptors expressed in CHO cells, which varied from 9 to 21 pS in 0.3 mm external Ca2+ (Evans, 1996), and P2X2 receptors expressed in Xenopus oocytes where the conductance was 28 pS in zero external calcium (Zhou & Hume, 1998) or in HEK cells where the conductance was 20 pS in 1 mm external Ca2+ (Zhou & Hume, 1998). In patches from hippocampal granule cells, we also found that the conductance of native P2X receptors differed from that of homomeric recombinant receptors.
Single channel conductance of large conductance P2X receptors
Figure 1 shows a representative recording from a hippocampal granule cell outside-out patch exposed to 1 mm ATP. Figure 1A illustrates the activation of channels observed on bath application of ATP. Figure 1B shows a continuous recording of 65 s of data at a membrane potential of −60 mV. Channel openings were, on average, 3.1 pA in amplitude at this membrane potential. There were at least two channels present in the patch, as a small number of double openings were observed. This is interesting given the fact that 1 mm ATP evoked channel openings in only 15 out of 94 patches. In the absence of extracellular ATP, channel openings were rare (mean ±s.e.m. of 0.9 ± 0.03 s−1) and often were of different amplitude to channels activated by ATP, as illustrated in Fig. 1A during the 30 s of recording prior to ATP application. In the presence of 1 mm ATP, channel openings were mainly to one conductance level, although in 10 of the 15 patches obtained at this agonist concentration, a subconductance level was occasionally observed with an amplitude of 2.8 pA. For the 15 patches challenged with 1 mm ATP, Popen was 0.07 ± 0.008, with an opening frequency of 15.7 ± 2.29 s−1. This is a statistically significant increase in activity compared to control recordings (paired t test; P < 0.05). Thus, ATP application produced an approximately 20-fold increase in channel activity. Popen was agonist concentration dependent, as illustrated in Fig. 1C. For the four patches exposed to 1 or 40 μm ATP, Popen was 0.005 ± 0.001 (opening frequency, 2.4 ± 0.76 s−1) and 0.03 ± 0.01 (opening frequency, 12.2 ± 5.64 s−1), respectively. The results suggest an EC50 of around 40 μm for ATP at these receptors (assuming 1 mm ATP produces maximal steady-state channel activation). The ATP-induced increase in both Popen and opening frequency was statistically significant (unpaired t test; P < 0.05).
Figure 1. Activation by ATP of single channel currents in hippocampal granule cell outside-out patches.
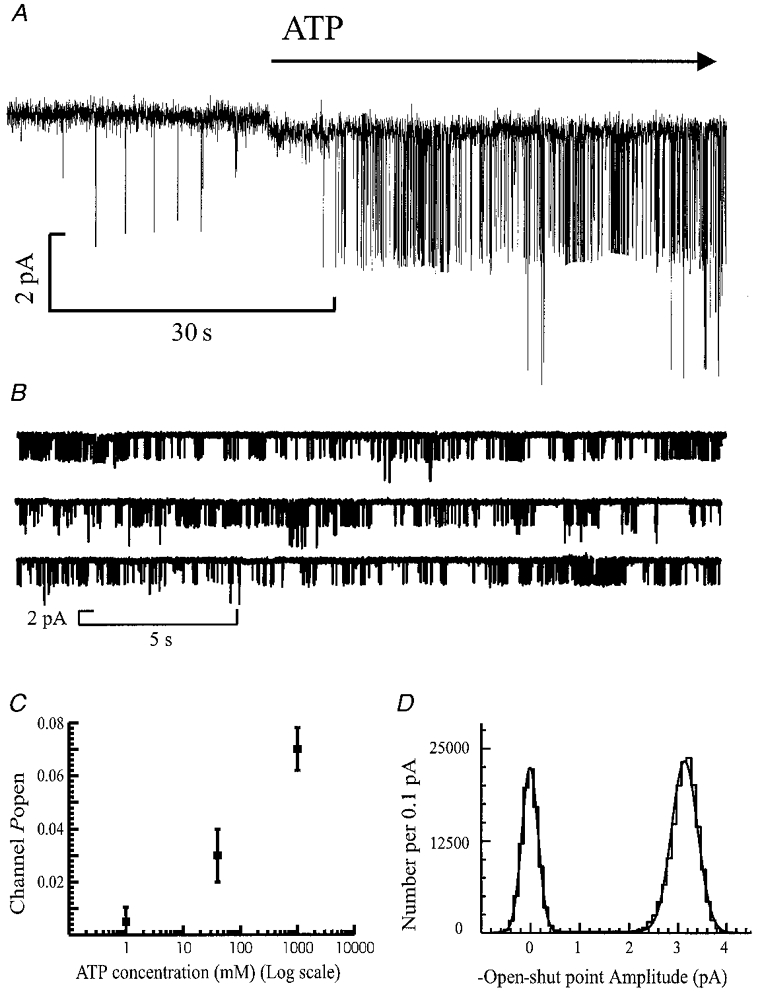
Single channel currents were activated by 1 mm ATP in the presence of 10 μm 5,7-CK and 40 μm bicuculline. Membrane potential, −60 mV. Free extracellular Ca2+ concentration, 0.3 mm. Channel openings appear as downward deflections from the baseline. A, channels are activated by ATP. The open probability (Popen) before bath application of 1 mm ATP was 0.0007. ATP was added to the bath at the point indicated by the start of the arrow. B, successive horizontal traces showing three contiguous sweeps of 21 s duration to demonstrate typical channel activity seen at this concentration of ATP. In the presence of ATP, Popen was 0.095 with an opening frequency of 19.5 s−1. Currents were low-pass filtered at 2 kHz (−3 dB) and digitised at 20 kHz. C, the effect of increasing ATP concentration on Popen of the channel. The mean Popen was 0.005 ± 0.001, 0.03 ± 0.01 and 0.06 ± 0.008 in the presence of 1 μm, 40 μm and 1 mm ATP, respectively. Data points are means ±s.e.m. from four patches at 1 and 40 μm ATP, and 15 patches in the presence of 1 mm ATP. D, open-shut point amplitude distribution of 3725 channel openings of duration longer than two filter rise times (tr = 0.332 ms), measured from the same patch as illustrated in A. The distribution was fitted with the sum of two Gaussian components with fitted parameters of 0.01 pA (relative area, 36%; s.d. = 0.17 pA) and 3.1 pA (54%; s.d. = 0.27 pA).
Figure 1D shows the open-shut point amplitude distribution measured in this patch at a membrane potential of −60 mV. For 15 patches in the presence of 1 mm ATP at −60 mV the mean amplitude (and relative area) was 3.36 ± 0.11 pA (95 ± 1%). For 10 of these 15 patches a subconductance level of 2.82 ± 0.19 pA (8 ± 1%) was observed. Since the occurrence of the sublevel was relatively rare, channel shut time and channel burst analyses were performed without distinguishing between conductance levels. The proportion of sublevel openings increased as the ATP concentration was reduced and the mean amplitude of channel openings showed a slight concentration dependence, having an amplitude of 3.4 ± 0.11 pA in the presence of 40 μm ATP, and 3.05 ± 0.1 pA in 1 μm ATP.
The qualitative effect of changing the membrane potential on the channel properties of large conductance P2X receptors is shown in Fig. 2A. The traces suggest that there is an increase in the mean open time of the receptor at more depolarised voltages, and that the reversal potential of the channel is around 0 mV. It is also clear that the large conductance P2X receptor from hippocampal granule cells is also able to pass current at positive membrane potentials (Fig. 2B), unlike some native P2X receptors in other neuronal cell types (Krishtal et al. 1988; Bean et al. 1990; Silinsky & Gerzanich, 1993) or recombinant P2X2 receptors where rectification of the single channel current is marked (Zhou & Hume, 1998; Ding & Sachs, 1999).
Figure 2. Dependence of channel amplitude on membrane potential.
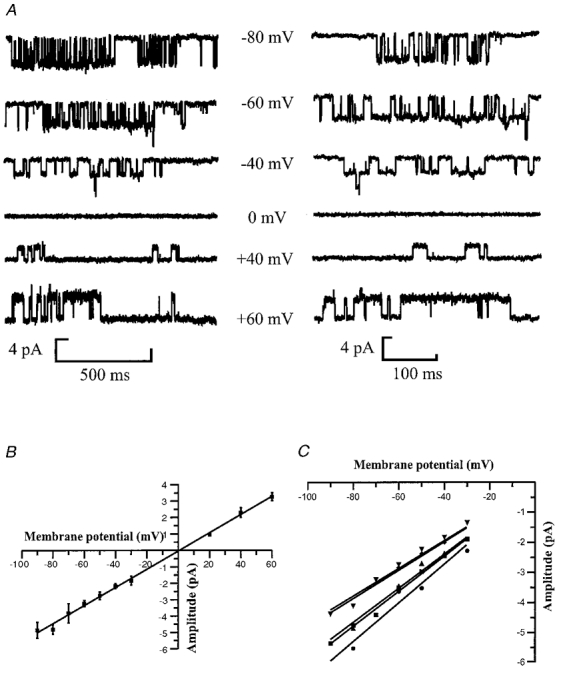
A, single channel currents were activated by 1 mm ATP in the presence of 10 μm 5,7-CK, with a free Ca2+ concentration of 0.3 mm. Recordings are from an outside-out patch clamped at the membrane potentials shown beside the traces. Channel openings appear as downward deflections from the baseline at negative membrane potentials, and upward deflections from the baseline at positive membrane potentials. The left panel shows horizontal sweeps of 1100 ms to demonstrate channel activity at each membrane potential, and the right panel shows 400 ms traces of channel openings. Current records were low-pass filtered at 2 kHz (−3 dB) and digitised at 20 kHz. B, relationship between single channel current amplitude and patch potential for five separate patches. Data points are means ±s.e.m. of the mean single channel current obtained from Gaussian fits to the open-shut point amplitude distribution obtained at each membrane potential. The points were fitted with a linear regression line that predicts a slope conductance of 55 pS with a reversal potential of +2.0 mV. C, individual current-voltage relationships for each of five patches between −90 and −30 mV. The symbols represent mean single channel current obtained from Gaussian fits of the amplitude distribution at each patch potential. The points are fitted with linear regression lines constrained to cross the ordinate at +2.0 mV. The slopes of the regression lines give a mean slope conductance of 54 ± 3.6 pS.
Figure 2B shows the single channel current-voltage relationship for P2X receptors in outside-out patches, where the external solution contained 0.3 mm free Ca2+ and 1 mm ATP. The data were fitted with a linear regression line producing a slope conductance of 55 pS with a reversal potential of +2.0 mV. This corresponds well with the chord conductance of the channel, which was 56 ± 1.8 pS measured at −60 mV, assuming a reversal potential of 0 mV (n = 15). The individual current-voltage relationships for five patches where recordings were made between −90 and −30 mV are illustrated in Fig. 2C and the slopes of the regression lines give a mean slope conductance of 54 ± 3.6 pS. P2X receptor channels with a linear single channel current-voltage relationship ave been observed in smooth muscle (Benham & Tsein, 1987), cardiac ganglia (Fieber & Adams, 1991) and myenteric neurons (Zhou & Galligan, 1996). However, the single channel conductance observed in this study has not previously been observed in other native tissue preparations. In addition, increasing the extracellular Ca2+ concentration has been shown to markedly reduce the conductance of P2X receptors in PC12 cells (Nakazawa & Hess, 1993) and sensory ganglia (Krishtal et al. 1988). However, this does not seem to be the case for hippocampal granule cell P2X receptors, as when the free Ca2+ concentration was increased from 0.3 mm to 0.85 mm, no significant decrease in single channel conductance was observed (56 ± 1.8 pS in 1 mm Ca2+; n = 4; P > 0.05).
Kinetic analysis of large conductance channels
The distributions of apparent open times and closed times contain information relevant to the channel activation mechanism and in particular allow prediction of the number of shut states occupied by the receptor during activation and identification of the groups of openings (referred to as ‘bursts’) which occur during a single activation of the receptor (Colquhoun & Hawkes, 1981,1982). In total we studied 15 patches exposed to 1 mm ATP. Four of these patches were also tested with 40 μm ATP and, in addition, four other patches were tested only with 1 μm ATP. Following analysis of the distributions of channel shut times and open times, the distributions of burst lengths, total open time per burst and number of openings per burst were analysed.
Shut time distributions
Distributions of shut times, such as those shown in Fig. 3A and B, were best fitted with the sum of five exponential components at all three concentrations of ATP tested. At 1 μm ATP these had time constants (and relative areas) of τ1 = 63 ± 14 μs (20 ± 3.5%), τ2 = 0.92 ± 0.04 ms (52 ± 2.1%), τ3 = 18 ± 4.2 ms (5.9 ± 0.9%), τ4 = 715 ± 354 ms (9.4 ± 2.3%) and τ5 = 3433 ± 1192 ms (13 ± 1.9%). The distribution means averaged 515 ± 185 ms. At 1 mm ATP, the exponential components had time constants (and relative areas) of τ1 = 90 ± 10 μs (20 ± 1.9%), τ2 = 0.76 ± 0.09 ms (32 ± 4.3%), τ3 = 10 ± 2.1 ms (15 ± 1.6%), τ4 = 90 ± 24 ms (18 ± 2.6%) and τ5 = 403 ± 103 ms (15 ± 2.4%). The distribution means averaged 62 ± 10 ms (Table 1).
Figure 3. Agonist concentration dependence of P2X receptor shut times.
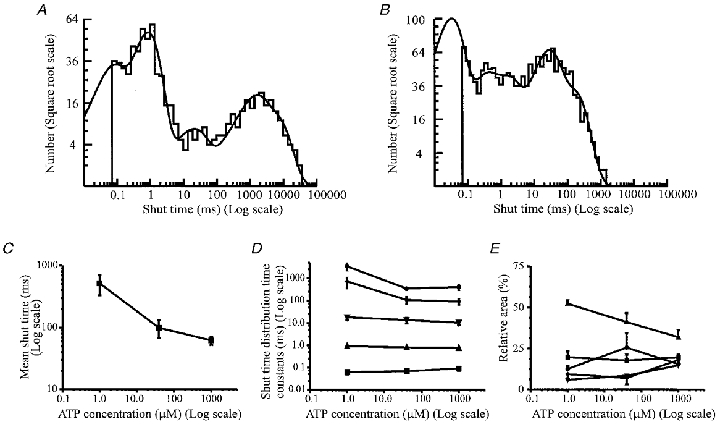
A, distribution of all shut times greater than 70 μs in length (n = 719) from an outside-out patch in the presence of 1 μm ATP. Membrane potential, −60 mV. The shut time distribution is plotted with the log of the shut time on the ordinate versus the square root of the bin frequency on the abscissa (Sigworth & Sine, 1987; McManus et al. 1987). This transformation converts the normal exponential distribution into a peaked distribution and each peak corresponds to the time constant of each exponential component. The distribution was best fitted with the sum of five exponential components, with means (and relative areas) of 56 μs (21%), 0.84 ms (50%), 19.0 ms (6%), 1185 ms (12%) and 5367 ms (11%). The mean shut time was 716 ms. The fit predicts the existence of 889 gaps. B, distribution of all shut times greater than 68 μs in duration (n = 1558) from the same patch as illustrated in Fig. 1A, in the presence of 1 mm ATP at a membrane potential of −60 mV. The distribution was best fitted with the sum of five exponential components, with means (and relative areas) of 30 μs (38%), 0.25 ms (11%), 1.3 ms (14%), 24 ms (22%) and 147 ms (14%). The mean shut time was 31 ms. The fit predicts the existence of 2289 gaps. C, the effect of increasing ATP concentration on the mean shut time. Data are expressed as means ±s.e.m. from four patches at 1 and 40 μm ATP, and 15 patches at 1 mm ATP. D, effect of increasing ATP concentration on the time constants of the shut time distribution. Data for each component are expressed as means ±s.e.m. from four patches at 1 and 40 μm ATP, and 15 patches at 1 mm ATP. ▪, time constant of the first (fastest) exponential; ▴ and ▾, second and third time constants of the shut time distribution, respectively; ♦, time constant of the fourth exponential; •, time constant of the fifth component. E, effect of increasing ATP concentration on the relative areas of the exponential components of the shut time distribution. Data points representing the relative area of each exponential component of the shut time distribution are expressed as means ±s.e.m. from four patches at 1 and 40 μm ATP, and 15 patches at 1 mm ATP. ▪, relative area of the first (fastest) exponential; ▴ and ▾, relative area of the second and third exponential components, respectively; ♦, relative area of the fourth exponential; •, relative area of the fifth component.
Table 1.
Summary of distribution parameters for large conductance hippocampal P2X receptors
| Component | 1 (μs) | 2 (ms) | 3 (ms) | 4 (ms) | 5 (ms) | Distribution mean |
|---|---|---|---|---|---|---|
| Apparent open time | — | 0.7 ± 0.06 | 3.7 ± 0.3 | — | — | 2.6 ± 0.24 ms |
| Relative area | 37 ± 4% | 63 ± 4% | ||||
| Shut time | 90 ± 10 | 0.76 ± 0.09 | 10 ± 2.1 | 90 ± 24 | 403 ± 103 | 62 ± 10 ms |
| Relative area | 20 ± 2% | 32 ± 4% | 15 ± 2% | 18 ± 3% | 15 ± 2% | |
| Burst length | — | 0.38 ± 0.09 | 5.9 ± 0.8 | 31 ± 8 | — | 8.8 ± 1.8 ms |
| Relative area | 19 ± 3% | 55 ± 6% | 26 ± 6% | |||
| Total open time per burst | — | 0.38 ± 0.09 | 4.9 ± 0.6 | 42 ± 15 | — | 8.4 ± 1.8 ms |
| Relative area | — | 19 ± 3% | 46 ± 7% | 35 ± 8% | ||
| No. of openings per burst | 1.7 ± 0.15 | 4.9 ± 0.7 | — | — | — | 3.0 ± 0.44 |
| Relative area | 54 ± 6% | 46 ± 6% | ||||
| Burst Popen | — | — | — | — | — | 0.96 ± 0.03 |
Measurements of the distribution parameters obtained from the analysis of P2X receptor channel activity in the presence of 1 mm ATP at −60 mV (n = 15). Shown is the mean ±s.e.m.of each parameter, and immediately below each parameter estimate is the mean ±s.e.m.of the percentage area of that particular component.
The time constants of the two shortest components were found not to vary significantly (Student's t test; P > 0.05) with agonist concentration (Fig. 3C). The third exponential time constant did not significantly decrease between 1 μm and 1 mm ATP (P = 0.08). Intriguingly, there was a significant decrease in the relative area of the second exponential component, and a concomitant increase in the relative area of the third exponential (Fig. 3E) with increasing ATP concentration (Student's t test; P < 0.05). The time constants of the last two components of the shut time distribution did vary widely between patches at the same ATP concentration and decreased significantly as the ATP concentration was increased (Fig. 3D). These results overall suggest that components four and five of the shut time distribution represent closed states that involve agonist binding to the receptor.
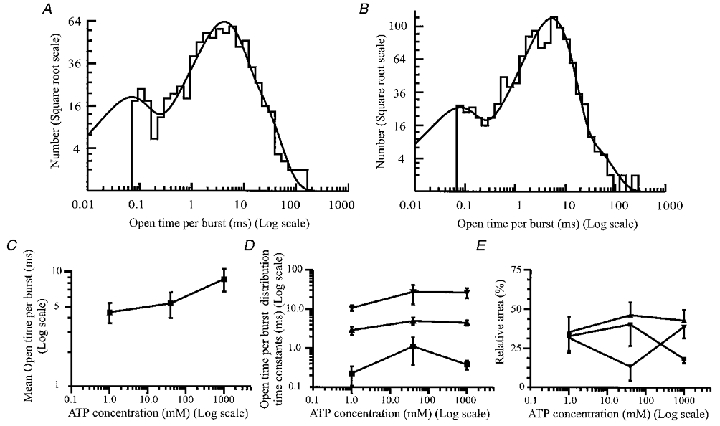
Distribution of apparent open times
The presence of a partially resolved fast exponential component in the shut time distributions suggests that many openings will in fact contain unresolved short gaps. Openings are therefore referred to as ‘apparent’ openings here. Distributions of apparent open times were best fitted with two exponential components (Fig. 4A and B). Figure 4A illustrates a typical open time distribution for a patch held at −60 mV in the presence of 1 μm ATP, which is qualitatively similar to the distribution observed in the presence of 1 mm ATP (Fig. 4B). There was a significant (unpaired t test; P > 0.05) increase in mean open time on increasing the ATP concentration from 1 μm to 1 mm (Fig. 4C). There was no evidence that the exponential time constants of the open time distributions were dependent upon agonist concentration (Fig. 4D). The data indicate that there was a decrease in the relative area of the first exponential component with increasing ATP concentration (Fig. 4E). There was a concomitant increase in the relative area of the second component with increasing agonist concentration (Fig. 4E).
Figure 4. Agonist concentration dependence of P2X receptor open times.
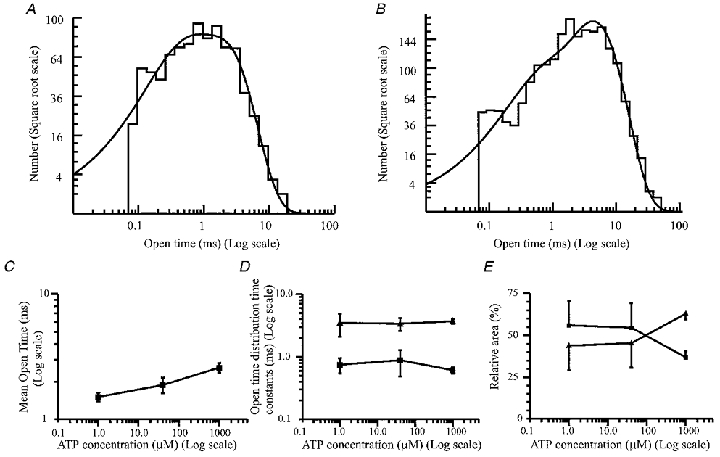
A, distribution of 876 apparent open times between 70 μs and 30 ms in the presence of 1 μm ATP. Membrane potential, −60 mV. The data were best fitted with two exponential components. These had time constants (and relative areas) of 0.35 ms (33%) and 1.8 ms (67%). The mean open time was 1.35 ms, and the fit predicts that there were 956 apparent openings in the data record. B, distribution of the length of 2082 apparent open times between 60 μs and 50 ms long from the patch shown in Fig. 1, in the presence of 1 mm ATP. The data were fitted with the sum of two exponential components with parameters of 0.46 ms (20%) and 4.3 ms (80%). The fit predicts that there were 2183 apparent openings in the data record with a mean open time of 3.58 ms. C, the effect of increasing ATP concentration on the mean channel open time. Data points show means ±s.e.m. from at least four patches at each agonist concentration. D, the effect of changing ATP concentration on the components of the open time distribution. Data points show means ±s.e.m. from at least four patches at each ATP concentration. ▪, time constant of the first (fastest) component of the distribution; ▴, mean of the time constant of the second component. E, effect of increasing ATP concentration on the relative areas of the time constants of the open time distribution. Data points representing the relative area of each exponential component of the open time distribution show the mean ±s.e.m. from four patches at 1 and 40 μm ATP, and 15 patches at 1 mm ATP. ▪, relative area of the first (fastest) exponential; ▴, relative area of the second component of the open time distribution.
Burst length distribution
Bursts were defined as groups of openings separated by shut times which were shorter than a critical gap length, tcrit. The value of tcrit was calculated to lie between τ2 and τ3, the second and third components of the shut time distribution. However, this definition of tcrit is imperfect, as the tenfold difference between the time constants of these two components is not large enough to unambiguously classify shut times as ‘between bursts’ or ‘within bursts’. The mean tcrit used to construct burst length distributions was not significantly dependent on ATP concentration (Student's t test; P > 0.05) and was 2.2 ± 0.35 ms at 1 mm ATP, 2.2 ± 0.16 ms at 40 μm ATP and 2.8 ± 0.27 ms at 1 μm ATP. Burst length distributions, as shown in Fig. 5A and B were constructed and were best fitted with the sum of three exponential components. There was no clear indication that the exponential components of the burst length distributions were dependent on ATP concentration (Fig. 5). There was a slight increase in the mean burst length of the receptor with increasing agonist concentration (Fig. 5C), from 5.4 ± 0.9 ms in 1 μm ATP to 8.8 ± 1.8 ms in 1 mm ATP. The mean burst length was 5.63 ± 1.3 ms in 40 μm ATP.
Figure 5. P2X receptor burst length properties.
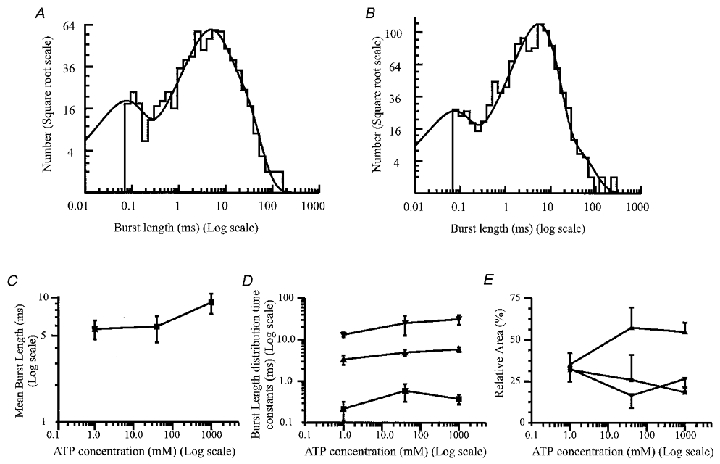
A, distribution of burst lengths for an outside-out patch exposed to 1 μm ATP. The critical gap length (tcrit) was 2.03 ms and 726 bursts were identified between 70 μs and 130 ms long. The distribution was best fitted with the sum of three exponential components with time constants (and relative areas) of 0.13 ms (12%), 4.0 ms (53%) and 14 ms (35%). The distribution mean gave a mean burst length of 7.18 ms and a total of 737 bursts. B, distribution of burst lengths for the same patch as in Fig. 1A, in the presence of 1 mm ATP. The critical gap length was 0.42 ms and 1143 bursts were identified between 69 μs and 247 ms long. The distribution is shown fitted with the sum of three exponential components, with parameters of 60 μs (16%), 5.2 ms (78%) and 25 ms (6%). The fitted curve predicts a mean burst length of 5.6 ms and a total of 1169 bursts. C, the effect of increasing ATP concentration on the mean burst length. Data points represent the mean ±s.e.m. burst length calculated from the time constants and relative areas of each individual component from at least four patches at each ATP concentration. D, the effect of ATP concentration on the burst distribution exponential time constants. ▪, first component; ▴ and ▾, second and third components of the burst length distribution, respectively. E, effect of increasing ATP concentration on the relative areas of the time constants of the burst length distribution. Data points representing the relative area of each exponential component of the burst length distribution show the mean ±s.e.m. from four patches at 1 and 40 μm ATP, and 15 patches at 1 mm ATP. ▪, relative area of the first (fastest) exponential component; ▴ and ▾, relative area of the second and third components, respectively.
Distribution of the total open time per burst
In principle, the number of components in the distribution of total open time per burst should equal the number of components in the open time distribution, and is a measure of the number of open states that the receptor can exist in (Colquhoun & Hawkes, 1981,1982). Distributions of the total open time per burst (Fig. 6A and B) were fitted with three exponential components. Both the time constants and the relative areas of these three components were very similar to those obtained for the burst length distributions, as expected for bursts where the gaps within bursts are relatively short.
Figure 6. P2X receptor total open time per burst.
A, distribution of the total open time per burst from the same patch as shown in Fig. 5A in the presence of 1 μm ATP. The distribution includes 726 bursts between 70 μs and 120 ms long and was best fitted with the sum of three exponential components with time constants (and relative areas) of 60 μs (19%), 3.6 ms (57%) and 14 ms (24%). The mean total open time per burst was 5.97 ms and the fit predicted the existence of 735 individual open times. B, distribution of the total open time per burst from the same patch as shown in Fig. 5B in the presence of 1 mm ATP. The distribution includes 1143 bursts and was best fitted with the sum of three exponential components. These had time constants (and relative areas) of 66 μs (16%), 5.2 ms (78%) and 25 ms (6%). The distribution mean was calculated to be 5.5 ms. The fit predicts 1290 individual open times. C, effect of increasing ATP concentration on the mean total open time per burst of the channel. Data points are means ±s.e.m. from four patches at 1 and 40 μm ATP, and 15 patches at 1 mm ATP. D, the effect of increasing ATP concentration on the open time per burst time constants. ▪, time constant of the first (fastest) exponential component of the distribution; ▴ and ▾, time constants of components two and three of the distribution, respectively. Data points are means ±s.e.m. from four patches at 1 and 40 μm ATP, and 15 patches at 1 mm ATP. E, effect of increasing ATP concentration on the relative areas of the time constants of the open time distribution. Data representing the relative area of each exponential component of the open time per burst distribution are expressed as means ±s.e.m. from four patches at 1 and 40 μm ATP, and 15 patches at 1 mm ATP. ▪, relative area of the first (fastest) exponential; ▴ and ▾, relative area of the second and third components, respectively.
The fraction of time for which the channel is open during a particular burst (i.e. the burst Popen) was calculated by dividing the mean total open time per burst by the mean burst length. At −60 mV the mean burst Popen was 0.96 ± 0.03 for the 15 patches in the presence of 1 mm ATP, and for the four patches with different ATP concentrations this was 0.79 ± 0.02 at 1 μm ATP, 0.89 ± 0.02 at 40 μm ATP, and 0.94 ± 0.03 at 1 mm ATP. Thus, ATP activates hippocampal P2X receptors with high efficacy when the effects of desensitisation and agonist binding and unbinding are excluded.
Distribution of the number of apparent openings per burst
In principle, since there are three exponential components in the total open time per burst distribution, there should be three geometric components in distributions of the number of openings per burst and three exponential components in distributions of apparent open times (Colquhoun & Hawkes, 1981,1982). However, as with the dwell time distributions, some of the components may be missed if they are too small to be detected or have a mean near to that of another component. In these experiments, we detected only two geometric components in distributions of the number of openings per burst (Fig. 7A and B, Table 1). There was no evidence of any agonist concentration dependence of the number of openings per burst (Fig. 7C, D and E).
Figure 7. P2X receptor number of openings per burst.

A, distribution of the number of openings per burst elicited by 1 μm ATP. The distribution was fitted with the sum of two geometric components with means (and relative areas) of 1.8 (55%) and 5.1 (45%) openings per burst. The fitted geometric components are represented as dashed lines superimposed on the distribution. The distribution mean was 3.3 openings per burst. B, distribution of the number of apparent openings per burst fitted with two geometric components from a patch in the presence of 1 mm ATP. The components of the fit had means (and relative areas) of 1.0 (35%) and 2.0 (65%) openings per burst. The mean for this distribution averaged 1.6 openings per burst. C, the effect of increasing ATP concentration on the mean number of openings per burst from at least four patches at each ATP concentration. D, the effect of ATP concentration on the mean of each geometric component in distributions of the number of openings per burst; ▪, first component; ▴, second component. E, effect of increasing ATP concentration on the relative areas of the time constants of the number of openings per burst distribution. Data points representing the relative area of each geometric component of the number of openings per burst distribution are expressed as means ±s.e.m. from four patches at 1 and 40 μm ATP, and 15 patches at 1 mm ATP. ▪, relative area of the first geometric component; ▴, relative area of the second component. Data points are connected by a straight line drawn through the data obtained for the relative area of each separate component.
Voltage dependence of large conductance P2X receptor properties
Figure 8A shows that there is at most only a slight voltage dependence of the mean open time and no obvious voltage dependence of the overall Popen of the large conductance P2X receptor. Unlike the P2X receptors observed in superior cervical ganglia (Cloues, 1995), the hippocampal large conductance P2X receptor shows a significant (linear regression F test, P < 0.05) voltage-dependent increase in the burst length and mean total open time per burst with depolarisation (Fig. 9A and B). This is due to the voltage-dependent increase in the number of apparent openings per burst (Fig. 9C). There was no evidence of any voltage dependence of the open probability per burst, as shown in Fig. 9D.
Figure 8. Voltage dependence of P2X receptor open times and Popen.
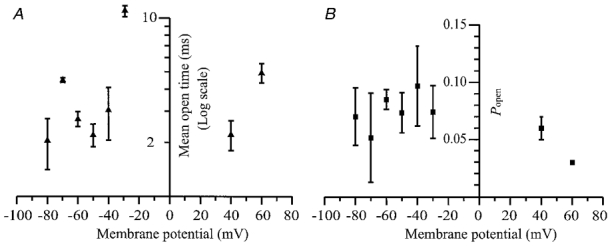
The data points represent means ±s.e.m. for 3−5 patches at each voltage of the mean open time (A) and Popen(B).
Figure 9. Relationship between single channel burst parameters and membrane potential.
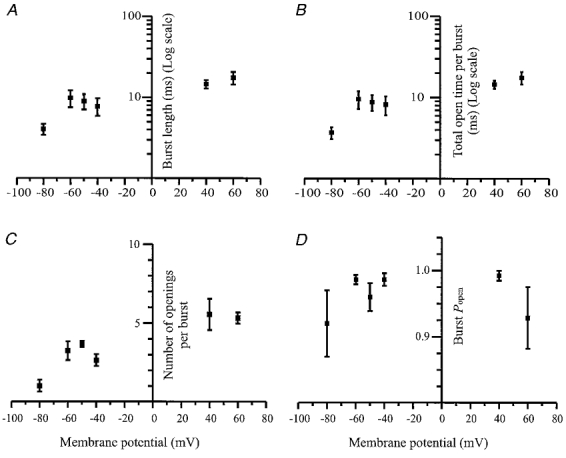
Data are from three to five patches at each membrane potential. In each graph data points represent means ±s.e.m. of the burst parameters calculated from fits to the burst distributions obtained at each membrane potential. The slope of the linear regression line in each graph was significantly different from zero (P > 0.05), apart from the burst Popen which was not significantly voltage dependent (P = 0.98). A, voltage dependence of burst lengths. B, voltage dependence of mean total open time per burst. C, voltage dependence of the number of apparent openings per burst. D, voltage dependence of Popen during a burst.
The effect of suramin on the large conductance P2X receptor
Suramin is the drug most widely used to antagonise P2X receptors. A feature of homomeric P2X4 and P2X6 receptor channels is that they are not antagonised by suramin (Bo et al. 1995; Collo et al. 1996; but see Séguéla et al. 1996), whereas homomeric receptors formed by the expression of other P2X receptor subtypes are sensitive to suramin. Figure 10 shows qualitatively the effect of suramin at the single channel level. The figure illustrates that 40 μm suramin, a concentration which should block responses mediated by homomeric P2X1, P2X2, P2X3 or P2X5 receptors, leads to a reduction in the frequency of openings and an increase in the closed periods between channel openings. In order to avoid possible rundown of channel activity being interpreted as inhibition by suramin, control periods of recording in the presence of 1 mm ATP were made both before and after application of 1 mm ATP in the presence of 40 μm suramin. The effect of suramin was expressed relative to the mean activity measured before and after suramin application. Suramin significantly increased the single channel conductance of these receptors by 19 ± 7% (P < 0.05) from 52 ± 1.8 pS to 62 ± 3.3 pS. A similar effect of suramin could account for part of the 33% increase in homomeric P2X4 whole-cell current seen in the presence of suramin (Bo et al. 1995). This increase in single channel conductance in the presence of suramin indicates that the action of suramin is not competitive at these receptors. In four out of five patches, suramin produced a significant decrease (46 ± 11%; P < 0.05) in Popen from 0.064 ± 0.016 to 0.032 ± 0.005. However, in one patch, Popen increased from 0.048 to 0.06. When the data obtained from this other patch were taken into account, a significant decrease in Popen of the hippocampal P2X receptor (30 ± 16%) and a significant decrease in mean open time (27 ± 9%) occurred in the presence of suramin. In addition, 40 μm suramin caused a significant decrease in the mean burst length (31 ± 13%), suggesting that the main effect of suramin is to reduce the duration of P2X receptor activation.
Figure 10. The effect of 40 μm suramin on single channel currents activated by 1 mm ATP.
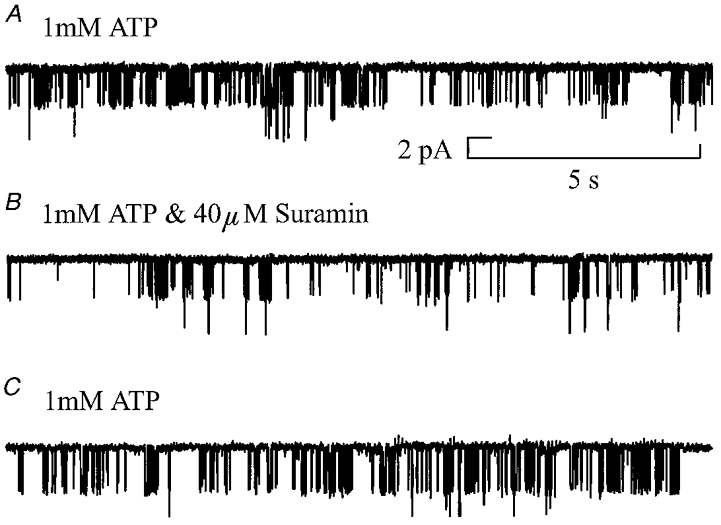
Outside-out patch. Membrane potential, −60 mV. Channel openings are shown as downward deflections from the baseline. Each horizontal trace shows a 15 s recording before suramin addition (upper trace; Popen = 0.095), in the presence of ATP and suramin (middle trace; Popen = 0.038), and following suramin washout (lower trace; Popen = 0.053) to demonstrate the pattern of channel activity. Currents were low-pass filtered at 2 kHz (−3 dB) and sampled at 20 kHz.
Large conductance channels activated by α,β-meATP
The synthetic purinoceptor agonist α,β-meATP (40 μm) also activated large conductance channels in 3 out of 17 outside-out patches from granule cells, with a chord conductance of 57 ± 1.1 pS at −60 mV. The mean open time of these receptors was 6.2 ± 1.2 ms with a mean shut time of 652 ± 197 ms. This compares with a conductance of 56 ± 1.8 pS and mean open time of 1.8 ± 0.27 ms for channels activated by 40 μm ATP.
Flickery P2X receptors
In addition to the large conductance P2X receptor, a P2X receptor with more stereotypical flickery openings was also observed in dentate gyrus granule cells. However, this was observed in only three patches, and the receptor appeared to desensitise in the continued presence of ATP. A 2 s recording of the flickery channel at a membrane potential of −60 mV is illustrated in Fig. 11A. There are a number of qualitative differences between the channels observed in this trace and those illustrated in Fig. 1. Firstly, there are at least three active channels in the patch and the channel activations occur in long bursts. It can also be seen that the channel flickers rapidly between open and shut states. Figure 11B shows the open-shut point amplitude distribution for the patch shown in Fig. 11A. The distribution in Fig. 11B was best fitted with three Gaussian components, implying that a subconductance level is present, although there was no evidence of this from the amplitude distributions obtained from the other two patches, which were fitted with the sum of two Gaussian components (closed channel level and one open level). We conclude that, like the large conductance P2X receptor, the flickery channel exhibits only one main conductance level of 1.89 ± 0.3 pA at −60 mV, which corresponds to a chord conductance of 32 ± 6 pS, assuming a linear current- voltage relationship and a reversal potential of 0 mV.
Figure 11. Flickery single channel currents activated by 1 mm ATP.
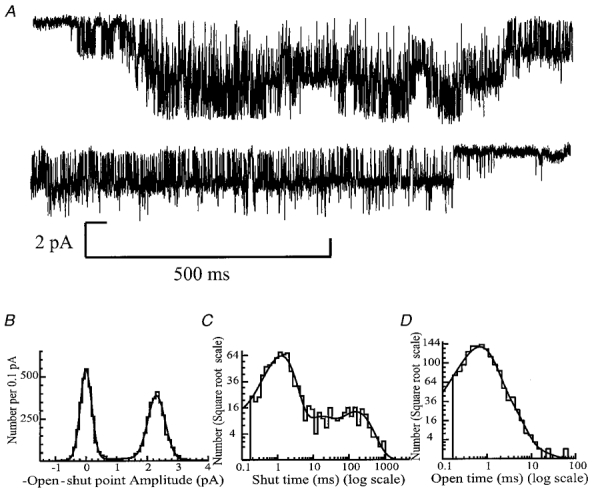
Outside-out patch. Membrane potential, −60 mV. Multiple flickery channel openings are illustrated as downward deflections from the baseline. The traces show two contiguous sweeps of 1.1 s duration demonstrating the flickery nature of this single channel behaviour. Currents were low-pass filtered at 2 kHz (−3 dB) and sampled at 20 kHz. B, open-shut point amplitude distribution of 1175 open and closed periods of longer than two filter rise times (tr = 0.332 ms). The distribution was fitted with the sum of three Gaussian components with fitted parameters of 0.003 pA (relative area, 45%; s.d. = 0.19 pA), 1.28 pA (7%; s.d. = 1.25 pA) and 2.30 pA (48%; s.d. = 0.28 pA), giving a mean single channel amplitude of 2.17 pA and open probability of 0.55. C, distribution of the length of 887 shut times longer than 170 μs in duration. The distribution was best fitted with the sum of five exponential components with parameters of 50 μs (relative area, 6%), 0.9 ms (26%), 1.5 ms (44%), 12 ms (8%) and 154 ms (16%). The mean shut time was 26 ms. The fit predicts the existence of 1044 shut times. D, distribution of the length of 1417 apparent open times longer than 170 μs in duration. The data were fitted with the sum of three exponential components with time constants (and relative areas) of 0.6 ms (74%), 2 ms (25%) and 6 ms (1%). The mean apparent open time was 1 ms. The fit predicts that there were 1779 openings in the data record.
The shut time histograms for the flickery P2X receptors, while fitted with the same number of components (five) as those obtained for the large conductance P2X receptor, were qualitatively and quantitatively very different (compare Fig. 11C with Fig. 3A and B). The five exponentials had time constants (and relative areas) of τ1 = 51 ± 0.6 μs (36 ± 23%), τ2 = 0.59 ± 0.21 ms (23 ± 11%), τ3 = 1.06 ± 0.25 ms (30 ± 10%), τ4 = 20.1 ± 6.37 ms (4.5 ± 2.0%) and τ5 = 1682 ± 1440 ms (6.4 ± 4.6%). The distribution mean was 23 ± 6.8 ms. The open time distributions were also very different from those of the large conductance channel (compare Fig. 11D with Fig. 4A and B), and were best fitted with the sum of three exponential components, in contrast to open time histograms for the large conductance P2X receptor which were best fitted with two exponentials. The open time distributions for the flickery channel had time constants (and relative areas) of τ1 = 0.38 ± 0.11 ms (29 ± 23%), τ2 = 1.2 ± 0.45 ms (33 ± 21%) and τ3 = 3.3 ± 1.6 ms (38 ± 30%). The mean apparent open time of these flickery channels was 0.98 ± 0.27 ms.
The burst kinetics of flickery P2X receptors
Bursts were again defined to include all shut times which were shorter than a critical gap length, tcrit. The value of tcrit was calculated between the third and fourth components of the shut time distribution, as there was a twentyfold difference between these two components. The mean tcrit that was used for the analysis of bursts was 2.1 ± 0.49 ms. Burst length distributions were fitted with the sum of three exponential components, with time constants (and relative areas) of τ1 = 0.41 ± 0.10 ms (43 ± 9%), τ2 = 4.3 ± 2.2 ms (27 ± 9%) and τ3 = 31 ± 9.7 ms (30 ± 6%). The distribution means gave a mean burst length of 11 ± 4.7 ms (Table 2).
Table 2.
Summary of distribution parameters for flickery P2X receptors
| Component | 1 (μs) | 2 (ms) | 3 (ms) | 4 (ms) | 5 (ms) | Distribution mean |
|---|---|---|---|---|---|---|
| Apparent open time | — | 0.38 ± 0.11 | 1.2 ± 0.45 | 3.3 ± 1.6 | — | 1.0 ± 0.3 ms |
| Relative area | 29 ± 23% | 33 ± 21% | 37 ± 30% | |||
| Shut time | 51 ± 0.6 | 0.58 ± 0.21 | 1.1 ± 0.25 | 20 ± 6.4 | 1682 ± 1440 | 23 ± 6.8 ms |
| Relative area | 35 ± 23% | 22 ± 11% | 30 ± 9% | 4 ± 2% | 6 ± 5% | |
| Burst length | — | 0.40 ± 0.10 | 4.4 ± 2.2 | 31 ± 9.7 | — | 11 ± 4.7 ms |
| Relative area | 42 ± 9% | 27 ± 9% | 30 ± 6% | |||
| Total open time per burst | — | 0.48 ± 0.07 | 6.8 ± 2.3 | 30 ± 8.3 | — | 9.5 ± 4.9 ms |
| Relative area | 47 ± 12% | 35 ± 4% | 18 ± 10% | |||
| No. of openings per burst | 1.2 ± 0.14 | 19.8 ± 3.0 | — | — | — | 9.0 ± 1.2 |
| Relative area | 56 ± 10% | 44 ± 10% | ||||
| Burst Popen | — | — | — | — | — | 0.82 ± 0.07 |
Measurements of the distribution parameters obtained from the analysis of P2X receptor channel activity in the presence of 1 mm ATP at −60 mV (n = 3). Shown is the mean ±s.e.m.of each parameter, and immediately below each parameter estimate is the mean ±s.e.m.of the percentage area of that particular component.
Distributions of total open time per burst were also fitted with the sum of three exponentials. The time constants (and relative areas) of the distributions were τ1 = 0.48 ± 0.06 ms (47 ± 12%), τ2 = 6.8 ± 2.3 ms (35 ± 4%) and τ3 = 30 ± 8.3 ms (18 ± 10%), with a distribution mean of 9.55 ± 4.9 ms. The burst Popen for the flickery channel was 0.82 ± 0.07 (Table 2).
Distributions of the number of apparent openings per burst were best fitted with the sum of two geometric components. These had values of 1.4 ± 0.14 (55 ± 10%) and 20 ± 2.9 (44 ± 10%), respectively. The mean number of openings per burst was 9.04 ± 1.23 (Table 2).
DISCUSSION
The results presented here provide the first description of the single channel properties of native P2X receptors from dentate gyrus granule cells in rat hippocampal slices. Hippocampal P2X receptor channel openings occur in bursts and the properties of these bursts (short openings, short gaps and a high Popen within the burst) are consistent with the general principles of ligand-gated ion channel receptor activation, as first described for the muscle nicotinic ACh receptor (Colquhoun & Sakmann, 1985). This is an interesting observation, given that the protein structure of P2X receptors is likely to be quite different from that of nicotinic or other ion channel receptors (Brake et al. 1994; Valera et al. 1994). The activation properties of hippocampal P2X receptors are also consistent with a physiological role of mediating fast excitatory synaptic transmission (Edmonds et al. 1995). We have also demonstrated the existence of two distinct populations of P2X receptor in hippocampal granule cells, which are referred to here as the large conductance P2X receptor and the flickery P2X receptor. Both species of P2X receptor have unique single channel characteristics when compared to other native and recombinant P2X receptors.
Despite the relatively high density of P2X receptor subunit mRNA (Collo et al. 1996) and protein (Kidd et al. 1995; Lêet al. 1998b) in the hippocampus, functional P2X receptors were only observed in a total of 22 out of 115 patches. Firstly, this may be because functional receptors are expressed at a low density, or they could be localised preferentially in the dendrites or axon terminals of the granule cell rather than at the cell body, from which membrane patches were isolated. However, in most patches where channel activity was observed, some double openings were present. These double openings occurred at a much higher frequency than would be expected if they were due to the random superposition of background channels evident in the absence of ATP with those channels activated by ATP application. This suggests that P2X receptors may be clustered in the cell membrane rather than exhibiting an even but sparse distribution over the soma. Secondly, it could be that the majority of P2X receptors on the granule cells are non-functional, but those that are functional exist in functional groups. A third reason for the lack of active P2X receptors in many outside-out patches could be that patch excision inactivates these P2X receptors.
Single channel conductance
The results of this study show that both the large conductance (55 pS) and flickery (32 pS) P2X receptors in the hippocampus open to one main conductance level. The single channel conductance is larger than has previously been reported for homomeric P2X1, P2X2, P2X3 or P2X4 receptors expressed in CHO cells. Evans (1996) described flickery channels due to activation of homomeric P2X1, P2X2 and P2X4 receptors, with chord conductances at −100 mV of 18, 21 and 9 pS, respectively (in 0.3 mm extracellular calcium). Homomeric P2X3 receptor channels were reported to be too flickery to determine the single channel conductance accurately (Evans, 1996). P2X receptors with single channel conductances ranging from 0.2 to 63 pS have been observed in native tissue preparations, although it is necessary to consider a potential effect of calcium ions on conductance when comparing results from different studies. It has been demonstrated that raising the extracellular calcium concentration leads to a decrease in the single channel conductance of PC12 cell P2X receptors (Nakazawa & Hess, 1993), which are probably homomeric P2X2 receptors (Brake et al. 1994), and the conductance of other cation channels, including NMDA receptors (Ascher & Nowak, 1988; Gibb & Colquhoun, 1992), and both endplate (Colquhoun & Sakmann, 1985) and ganglionic nicotinic ACh receptors, is sensitive to extracellular calcium (Mathie et al. 1991). However, the large conductance hippocampal P2X receptor was found in this study to have a slope conductance of 55 pS in both 0.3 and 0.85 mm free extracellular calcium. A conductance of 55 pS is much greater than that reported for recombinant homomeric P2X receptors (Evans, 1996; Zhou & Hume, 1998; Ding & Sachs, 1999) and greater than that of the majority of native P2X receptors, although a P2X receptor with a conductance of 63 pS has been observed in cardiac ganglia (Fieber & Adams, 1991). It is interesting to note that for P2X receptors expressed in sensory ganglia, when the calcium concentration is changed between 0.1 and 5 mm, the decrease in single channel conductance is relatively small (Krishtal et al. 1988), so not all P2X receptors have a calcium-sensitive single channel conductance like that described by Nakazawa & Hess (1993) for the P2X receptor in PC12 cells. It is possible that this property is related to channel calcium permeability and a number of studies have shown that both native and recombinant homomeric P2X receptors have significant calcium permeability (reviewed by Edwards et al. 1997).
The flickery channel in hippocampal granule cells had a single channel conductance of 31 pS in 0.3 mm calcium. This is close to the 35 pS observed by Krishtal et al. (1988) for a flickery P2X receptor channel in sensory ganglia (0.1 mm extracellular calcium). Further experiments need to be performed to determine whether changing the extracellular calcium concentration has any effect on the single channel properties of the hippocampal flickery P2X receptor.
The difference in single channel conductance between P2X receptors both within the hippocampus and between the hippocampus and other neuronal preparations (see e.g. Krishtal et al. 1988; Khakh et al. 1997) probably reflects differences in receptor subunit composition. P2X receptors are likely to be composed of either a trimer/hexamer (Nicke et al. 1998; Stoop et al. 1999) or a tetramer of subunits (Kim et al. 1997).
Channel open times
The distribution of open times for the large conductance P2X receptor was best fitted with the sum of two exponential components, implying that the receptor can exist in a minimum of two distinct open states. However, three components were necessary to fit distributions of the total open time per burst, suggesting that there are three open states (Colquhoun & Hawkes, 1982). A particular open state cannot be assigned to a particular conductance level, as two components were present in the open time distributions even when there was only a single component in the amplitude distribution. Therefore, these results suggest that the receptor is able to open to at least two discrete open states of 55 pS conductance. When the ATP concentration was lowered from 1 mm to 1 μm, there was a decrease in the mean open time and a reduction in the percentage area of the slow exponential component of the open time distribution. This concentration dependence of the open time suggests that the open state of the receptor is dependent on the number of agonist molecules that are bound to the receptor. The distribution of open times for dorsal root ganglia P2X receptors has previously been shown to have two components (Krishtal et al. 1988) but their concentration dependence was not reported.
P2X receptors in sensory neurons have a Hill coefficient close to three suggesting that three agonist molecules need to bind to the receptor to produce efficient channel activation (Bean, 1990). However, studies of P2X receptors in vas deferens (Friel, 1988) and cardiac muscle (Friel & Bean, 1988) suggest that only two molecules of agonist need to bind to activate the receptor. Therefore, P2X receptors may exhibit two or three distinct open states dependent on the number of agonist molecules bound. Studies on nicotinic ACh receptors and GABAA receptors at low agonist concentrations suggest that a singly liganded channel can open briefly (Colquhoun & Sakmann, 1985; MacDonald et al. 1989b) but there was no evidence of this for NMDA receptors (Gibb & Colquhoun, 1992). A similar mechanism could underlie the shift in the relative area from the first to the second component of the open time distribution with increasing ATP concentration as the proportion of partially liganded receptors to fully liganded receptors will be higher at lower agonist concentrations.
Channel closed times
The shut time distributions of both populations of P2X receptor were best fitted with the sum of five exponential components (Figs 3A and B, and 11C; Tables 1 and 2). The shut time distribution is therefore more complex than that of muscle nicotinic ACh receptors, which show only a short (20 μs) component and a longer component of around 700 ms, with a small intermediate component (0.5 ms) (Colquhoun & Sakmann, 1985). In contrast to the nicotinic receptor, five exponential components are found in GABAA, glycine and NMDA receptor shut time distributions (MacDonald et al. 1989b; Twyman & Macdonald, 1991; Gibb & Colquhoun, 1992).
Both large conductance and flickery hippocampal P2X receptors can exist in at least five distinct shut states. As macroscopic current recordings suggest that either two (Friel & Bean, 1988) or three (Bean, 1990) molecules of ATP can bind to other P2X receptors, then four of the five shut states could correspond to the free, monoliganded, doubly liganded and possibly triply liganded states of the receptor. Further shut states due to receptor desensitisation may be present, as desensitisation occurs with most native and recombinant P2X receptors (Valera et al. 1994; Brake et al. 1994; Chen et al. 1995; Bo et al. 1995; Collo et al. 1996). Precise physical correlates of the shut time components cannot be assigned without more detailed information about the mechanism of receptor activation. Since gaps between agonist binding events are likely to be very short at 1 mm ATP, the long gaps at this agonist concentration are more likely to represent periods when all receptors in the patch are desensitised. At low agonist concentrations, however, the long gaps are more likely to represent periods when all the receptors in the patch are unoccupied. The intriguing decrease in the relative area of the second exponential component of the shut time distribution (Fig. 3E) suggests that one of the open states occurs when the receptor is not fully liganded (Colquhoun & Hawkes, 1981), which is consistent with the concentration dependence of the open time distribution components illustrated in Fig. 4.
The fact that the time constants of the first two exponential components in the shut time distribution (for large conductance P2X receptors) are not dependent on the agonist concentration suggests that they represent fully liganded shut states. They are also relatively consistent between patches, which probably have varying numbers of active receptors which would be expected to cause variation in the shut times between receptor activations, but would not affect shut times within single activations. These gaps therefore provide useful information about the activation of the P2X receptor and suggest that during activation (e.g. during a synaptic current) the open probability of the receptor channel is high.
Burst properties
Activation of P2X receptors occurred in bursts of openings, as well as single openings. This bursting behaviour has been observed in a wide range of ion channels, including nicotinic ACh receptors (Colquhoun & Sakmann, 1985; Mathie et al. 1991), NMDA receptors (Howe et al. 1991; Gibb & Colquhoun, 1992), GABAA receptors (MacDonald et al. 1989b) and glycine receptors (Twyman & MacDonald, 1991), and is consistent with the characteristics expected for a fast neurotransmitter receptor (Edmonds et al. 1995). There was no significant change in the mean burst length with increasing ATP concentration but there was a significant increase in the burst Popen.
The burst kinetics of ligand-gated ion channel receptors may determine the time course of decay of most synaptic currents in the brain (reviewed by Edmonds et al. 1995). To date, in the CNS, P2X receptor-mediated synaptic currents have been observed in the medial habenula (Edwards et al. 1992), the dorsal horn of the spinal cord (Bardoni et al. 1997) and the hippocampus (Pankratov et al. 1998). The mean burst length of both the large conductance (10 ms) and the flickery P2X receptor channel (11 ms) is shorter than the 18 ms decay time constant reported in the medial habenula (Edwards et al. 1997), and therefore it is possible, depending on the receptor first latency time (Edmonds et al. 1995), that burst kinetics like this could underlie the synaptic current observed in the habenula. In addition, the absence of rectification observed in hippocampal neurons is also observed for habenular synaptic currents (Edwards et al. 1997). However, the medial habenula synaptic currents are blocked by suramin and by α,β-meATP (Edwards et al. 1992), indicating that receptors different from those observed in this study underlie purinergic transmission in the medial habenula. Experiments with outside-out patches from medial habenula neurons need to be performed to determine whether a purinoceptor similar to the large conductance hippocampal P2X receptor exists in the habenula, although the soma of medial habenula neurons may not express P2X receptors (S. Robertson & F. A. Edwards, personal communication). Likewise, experiments investigating purinergic synaptic transmission in the hippocampal granule cells need to be performed to investigate whether P2X receptors similar to those described here mediate a component of synaptic transmission in the dentate gyrus. Although P2X receptor-mediated synaptic currents have been observed in the CA1 field of the hippocampus (Pankratov et al. 1998), the single channel properties of CA1 P2X receptors have yet to be described. The decay time constants for these synaptic currents were not provided and nor was the sensitivity to suramin tested. CA1 cell P2X receptors were partially blocked by 10 μm PPADS (60%) and by α,β-meATP (20 μm) and exhibited desensitisation (Pankratov et al. 1998). These two lines of evidence suggest that a P2X receptor distinct from that observed in this study mediates a component of synaptic transmission in the CA1 region of the hippocampus. The burst kinetics of the two types of P2X receptor in granule cells are not consistent with the decay time constant of purinergic EPSCs in the spinal cord (decay time constants of 4–44 ms; Bardoni et al. 1997) and therefore, given that the dorsal horn receptors are also blocked by suramin (100 μm), it is likely that a different type of receptor underlies the decay of the purinergic synaptic current in the dorsal horn.
The subunit composition of hippocampal granule cell P2X receptors
The pharmacological and biophysical evidence presented in this study suggests that the large conductance P2X receptor in hippocampal granule cells is likely to be a heteromer made up of a combination of P2X4 and P2X6 subunits or possibly any three of P2X1, P2X2, P2X4 and P2X6. Another, albeit less likely, possibility is that the large conductance P2X receptor is a homomer containing P2X4 subunits. The large conductance P2X receptor was partially inhibited by suramin application (30% reduction of Popen), consistent with heteromeric P2X receptors consisting of the P2X4 and P2X6 receptor subunits (Lêet al. 1998a), but the degree of block was greater than that for recombinant P2X4 homomers (Bo et al. 1995; but see Séguéla et al. 1996). Suramin is a competitive antagonist at some P2X receptors (Dunn & Blakeley, 1988; Blakeley et al. 1991), but the fact that suramin increases the single channel conductance shows that it is not competitive at granule cell P2X receptors.
In addition, the large conductance hippocampal P2X receptor was sensitive to α,β-meATP, which is not consistent with the presence of homomeric P2X2 or P2X5 receptors, as these receptors are insensitive to α,β-meATP (Brake et al. 1994; Collo et al. 1996). This line of evidence also makes it unlikely that the receptor is a homomer of P2X4 subunits as α,β-meATP is inactive when recombinant P2X4 receptor subunits are expressed in oocytes (Bo et al. 1995), but is consistent with the receptor being a heteromer of P2X4 and P2X6 subunits as recombinant P2X4 and P2X6 receptor heteromers are activated by α,β-meATP (Lêet al. 1998a). This, coupled with the fact that the 55 pS conductance observed for this channel is six times larger than the single channel conductance of homomeric P2X4 receptor channels (9 pS; Evans, 1996) suggests that the large conductance hippocampal P2X receptor is indeed a heteromer. However, the results presented in this paper do not rule out the presence of other suramin-sensitive subunits contributing to the large conductance P2X receptor, provided binding of suramin to that subunit does not prevent receptor activation. For example, one possibility is that the receptor is a trimer of P2X2, P2X4 and P2X6 subunits
The flickery channel has a similar single channel conductance (32 pS) to that observed in spinal sensory neurons (35 pS) by Krishtal et al. (1988). The difference in conductance could be attributable to the higher concentration of extracellular calcium ions used in this study (0.3 mm as opposed to 0.1 mm for Krishtal et al. 1988). If this is the case, then the flickery P2X receptor may be composed of similar subunits to those in sensory neurons. It has been demonstrated that dorsal root ganglion neurons express functional heteromeric P2X receptors composed of P2X2 and P2X3 receptor subunits (Lewis et al. 1995). However, the single channel characteristics of these receptors have not yet been determined, so it is not clear yet whether the flickery channel could be composed of these two subunits.
In conclusion, the results of this study demonstrate the presence of functional P2X ATP receptors in the dentate gyrus of the hippocampus. To date, this is the first detailed single channel analysis of P2X receptors in the CNS. The results demonstrate that activation of P2X receptors follows the same principles established for activation of other ligand-gated ion channels that mediate fast synaptic transmission, allowing P2X receptors to contribute to the diversity of synaptic mechanisms in the mammalian brain.
Acknowledgments
This work was supported by the MRC, the Royal Society and the Nuffield Foundation. A.Y.C.W holds a UCL Departmental PhD studentship.
References
- Ascher P, Nowak L. The role of divalent cations in the N-methyl-D-aspartate responses of mouse central neurones in culture. The Journal of Physiology. 1988;399:247–266. doi: 10.1113/jphysiol.1988.sp017078. [DOI] [PMC free article] [PubMed] [Google Scholar]
- Balcar VJ, Li Y, Killinger S, Bennett MR. Autoradiography of P2X ATP receptors in the rat brain. British Journal of Pharmacology. 1995;115:302–306. doi: 10.1111/j.1476-5381.1995.tb15877.x. [DOI] [PMC free article] [PubMed] [Google Scholar]
- Bardoni R, Goldstein PA, Lee CJ, Gu J, MacDermott AB. P2X ATP receptors mediate fast synaptic transmission in the dorsal horn of the rat spinal cord. Journal of Neuroscience. 1997;17:5297–5304. doi: 10.1523/JNEUROSCI.17-14-05297.1997. [DOI] [PMC free article] [PubMed] [Google Scholar]
- Bean BP. ATP-activated channels in rat and bullfrog sensory neurons: Concentration dependence and kinetics. Journal of Neuroscience. 1990;10:1–10. doi: 10.1523/JNEUROSCI.10-01-00001.1990. [DOI] [PMC free article] [PubMed] [Google Scholar]
- Bean BP, Williams CA, Ceelen PW. ATP activated channels in rat and bullfrog sensory neurons; current voltage relationship and single-channel behaviour. Journal of Neuroscience. 1990;10:11–19. doi: 10.1523/JNEUROSCI.10-01-00011.1990. [DOI] [PMC free article] [PubMed] [Google Scholar]
- Benham CD, Tsien RW. A novel receptor-operated Ca2+ channel activated by ATP in smooth muscle. Nature. 1987;328:275–278. doi: 10.1038/328275a0. [DOI] [PubMed] [Google Scholar]
- Blakeley AGH, Brockbank JE, Kelly SS, Petersen SA. Effects of suramin on the concentration-response relationship of α,β-methylene ATP in the mouse vas deferens. Journal of Autonomic Pharmacology. 1991;11:45–49. doi: 10.1111/j.1474-8673.1991.tb00243.x. [DOI] [PubMed] [Google Scholar]
- Bo X, Burnstock G. Distribution of 3H α,β-methylene ATP binding sites in rat brain and spinal cord. NeuroReport. 1994;5:1601–1604. doi: 10.1097/00001756-199408150-00015. [DOI] [PubMed] [Google Scholar]
- Bo X, Zhang Y, Nassar M, Burnstock G, Schoepfer R. A P2X purinoceptor cDNA conferring a novel pharmacological profile. FEBS Letters. 1995;375:129–133. doi: 10.1016/0014-5793(95)01203-q. [DOI] [PubMed] [Google Scholar]
- Brake AJ, Wagenbach MJ, Julius D. New structural motif for ligand-gated ion channels defined by an ionotropic ATP receptor. Nature. 1994;371:519–523. doi: 10.1038/371519a0. [DOI] [PubMed] [Google Scholar]
- Chen CC, Akopian AN, Sivilotti L, Colquhoun D, Burnstock G, Wood JN. A P2X purinoceptor expressed by a subset of sensory neurons. Nature. 1995;377:428–431. doi: 10.1038/377428a0. [DOI] [PubMed] [Google Scholar]
- Cloues R. Properties of ATP-gated channel recorded from rat sympathetic neurons: Voltage dependence and regulation by Zn2+ ions. Journal of Neurophysiology. 1995;73:312–319. doi: 10.1152/jn.1995.73.1.312. [DOI] [PubMed] [Google Scholar]
- Collo G, North RA, Kawashima E, Merlo-Pich R, Neidhart S, Surprenant A, Buell G. Cloning of P2X5 and P2X6 receptors, and the distribution and properties of an extended family of ATP-gated ion channels. Journal of Neuroscience. 1996;16:2495–2507. doi: 10.1523/JNEUROSCI.16-08-02495.1996. [DOI] [PMC free article] [PubMed] [Google Scholar]
- Colquhoun D, Hawkes AG. On the stochastic properties of single ion channels. Proceedings of the Royal Society B. 1981;211:205–235. doi: 10.1098/rspb.1981.0003. [DOI] [PubMed] [Google Scholar]
- Colquhoun D, Hawkes AG. On the stochastic properties of bursts of single ion channel openings and of clusters of bursts. Philosophical Transactions of the Royal Society B. 1982;300:1–59. doi: 10.1098/rstb.1982.0156. [DOI] [PubMed] [Google Scholar]
- Colquhoun D, Sakmann B. Fast events in single channel currents activated by acetylcholine and its analogues at the frog muscle end-plate. The Journal of Physiology. 1985;369:501–557. doi: 10.1113/jphysiol.1985.sp015912. [DOI] [PMC free article] [PubMed] [Google Scholar]
- Colquhoun D, Sigworth FJ. Fitting and statistical analysis of single-channel records. In: Sakmann B, Neher E, editors. Single-Channel Recording. 2. New York: Plenum Press; 1995. pp. 483–587. Website: http://www.ucl.ac.uk/Pharmacology/dc.html. [Google Scholar]
- Ding S, Sachs F. Single channel properties of P2X2 purinoceptors. Journal of General Physiology. 1999;113:695–719. doi: 10.1085/jgp.113.5.695. [DOI] [PMC free article] [PubMed] [Google Scholar]
- Dunn PM, Blakeley AGH. Suramin: a reversible P2-purinoceptor antagonist in the mouse vas deferens. British Journal of Pharmacology. 1988;93:243–245. doi: 10.1111/j.1476-5381.1988.tb11427.x. [DOI] [PMC free article] [PubMed] [Google Scholar]
- Edmonds B, Gibb AJ, Colquhoun D. Mechanisms of activation of glutamate receptors and the time course of excitatory synaptic currents. Annual Review of Physiology. 1995;57:495–519. doi: 10.1146/annurev.ph.57.030195.002431. [DOI] [PubMed] [Google Scholar]
- Edwards FA, Gibb AJ, Colquhoun D. ATP receptor-mediated synaptic currents in the central nervous system. Nature. 1992;359:114–147. doi: 10.1038/359144a0. [DOI] [PubMed] [Google Scholar]
- Edwards FA, Konnerth A, Sakmann B, Takahashi T. A thin slice preparation for patch clamp recordings from neurones of the mammalian central nervous system. Pflügers Archiv. 1989;414:600–612. doi: 10.1007/BF00580998. [DOI] [PubMed] [Google Scholar]
- Edwards FA, Robertson SJ, Gibb AJ. Properties of ATP-mediated synaptic transmission in the rat medial habenula. Neuropharmacology. 1997;36:1253–1268. doi: 10.1016/s0028-3908(97)00127-5. [DOI] [PubMed] [Google Scholar]
- Evans RJ. Single channel properties of ATP-gated cation channels (P2X receptors) heterologously expressed in Chinese hamster ovary cells. Neuroscience Letters. 1996;212:212–214. doi: 10.1016/0304-3940(96)12804-4. [DOI] [PubMed] [Google Scholar]
- Fabiato A. Computer programs for calculating total from specified free or free from specified total ionic concentration in aqueous solutions containing multiple metals and ligands. Methods in Enzymology. 1988;157:378–417. doi: 10.1016/0076-6879(88)57093-3. [DOI] [PubMed] [Google Scholar]
- Fieber LA, Adams DJ. Adenosine triphosphate-evoked currents in cultured neurones dissociated from rat parasympathetic cardiac ganglia. The Journal of Physiology. 1991;434:239–256. doi: 10.1113/jphysiol.1991.sp018467. [DOI] [PMC free article] [PubMed] [Google Scholar]
- Friel DD. An ATP-sensitive conductance in single smooth muscle cells from the rat vas deferens. The Journal of Physiology. 1988;401:361–380. doi: 10.1113/jphysiol.1988.sp017167. [DOI] [PMC free article] [PubMed] [Google Scholar]
- Friel DD, Bean BP. Two ATP-activated conductances in bullfrog atrial cells. Journal of General Physiology. 1988;91:1–27. doi: 10.1085/jgp.91.1.1. [DOI] [PMC free article] [PubMed] [Google Scholar]
- Gibb AJ, Colquhoun D. Activation of N-methyl-D-aspartate receptors by L-glutamate in cells dissociated from adult rat hippocampus. The Journal of Physiology. 1992;456:143–179. doi: 10.1113/jphysiol.1992.sp019331. [DOI] [PMC free article] [PubMed] [Google Scholar]
- Halliday FC, Gibb AJ. Single-channel properties of P2X ATP receptors in rat cerebellar slices. The Journal of Physiology. 1997;504.P:51P. doi: 10.1111/j.1469-7793.2000.00529.x. [DOI] [PMC free article] [PubMed] [Google Scholar]
- Hamill OP, Marty A, Neher E, Sakmann B, Sigworth FJ. Improved patch clamp techniques for high-resolution current recording from cells and cell free patches. Pflügers Archiv. 1981;391:85–100. doi: 10.1007/BF00656997. [DOI] [PubMed] [Google Scholar]
- Howe JR, Cull-Candy SG, Colquhoun D. Currents through single glutamate receptor channel in outside-out patches from rat cerebellar granule cells. The Journal of Physiology. 1991;432:143–202. doi: 10.1113/jphysiol.1991.sp018381. [DOI] [PMC free article] [PubMed] [Google Scholar]
- Hoyle CHV. Purinergic cotransmission: parasympathetic and enteric nerves. Seminars in the Neurosciences. 1996;8:206–215. [Google Scholar]
- Khakh BS, Humphrey PP, Henderson G. ATP-gated cation channels (P2X purinoceptors) in trigeminal mesencephalic nucleus neurons of the rat. The Journal of Physiology. 1997;498:709–715. doi: 10.1113/jphysiol.1997.sp021895. [DOI] [PMC free article] [PubMed] [Google Scholar]
- Kidd EJ, Grahames CBA, Simon J, Michel AD, Barnard EA, Humphrey PPA. Localization of P2X purinoceptor transcripts in the rat nervous system. Molecular Pharmacology. 1995;48:569–573. [PubMed] [Google Scholar]
- Kim M, Yoo OJ, Choe S. Molecular assembly of the extracellular domain of P2X2, an ATP-gated ion channel. Biochemical and Biophysical Research Communications. 1997;240:618–622. doi: 10.1006/bbrc.1997.7713. [DOI] [PubMed] [Google Scholar]
- Krishtal OA, Marchenko SM, Obukhov AG. Cationic channels activated by extracellular ATP in rat sensory neurons. Neuroscience. 1988;27:995–1000. doi: 10.1016/0306-4522(88)90203-5. [DOI] [PubMed] [Google Scholar]
- Lê K-T, Babinski K, Séguéla P. Central P2X4 and P2X6 channel subunits coassemble into a novel heteromeric ATP receptor. Journal of Neuroscience. 1998a;18:7152–7159. doi: 10.1523/JNEUROSCI.18-18-07152.1998. [DOI] [PMC free article] [PubMed] [Google Scholar]
- Lê K-T, Villeneuve P, Ramjaun AR, McPherson PS, Beaudet A, Séguéla P. Sensory presynaptic and widespread somatodendritic immunolocalization of central ionotropic P2X ATP receptors. Neuroscience. 1998b;83:177–190. doi: 10.1016/s0306-4522(97)00365-5. [DOI] [PubMed] [Google Scholar]
- Lewis C, Neidhart S, Holy C, North RA, Buell G, Surprenant A. Coexpression of P2X2 and P2X3 subunits can account for ATP-gated currents in sensory neurons. Nature. 1995;377:432–435. doi: 10.1038/377432a0. [DOI] [PubMed] [Google Scholar]
- MacDonald JF, Mody I, Salter MW. Regulation of N-methyl-D-aspartate receptors revealed by intracellular dialysis of murine neurones in culture. The Journal of Physiology. 1989a;414:17–34. doi: 10.1113/jphysiol.1989.sp017674. [DOI] [PMC free article] [PubMed] [Google Scholar]
- MacDonald RL, Rogers CJ, Twyman RE. Kinetic properties of the GABAA receptor main conductance state of mouse spinal cord neurones in culture. The Journal of Physiology. 1989b;410:479–499. doi: 10.1113/jphysiol.1989.sp017545. [DOI] [PMC free article] [PubMed] [Google Scholar]
- McManus OB, Blatz AL, Magleby KL. Sampling, log binning, fitting, and plotting durations of open and shut intervals from single channels. Pflügers Archiv. 1987;410:530–553. doi: 10.1007/BF00586537. [DOI] [PubMed] [Google Scholar]
- Mateo J, Garcia-Lecea M, Miras-Portugal M, Castro E. Ca2+ signals mediated by P2X-type purinoceptors in cultured cerebellar Purkinje cells. Journal of Neuroscience. 1998;18:1704–1712. doi: 10.1523/JNEUROSCI.18-05-01704.1998. [DOI] [PMC free article] [PubMed] [Google Scholar]
- Mathie A, Colquhoun D, Cull-Candy SG. Conductance and single channel currents through nicotinic acetylcholine receptor channels in rat sympathetic ganglion neurones. The Journal of Physiology. 1991;439:717–750. doi: 10.1113/jphysiol.1991.sp018690. [DOI] [PMC free article] [PubMed] [Google Scholar]
- Nakazawa K, Hess P. Block by calcium of ATP-activated channels in Pheochromocytoma cells. Journal of General Physiology. 1993;101:377–392. doi: 10.1085/jgp.101.3.377. [DOI] [PMC free article] [PubMed] [Google Scholar]
- Nicke A, Baumert HG, Rettinger J, Eichele A, Lambrecht G, Mutschler E, Schmalzing G. P2X1 and P2X3 receptors form stable trimers: a novel structural motif of ligand-gated ion channels. EMBO Journal. 1998;11:3016–3028. doi: 10.1093/emboj/17.11.3016. [DOI] [PMC free article] [PubMed] [Google Scholar]
- Pankratov Y, Castro E, Miras-Portugal MT, Krishtal P. A purinergic component of the excitatory postsynaptic current mediated by P2X receptors in the CA1 neurons of the rat hippocampus. European Journal of Neuroscience. 1998;10:3898–3902. doi: 10.1046/j.1460-9568.1998.00419.x. [DOI] [PubMed] [Google Scholar]
- Séguéla P, Haghighi A, Soghomonian J-J, Cooper E. A novel neuronal P2X ATP receptor ion channel with widespread distribution in the brain. Journal of Neuroscience. 1996;16:448–455. doi: 10.1523/JNEUROSCI.16-02-00448.1996. [DOI] [PMC free article] [PubMed] [Google Scholar]
- Shen K-Z, North RA. Excitation of rat locus coeruleus neurons by adenosine-5′-triphosphate: Ionic mechanism and receptor characterization. Journal of Neuroscience. 1993;13:894–901. doi: 10.1523/JNEUROSCI.13-03-00894.1993. [DOI] [PMC free article] [PubMed] [Google Scholar]
- Sigworth FJ, Sine SM. Data transformations for improved display and fitting of single-channel dwell time histograms. Biophysical Journal. 1987;52:1047–1054. doi: 10.1016/S0006-3495(87)83298-8. [DOI] [PMC free article] [PubMed] [Google Scholar]
- Silinsky EM, Gerzanich V. On the excitatory effects of ATP and its role as a neurotransmitter in coeliac neurons of the guinea pig. The Journal of Physiology. 1993;464:197–212. doi: 10.1113/jphysiol.1993.sp019630. [DOI] [PMC free article] [PubMed] [Google Scholar]
- Smith RM, Martell AE. Critical Stability Constants. New York: Plenum Press; 1982. [Google Scholar]
- Sneddon P, McLaren GJ, Kennedy C. Purinergic cotransmission: sympathetic nerves. Seminars in the Neurosciences. 1996;8:201–205. [Google Scholar]
- Stoop R, Thomas S, Rassendren F, Kawashima E, Buell G, Surprenant A, North RA. Contribution of individual subunits to the multimeric P2X(2) receptor: estimates based on methanethiosulfonate block at T336C. Molecular Pharmacology. 1999;56:973–981. doi: 10.1124/mol.56.5.973. [DOI] [PubMed] [Google Scholar]
- Torres GE, Egan TM, Voigt MM. Hetero-oligomeric assembly of P2X receptor subunits — specificities exist with regard to possible partners. Journal of Biological Chemistry. 1999;274:6653–6659. doi: 10.1074/jbc.274.10.6653. [DOI] [PubMed] [Google Scholar]
- Twyman RE, MacDonald RL. Kinetic properties of the glycine receptor main and sub-conductance states of mouse spinal neurones in culture. The Journal of Physiology. 1991;435:303–331. doi: 10.1113/jphysiol.1991.sp018512. [DOI] [PMC free article] [PubMed] [Google Scholar]
- Valera S, Hussy N, Evans RJ, Adami N, North RA, Surprenant A, Buell G. A new class of ligand-gated ion channel defined by P2X receptor for extracellular ATP. Nature. 1994;371:516–519. doi: 10.1038/371516a0. [DOI] [PubMed] [Google Scholar]
- Vulchanova L, Arvidsson U, Riedl M, Wang J, Buell G, Surprenant A, North RA, Elde R. Differential distribution of two ATP-gated ion channels (P2X receptors) determined by immunocytochemistry. Proceedings of the National Academy of Sciences of the USA. 1996;93:8063–8067. doi: 10.1073/pnas.93.15.8063. [DOI] [PMC free article] [PubMed] [Google Scholar]
- Wong AYC, Burnstock G, Gibb AJ. Characterization of P2X ATP receptor single-channel properties in outside-out patches from granule cells in slices of rat hippocampus. The Journal of Physiology. 1998;511.P:17P. doi: 10.1111/j.1469-7793.2000.00529.x. [DOI] [PMC free article] [PubMed] [Google Scholar]
- Wong AYC, Burnstock G, Gibb AJ. The effect of suramin on the single channel properties of P2X ATP receptors in outside-out patches from rat hippocampal granule cells. The Journal of Physiology. 1999;518.P:120P. doi: 10.1111/j.1469-7793.2000.00529.x. [DOI] [PMC free article] [PubMed] [Google Scholar]
- Zhou X, Galligan JJ. P2X purinoceptors in cultured myenteric neurons of guinea-pig small intestine. The Journal of Physiology. 1996;496:719–729. doi: 10.1113/jphysiol.1996.sp021722. [DOI] [PMC free article] [PubMed] [Google Scholar]
- Zhou Z, Hume RI. Two mechanisms for inward rectification of current flow through the purinoceptor P2X2 class of ATP-gated channels. The Journal of Physiology. 1998;507:353–364. doi: 10.1111/j.1469-7793.1998.353bt.x. [DOI] [PMC free article] [PubMed] [Google Scholar]