

Abstract
The molecular and functional properties of neuronal nicotinic acetylcholine receptors (nAChRs) were characterized from CA1 neurons in rat hippocampal slices using single-cell reverse-transcription polymerase chain reaction (RT-PCR) in conjunction with whole-cell patch-clamp recordings.
We analysed the presence of the neuronal nAChR subunit mRNAs α2–7 and β2–4, along with the mRNA for the GABAergic markers GAD (glutamic acid decarboxylase) 65 and 67 isoforms, and VGAT (vesicular GABA transporter) in interneurons from the stratum radiatum and stratum oriens, and in CA1 pyramidal neurons. Functional nAChR-mediated currents were detected in both interneuron populations, but not in pyramidal neurons.
The neuronal nAChR subunit mRNAs detected in > 20 % of the populations examined were α4, α5, α7 and β2–4 in stratum radiatum interneurons; α2, α3, α4, α7, β2 and β3 subunits in stratum oriens interneurons; and β2–4 in pyramidal neurons. High levels of GABAergic marker mRNAs were detected in both interneuron populations, but not in pyramidal neurons.
Significant co-expression of nAChR subunits within individual neurons was detected for α3 +α5, α4 +β2, α4 +β3, α7 +β2, β2 +β3 and β3 +β4.
The kinetics of the nAChR-mediated currents in response to the application of 100 μm ACh were significantly correlated with the expression of particular nAChR subunits. The α3, α7 and β2 nAChR subunits were individually correlated with a fast rise time, the α2 nAChR subunit was correlated with a medium rise time, and the α4 nAChR subunit was correlated with a slow rise time. The α2 and α4 nAChR subunits were also significantly correlated with slow desensitization kinetics.
Neuronal nicotinic acetylcholine receptors (nAChRs) are members of the ligand-gated ion channel superfamily, along with the GABAA, glycine and 5-HT3 receptors. Currently there are at least 10 nAChR subunits known to be expressed in the rat CNS (see McGehee & Role, 1995; Boyd, 1997; Jones et al. 1999). The nAChRs are widely expressed throughout the CNS and have been suggested to play roles in such diverse phenomena as Alzheimer's disease (Perry et al. 1995), epilepsy (Steinlein et al. 1995), schizophrenia (Freedman et al. 1997), cognition (Levin, 1992; Changeux et al. 1998), tobacco addiction (Pontieri et al. 1996) and even cell proliferation and differentiation in the developing CNS (McFarland et al. 1991). However, many of the cellular and molecular mechanisms involved in these diverse actions are currently unknown.
Recent reports have clearly demonstrated a postsynaptic role for nAChRs in the hippocampus (Frazier et al. 1998a; Alkondon et al. 1998). These nAChRs are involved in fast synaptic transmission in CA1 stratum radiatum and stratum oriens interneurons. There is cholinergic innervation to the hippocampus from the medial septum-diagonal band complex (MSDB) of the basal forebrain (Frotscher & Leranth, 1985), and there is also evidence for intrinsic cholinergic synapses between hippocampal interneurons as well (Matthews et al. 1987; Freund & Buzsaki, 1996). Hippocampal interneurons can have GABAergic projections onto the more numerous CA1 pyramidal neurons, causing inhibition of pyramidal cell excitation. The neuronal nAChRs on hippocampal interneurons are in a key position to be involved in conditions previously linked to both the hippocampus and nicotine, such as cognition, schizophrenia and epilepsy (see Jones et al. 1999 for review).
Like other ligand-gated ion channels, the subunit composition of a nAChR determines its functional properties (e.g. ligand sensitivity, activation and desensitization rates, ion permeability and sensitivity to pharmacological agents; see Boyd, 1997 and McGehee, 1999, for reviews). The subunit composition of nAChRs in hippocampal neurons in vivo has yet to be determined. Previous studies have used pharmacological agents that suggest the involvement of particular nAChR subunits in the nAChR-mediated responses of these neurons (Jones & Yakel, 1997; Alkondon et al. 1998; Frazier et al. 1998b; McQuiston & Madison, 1999). These reports clearly suggest that α7-containing nAChRs are functionally expressed in most hippocampal interneurons, but the incomplete block by α7-specific antagonists also suggests that there is a class of non-α7-containing receptors for which the precise subunits involved are currently unknown. The composition of these non-α7-containing receptors has been difficult to establish using conventional pharmacological techniques, since there are not many agents which block nAChR subtypes that show subunit-specific selectivity for individual subunits other than α7. Therefore, we have used single-cell reverse-transcription polymerase chain reaction (single-cell RT-PCR; Eberwine et al. 1992; Lambolez, 1992; Jonas et al. 1994) to examine the subunit mRNA expression pattern in CA1 neurons (e.g. interneurons from the stratum radiatum and stratum oriens, as well as pyramidal neurons) in rat hippocampal slices to identify nAChR subunits that are involved in channel formation. Additionally, we performed whole-cell patch-clamp recordings of nAChR-mediated responses in these neurons as an assay of functional receptor properties. Using statistical analysis, we looked for functional and molecular correlations between nAChR subunit mRNA expression and functional nAChR channel properties using these combined techniques. We have found distinct patterns of expression for the various nAChR subunits in the three different neuronal populations examined, and have found statistically significant correlations between the kinetics of nAChR-mediated responses in neurons from brain slices and the mRNA expression of specific nAChR subunits.
METHODS
Hippocampal slice preparation
All experiments were carried out in accordance with guidelines approved by the NIEHS Animal Care and Use Committee. Wistar rats (11–19 days old) were anaesthetized with halothane and decapitated. The brain was removed and immediately placed into ice-cold artificial cerebrospinal fluid (ACSF) bubbled with 95 % O2 and 5 % CO2. ACSF consisted of (mm): 126 NaCl, 3.5 KCl, 1.2 NaH2PO4, 25 NaHCO3, 11 glucose, 6.0 MgCl2 and 2 CaCl2; pH 7.4. Coronal slices (300 μm thick), which included the hippocampus, were cut using a vibratome (Series 1000, Ted Pella Inc., Redding, CA, USA). Slices were transferred to a chamber containing ACSF, with 1.3 mm MgCl2 instead of 6.0 mm as above, bubbled with 95 % O2 and 5 % CO2, and incubated at 30°C for at least 1 h before recording.
Patch-clamp electrophysiology
Hippocampal slices were held in the recording chamber by using a platinum bridge with nylon cross fibres. During experiments, the slices were perfused with ACSF (1.3 mm MgCl2, room temperature) at 1–2 ml min−1. Functional nAChR currents were isolated pharmacologically by including atropine (10 μm, to block muscarinic ACh receptors), tetrodotoxin (TTX, 1 μm, to block Na+ channels), 6-cyano-7-nitroquinoxaline-2,3-dione (CNQX, 10 μm, to block glutamate receptors), 2-amino-5-phosphonovaleric acid (APV, 10 μm, to block NMDA receptors), and picrotoxin (50 μm, to block GABAA receptors) in the perfusing ACSF (K+ channels were blocked by including Cs+ in the internal solution, see below).
Neurons were visually identified, using differential interference contrast (DIC) optics, by location in the slice, in the CA1 stratum pyramidale, stratum radiatum or stratum oriens fields of the hippocampus. Recording/aspiration electrodes were pulled from Corning 7052 filamented glass (Garner Glass Co., Claremont, CA, USA) using a P-97 micropipette puller (Sutter Instruments, Novato, CA, USA) to a tip diameter of approximately 3 μm. Intra-pipette solution consisted of (mm): 140 caesium gluconate, 10 Hepes, 2 MgCl2, 0.5 CaCl2, 5 BAPTA and 2 Mg-ATP.
Neurons were voltage clamped at −70 mV (corrected for a 10 mV junction potential) during recordings. Whole-cell capacitance and series resistance were measured, and capacitance was compensated for, using an Axopatch 200A amplifier (Axon Instruments, Foster City, CA, USA). The average capacitance and series resistance by neuron type were as follows: 23.5 pF and 11.8 MΩ for stratum radiatum interneurons, 26.3 pF and 10.9 MΩ for stratum oriens interneurons, and 24.3 pF and 10.3 MΩ for stratum pyramidale neurons (see Fig. 1C for distributions).
Figure 1. Whole-cell patch-clamp recordings of the nAChR-mediated currents.
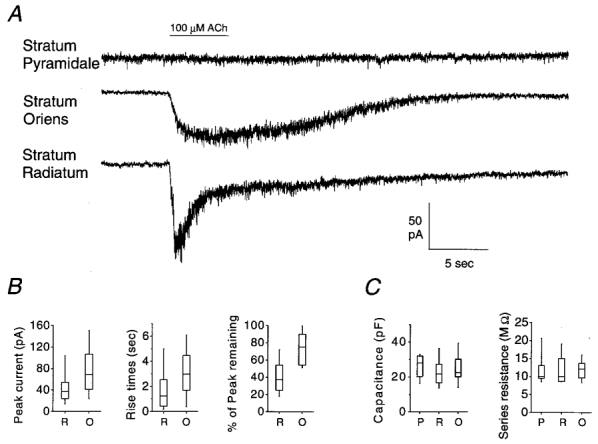
A, typical nAChR responses elicited by a 5 s application of ACh (indicated by horizontal bar) from each of the three neuronal populations examined. B, box plots showing the distributions of the peak currents, the 10–90 % rise times, and the percentage of the peak current remaining at the end of the 5 s ACh application for the two populations with functional nAChRs: stratum radiatum (R) and stratum oriens (O) interneurons. These were all significantly different between the two populations (Mann-Whitney test, P < 0.01). C, box plots representing the distributions for the capacitance and series resistance measurements from the three neuron populations examined: stratum pyramidale (P), stratum radiatum (R) and stratum oriens (O). The boxes represent the ranges of the 25th–75th percentiles (50th percentile is the middle line), and the bars represent the ranges of the 10th–90th percentiles.
Whole-cell recordings were filtered at 1 kHz, and sampled at 100 Hz, using the pCLAMP Clampex software (version 7.01.31, Axon Instruments). Acetylcholine (ACh) was applied for 5 s using an electronically triggered valve (General Valve Co., Fairfield, NJ, USA) connected to a synthetic quartz tube (inner diameter of 320 μm, Polymicro Technologies Inc., Phoenix, AZ, USA) placed approximately 90–120 μm from the cell body. The flow rate for the ACh application from the gravity-flow system was 250 μl min−1. A washout period of at least 3 min was included between subsequent recordings. Data were collected and 10–90 % rise times (the time interval between 10 and 90 % of the peak amplitude) were calculated automatically using the Clampex software. The percentage of the peak current remaining at the end of the 5 s ACh application (used as a measure of nAChR desensitization) was calculated for each trace. Cells where the current was still rising at the end of the ACh application were counted as 100 % of peak.
Reverse transcription (RT) reaction
Neurons were aspirated under visual observation by application of suction using a 10 ml syringe attached to the recording pipette, and then added to the reverse transcription reaction mixture. The RT mix consisted of (mm unless otherwise stated): 50 KCl, 10 Tris-HCl (pH 8.3), 5 MgCl2, 1 DTT, 1 each dNTP, 2.5 μm random hexamers, 0.33 U μl−1 RNase inhibitor (5 Prime-3 Prime Inc., Boulder, CO, USA) and 10 U μl−1 Superscript II reverse transcriptase (Gibco-BRL, Rockville, MD, USA) in DEPC-treated water. RT reactions had a total volume of 10 μl each. Reactions were run at 25°C for 10 min, 42°C for 60 min, and 95°C for 5 min in a PTC-200 thermal cycler (MJ Research Inc., Watertown, MA, USA). Reactions were stored at 4°C until running the PCR.
Polymerase chain reaction (PCR)
The first round of multiplex PCR was performed by adding the following to the completed RT reaction (mm unless otherwise stated): 50 KCl, 10 Tris-HCl (pH 8.3), 2.5 MgCl2, 0.25 each dNTP, 0.2 μm each upstream and downstream general primers for the nAChR subunits, GAD and VGAT, 0.1 μm of each β-actin primer, and 0.05 U μl−1 Platinum Taq polymerase (Gibco-BRL) in DEPC-treated water to a final volume of either 25 or 30 μl. Because of the potentially large number of primers added to the initial PCR, where possible, primers used in the multiplex reaction were designed to amplify more than one target sequence in order to minimize the possibilities for primer-primer binding. The following primers are listed as: sequence(s) amplified, upstream primer sequence, downstream primer sequence, size(s) of product(s) (bp): α2/α5, GTCTGGCTGAAGCAGGAATGGA, AGGGTGACGAAGATCATGGTGAA, 670/680; α3, GGAAACCCTCTGACTACCAA, CTTGAGGTTCATGGAGGAGC, 305; α4/α7, ATTGATGTGGATGAGAAGAACCA, AGCAGGAAGACGGTGAGAGAAAG, 650/644; α6, CTTCGTGTTCCAGCAGATAA, TATAAAACATGGGCAGCCTC, 409; β2, GCTGACGGCATGTACGAAG, GGAGGTGGGAGGCACAATC, 507; β3, CTCATTATCCACCTCCGTTT, CTGTATCACTCTCCTTTCCATCC, 306; β4 TGTGGGGAGAAGATGACGCT, AGAGGTTGGATGGGCTGGTG, 382; GAD 65/67, GTGATGGGATCTTTTCTCCTGG, ATGACCATGCGGAAGAAGTTG, 979; VGAT, CCTGGGGTTGTTCCTCATCA, ACTTCCTTGGTCTCGTCGGC, 669; β-actin, AAGATCCTGACCGAGCGTGG, CAGCACTGTGTTGGCATAGAGG, 327. All primers were made by Life Technologies (Gibco-BRL). The primers used in the initial round of PCR were designed to span exon-intron boundaries (to avoid amplification of genomic DNA), except VGAT, for which the exon-intron structure is not currently known. The nAChR β2 subunit primer sequences were kindly given to us by Dr Robin Lester, University of Alabama at Birmingham, USA. The PCR was held at 94°C for 30 s then cycled 25 times. Each cycle consisted of: 92°C for 15 s, 55°C for 20 s and 72°C for 30 s. Samples (2 μl) of the initial multiplex PCR were used as the substrate for each reaction in the second round of specific PCR. A 25 μl reaction was prepared for each specific sequence analysed. These reactions consisted of (mm unless otherwise stated): 50 KCl, 10 Tris-HCl (pH 8.3), 1.5–4.0 MgCl2, 0.25 each dNTP, 1.0 μm upstream and downstream specific primers, and 0.025 U μl−1 Platinum Taq polymerase in DEPC-treated water. The second round product-specific nested-PCR primers are listed as: sequence amplified, upstream primer sequence, downstream primer sequence, size of product: α2, GACCCGGCTGAGTTTGGCAA, AGCCGGCGGATCACAAAGTA, 425; α4, CCAGATGATGACAACCAACG, CCACACGGCTATGAATGCTC, 356; α5, GAGATGGAATCCTGACGATT, ATGTAGGGGTACCAGCAGCA, 396; α7, TTGCCAGTATCTCCCTCCAG, CTTCTCATTCCTTTTGCCAG, 214; GAD 65, GATTTGTTCCTTTCCTGGTG, GCCTTGTCTCCCGTGTCATA, 352; GAD 67, CAGAAGTGAAAACAAAAGGC, AAACGCTCCATAAACAGTCG, 254. Nested primers were not used for the nAChR α3, α6, β2, β3 and β4 subunits, VGAT and β-actin, since the primer pairs used for these sequences in the first round were already subunit specific. The sequence identity was too low among these sequences to construct primer pairs that efficiently amplified more than one of these sequences at a time. The same primers as those used in the initial PCR round were used in the second round for the nAChR α3, α6, β2, β3 and β4 subunits, VGAT and β-actin sequences.
Reactions were held at 92°C for 30 s, then cycled 40 times as follows: 92°C for 15 s, annealing temperature (55‐63°C) for 20 s, and 72°C for 30 s. Samples (7.0 μl) were analysed on 2 % agarose gels using ethidium bromide and photographed (Polaroid type 667 film, using a Polaroid DS34 camera with Spectroline CH-1012 photodoc camera hood, Spectronics Corp., Westbury, NY, USA) under UV illumination (Spectroline TVC-312A transilluminator, Spectronics Corp.; set at 90 % max intensity). The presence or absence of a subunit was scored by whether or not a clearly defined band of the correct size was detectable by visual observation of the photographed gel. Non-specific bands occasionally occurred when running single-cell RT-PCR, as would be expected from running multiplex PCR and a total of 65 PCR cycles. Spurious bands of the incorrect sizes were ignored, and DNA bands from some experiments were sequenced to verify subunit specificity of the RT-PCR protocol.
RT-PCR controls
Perfusion solutions were made from DEPC-treated water and vacuum filtered using 0.2 μm cellulose nitrate filters (Nalge Nunc, Rochester, NY, USA). Solutions were tested periodically to insure they had no inherent RNAse activity using the RNAse Alert system (Ambion, Austin, TX, USA). Gloves were worn during all experiments and recordings to minimize the chance of contaminating samples with RNAses.
Primers (except nAChR β2) were designed using the Vector NTI software package (Informax, Bethesda, MD, USA). PCR amplification conditions (Mg2+ concentration and annealing temperature) for each primer pair were optimized using a cDNA library created from 18-day-old rat whole-brain RNA using random hexamers to prime the RT reaction. Primer sensitivity was then tested for all sequences for which we had plasmids (the α2, α3, α4, α5, α6, α7, β2 and β4 nAChR subunits; these were kindly provided by Dr James Patrick, Baylor College of Medicine, Houston, TX, USA, and Dr James Boulter, UCLA, Los Angeles, CA, USA) by amplifying from 10:1 serial dilutions of plasmid stock. Using this procedure, the amplification limit (i.e. the lowest DNA concentration from which successful PCR amplification occurred) using the two-step PCR protocol outlined above was 100 fg plasmid DNA for α2, α3 and α7; 1.0 fg for α5; 0.1 fg for α4, β2 and β4; and 0.01 fg for α6. These limits are due to inherent properties of each specific pair of primer sequences, and were measured after careful optimization of the PCR conditions for Mg2+ concentration and annealing temperature.
Negative RT-PCR controls were performed in conjunction with each set of neurons by aspirating ACSF from the top of the slice in the recording chamber, and analysing it in parallel with the aspirated neurons for all mRNAs examined in that set. The false positive rate was calculated by taking the total number of positive PCR reactions from the negative control sets, and dividing by the total number of negative control reactions performed. A total of 212 negative control RT-PCR reactions were run, 7 of which gave positive results (6 β-actin, 1 β2 nAChR subunit). This gives an overall false positive detection rate of 3.3 % (or a proportion of 0.033) for our RT-PCR protocol.
β-Actin RT-PCR detection was used as a positive control for cell aspiration, since it is highly expressed by all neurons. Very high detection of β-actin mRNA was apparent in all three neuron types: 0.96 (75/78) for stratum radiatum, 0.97 (28/29) for stratum oriens and 0.98 (41/42) for pyramidal neurons, indicating that the rate of successful cell aspiration was comparable between neuronal populations.
Statistical analysis
The capacitance and series resistance measurements for the three populations of neurons examined were compared using a single-factor ANOVA. The nAChR peak currents, 10–90 % rise times and percentage of peak remaining for the stratum oriens and stratum radiatum interneurons were compared using a Mann-Whitney test (Howell, 1999).
For the RT-PCR analysis, the proportion of neurons expressing a particular mRNA is equal to the number of observed positive neurons divided by the total number of neurons analysed for that mRNA transcript. The standard error of the proportion (s.e.p.) was calculated for each mRNA transcript examined using the following formula (Moore, 1995):
| (1) |
where p is the proportion of neurons in the population with detectable expression, and n is the number of neurons in that population.
To test for significant expression of each mRNA when compared with the background RT-PCR calculated false positive proportion, and to compare the mRNA expression of the two populations with functional nAChR responses (see Results section), we used a z test for comparing two sample proportions. The formula is (Moore & McCabe, 1993):
| (2) |
where p^x is the proportion of cells with detected expression in each population, nx is the number of neurons examined in that population, and p^ (no subscript) is the pooled estimate of p^1 and p^2. The calculation for p^ is (Moore & McCabe, 1993):
| (3) |
Each z value was compared with a normal curve using the Excel NORMSDIST (absolute value of z) function, which gives the probability (P) that the two proportions are equal. The proportions were considered significantly different when P > 0.05.
RT-PCR detection of mRNA expression was scored as a ‘1’subunit non-detection was scored as a ‘0’, giving a binomial distribution. Pearson's correlation coefficients (r) were computed on these distributions using the Excel PEARSON function. The r values can range from +1 to −1, where +1 signifies an exact correlation and −1 signifies an exact inverse correlation. An r value of zero would be expected from a completely random association. To determine whether any of the obtained r values indicated significant correlations, we used a t test for the significance of Pearson's correlation coefficients to compute the probability that the r values were different from zero. The formula is (Hinkle et al. 1994):
| (4) |
where r is the Pearson's correlation coefficient and n is the number of paired observations. The probability for each t value obtained was computed using the Excel TDIST function with one tail. Correlations where P < 0.05 were considered statistically significant. To briefly explain how these statistics are interpreted, the more the r value differs from zero (on a scale of +1 to −1), the lower the P value will be (the probability that the real r value is actually zero), and in general, the greater difference there will be in the percentage of neurons that express both subunits compared with the percentage that express only one of them (see Table 1).
Table 1.
Significant nAChR subunit coexpression within individual neurons
| Subunit combinations A + B | Pearson's correlation coefficient (r) | P | No. of interneurons examined for both sequences (n) | Interneurons expressing A that are also expressing B (%) | Interneurons not expressing A that are expressing B (%) |
|---|---|---|---|---|---|
| Positive correlations | |||||
| α3 +α5 | 0.25 | 0.02 | 69 | 33.3 | 11.8 |
| α4 +β2 | 0.19 | 0.03 | 109 | 31.4 | 15.5 |
| α4 +β3 | 0.23 | 0.03 | 64 | 45.1 | 22.4 |
| α7 +β2 | 0.24 | 0.01 | 109 | 46.4 | 25.5 |
| β2 +β3 | 0.21 | 0.03 | 75 | 40.0 | 16.0 |
| β3 +β4 | 0.35 | < 0.01 | 87 | 48.6 | 16.0 |
| Negative correlations | |||||
| α2 +β4 | −0.27 | 0.01 | 69 | 0.0 | 27.0 |
| α4 +β4 | −0.28 | 0.01 | 64 | 0.0 | 40.0 |
Each possible pairwise grouping of nAChR subunits was analysed for the tendency of those subunits to be coexpressed within individual interneurons (using the two populations with functional nAChR responses in this study, the strata oriens and radiatum). Positive and negative correlations with a Pearson's correlation coefficient (r) that was significantly different from zero are listed, along with the calculated probability (P, see Methods), and number of neurons examined for both subunits (n). To illustrate the functional implications of the correlations found to be significant, the percentage of neurons with detectable expression of the first subunit that also had detectable expression of the second subunit is contrasted with the percentage of neurons with no detection of the first subunit that had detectable levels of the second subunit.
Each possible pairwise grouping of nAChR subunits was analysed for the tendency of those subunits to be co-expressed within individual interneurons (using the two populations with functional nAChR responses in this study, the strata oriens and radiatum). Positive and negative correlations with a Pearson's correlation coefficient (r) that was significantly different from zero are listed, along with the calculated probability (P, see Methods), and number of neurons examined for both subunits (n). To illustrate the functional implications of the correlations found to be significant, the percentage of neurons with detectable expression of the first subunit that also had detectable expression of the second subunit is contrasted with the percentage of neurons with no detection of the first subunit that had detectable levels of the second subunit.
Correlations between mRNA expression and 10–90 % nAChR rise times were computed using only the subset of neurons where both whole-cell patch-clamp recordings and single-cell RT-PCR were performed. The correlations were possible by creating two binomial distributions. The first, as described in the preceeding paragraph, was for the RT-PCR detection of subunit mRNAs. The second was created by dividing the rise time obtained for each neuron into 1 of 4 different categories (i.e. 0.00–0.90 s, 0.91–2.20 s, 2.21–4.20 s and > 4.20 s). For example, a 10–90 % rise time of 1.43 s would be scored as a ‘1’ in the ‘0.91–2.20 s’ category, and as ‘0’ in all other categories. The time intervals for the categories were determined by examining a histogram of all recorded nAChR rise times for naturally occurring break-points (see Fig. 4A). Pearson's correlation coefficients were then calculated using each subunit mRNA binomial distribution and each rise time binomial distribution. Correlation coefficients were tested as described above, using a t test of r values, to see if they were significantly different from a random association.
Figure 4. Histograms of functional nAChR kinetic property distributions.
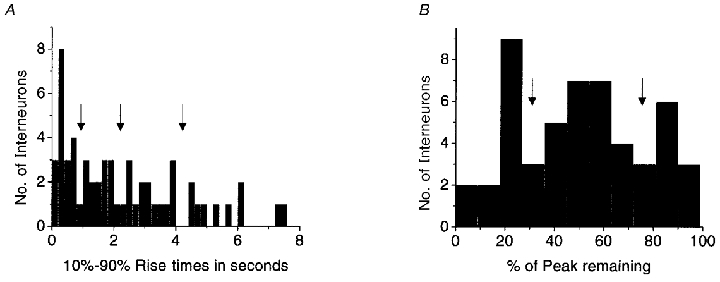
These histograms were obtained from whole-cell recordings of 58 individual interneurons (53 of which were also examined by single-cell RT-PCR for nAChR subunits) in response to the application of 100 μm ACh. A, the distribution of the 10–90 % rise times. To compute correlations with nAChR subunit expression, interneurons were divided by their rise time into one of four groups, according to break-points in the histogram (indicated by arrows): 0–0.9 s, 0.91–2.20 s, 2.21–4.20 s and > 4.21 s. B, the distribution given by plotting the percentage of the peak current remaining at the end of the 5 s ACh application from each interneuron. To compute correlations between nAChR subunit expression and desensitization kinetics, interneurons were divided into one of three groups, according to break-points in the histogram (indicated by arrows): < 32 %, 32–75 % and > 75 %.
To detect significant correlations between nAChR subunit mRNA expression and nAChR whole-cell current desensitization kinetics, another set of correlations was created. The current remaining (as the percentage of the peak) at the end of the 5 s ACh application for all recordings obtained from both interneuron populations were plotted on a histogram to identify naturally occuring break-points (see Fig. 4B). Currents that had decayed to < 32 % of the peak value were classified as rapidly desensitizing, currents that had decayed to between 32 and 75 % of the peak value were classified as moderately desensitizing, and currents that were still > 75 % of the peak value were classified as slowly desensitizing. Using these classifications three additional binomial distributions were created and possible correlations with individual nAChR subunits were analysed using the same methods described above.
RESULTS
Functional nAChRs in rat CA1 hippocampal neurons
The whole-cell patch-clamp recording technique was utilized to examine the nAChR responses in three populations of CA1 hippocampal neurons in rat brain slices: stratum oriens interneurons, stratum radiatum interneurons and stratum pyramidale principal neurons. In addition, to characterize the molecular properties of these nAChRs, we analysed the mRNA expression patterns of 276 individual neurons using the single-cell RT-PCR technique. The co-expression tendencies of nAChR subunits were examined (see Methods). Correlations between nAChR mRNA subunit expression and 10–90 % nAChR peak rise times (the time interval between 10 and 90 % of the peak response, hereafter referred to simply as rise time), and the amount of desensitization at the end of the ACh application, were computed by analysing the data from the subset of interneurons (n = 53) from which both whole-cell recordings and single-cell RT-PCR results were obtained.
Functional nAChR responses were seen in both interneuron populations examined, but not in the pyramidal cells (Fig. 1). The nAChR currents obtained from the two interneuron populations differed significantly in their activation and desensitization kinetics (Mann-Whitney test, P < 0.01); responses from stratum radiatum interneurons were (on average) more rapidly activating, more rapidly desensitizing and slightly smaller than those typically observed in stratum oriens interneurons (Fig. 1B). However, as indicated in Fig. 1B, there was some overlap between the populations (i.e. some stratum radiatum interneurons with slow responses and some stratum oriens interneurons with fast responses). The capacitance and series resistance measurements did not differ significantly between the three neuron populations examined (single-factor ANOVA, Fig. 1C).
mRNA expression detected by single-cell RT-PCR
To characterize the mRNA expression of CA1 hippocampal neurons, we investigated the expression patterns of the nAChR subunits α2, α3, α4, α5, α6, α7, β2, β3 and β4 as well as the expression of three GABAergic markers, two isoforms of the GABA-synthesizing enzyme glutamic acid decarboxylase (GAD 65 and 67) and the vesicular GABA transporter (VGAT; McIntire et al. 1997). All three GABAergic markers were detected in high proportions in both interneuron populations, while there was no significant detection in the pyramidal neurons (Fig. 2). This is in good agreement with previous characterizations showing that interneurons are GABAergic in nature and that the pyramidal neurons are not (reviewed in Freund & Buzsaki, 1996), indicating the ability of this single-cell RT-PCR protocol to distinguish between neuronal populations with known functional differences.
Figure 2. mRNA expression patterns by neuron type.
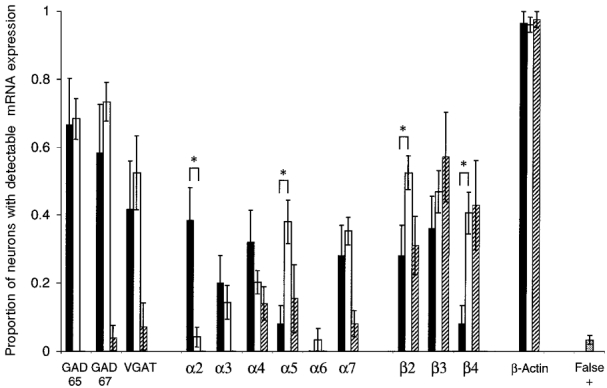
The chart depicts the overall single-cell RT-PCR detection of each mRNA examined, by neuron type. To determine statistically significant expression, the proportion of neurons with detectable expression was compared with the proportion of overall false positives (shown in far right column, see Methods for calculation of false positives). There was statistically significant expression of all messages examined (in at least one neuron type), except for the α6 nAChR subunit. Stratum oriens interneurons (filled bars) had significant expression of GAD 65, GAD 67, VGAT and the α2, α3, α4, α7, β2 and β3 nAChR subunits. Stratum radiatum interneurons (open bars) had significant expression of GAD 65, GAD 67, VGAT and the α3, α4, α5, α7, β2, β3 and β4 nAChR subunits. Pyramidal neurons (hatched bars) had significant expression of the α4, α5, β2, β3 and β4 nAChR subunits. β-Actin expression was detected in over 95 % of all three neuron types. Statistically significant differences between the two populations expressing functional nAChRs (stratum oriens and stratum radiatum) are indicated by an asterisk. All statistical comparisons utilized a z test of two proportions, with P < 0.05. When comparing the detection of different subunits (i.e. α2 in stratum oriens vs.α3 in stratum oriens) it should be kept in mind that the detection limits for the subunits are not necessarily the same. The experimentally determined detection limits are reported in the Methods, and the approximated levels of relative subunit expression for each neuron population are reported in the Results.
We detected statistically significant levels of mRNA expression for all nAChR subunits except α6, when compared with the background level of false positives, suggesting that this subunit is absent in the neuronal populations examined. The proportion of neurons expressing each particular subunit varied by neuronal type (Figs 2 and 3). A significant proportion of the stratum oriens interneurons expressed the α2, α3, α4, α7, β2 and β3 nAChR subunits, whereas a significant proportion of the stratum radiatum interneurons expressed the α3, α4, α5, α7, β2, β3 and β4 nAChR subunits. Interestingly, a relatively large proportion of pyramidal neurons expressed detectable levels of the β2, β3 and β4 nAChR subunits, with a small proportion expressing detectable levels of the α4 and α5 subunits; as noted above we did not see functional nAChRs in these neurons.
Figure 3. RT-PCR products and whole-cell patch-clamp recordings.
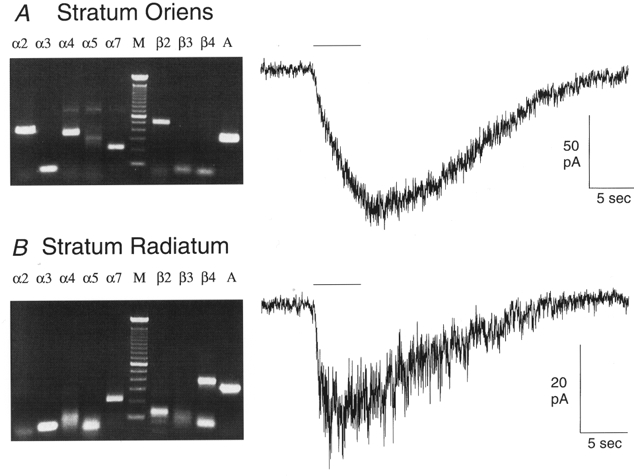
Two example agarose gels of RT-PCR products and the corresponding nAChR responses (100 μm applications of ACh for 5 s, indicated by horizontal bars) from the same interneurons. Expected RT-PCR product sizes are (in bp): α2 425, α3 305, α4 356, α5 396, α7 214, β2 507, β3 306, β4 382 and β-actin 327. The marker lane (M) shows bands at 100 bp increments. The stratum oriens interneuron (A) expressed detectable levels of the α2, α4, α7 and β2 nAChR subunits, and β-actin (A), and had a very slowly activating nAChR-mediated current. The stratum radiatum interneuron (B) expressed detectable levels of the α7 and β4 nAChR subunits, and β-actin, and had a significantly faster activating nAChR-mediated current than the stratum oriens interneuron. As these gels illustrate, non-specific bands occasionally occurred when running single-cell RT-PCR (see α4 and α5 in A, for examples), as would be expected from running multiplex PCR (in the initial round) and a total of 65 PCR cycles; spurious bands of the incorrect sizes were ignored. The subunit specificity of the PCR products from these gels was verified by direct sequencing of the DNA bands of the expected sizes after gel purification.
To determine the relative levels of nAChR subunit mRNA expressed by each neuron type, it is important to note that the detection limits are different for the various subunits (see Methods). The detection limit of the RT-PCR protocol was determined for each of the nAChR subunits examined, except for β3 (see Methods). There was a similar proportion of cells with detectable expression of β3 subunit mRNA in all three neuron populations examined, but at an unknown level in relationship to the other subunit mRNAs. When taking into account the discrepancies in subunit detection sensitivity (from least sensitive to most sensitive: i.e. α2 =α3 =α7 < α5 < α4 =β2 =β4 < α6), the relative levels of subunit mRNA expressed by the stratum oriens interneurons are α2 > α7 > α3 > α4 =β2. Using the same method, the relative levels of nAChR mRNA subunits detected in the stratum radiatum interneurons are α7 > α3 > α5 > β2 > β4 > α4. The relative levels of nAChR subunit mRNA in pyramidal neurons are approximated to be α5 > β2 =β4 > α4. This may explain why functional nAChR currents were not prevalent in this population, since it has been demonstrated that an α subunit is required for functional channels, but the α5 subunit requires the expression of other α and β subunits to form functional channels (Ramirez-Latorre et al. 1996). To analyse the levels of detection for the various nAChR subunits across neuron types (i.e. α2 in stratum oriens vs.α2 in stratum pyramidale), the proportions of detectable expression can be compared directly, since the detection limit for any individual subunit is the same irrespective of neuron type. These comparisons show that the interneurons have much higher levels of mRNA expression of various nAChR α subunits than the pyramidal neurons, which presumably leads to the disparity observed in functional nAChR ion channel expression.
Since the nAChR-mediated responses from these two interneuron populations had different functional properties (namely rise time and desensitization characteristics), we suspected that the nAChR subunit expression patterns would also be significantly different. We compared the nAChR subunit mRNA expression of the two groups using a z test for comparing two sample proportions (eqn (2) in Methods). A significantly higher proportion of the stratum oriens interneurons had detectable expression of the nAChR α2 subunit, while a significantly higher proportion of the stratum radiatum interneurons expressed the α5, β2 and β4 subunits. The detected expression of the α3, α4, α7 and β3 nAChR subunits was not significantly different between the two interneuron populations.
To gain insight into the possible subunit composition of functional nAChRs in native neurons, we looked for the significant tendency of any nAChR subunits to be co-expressed within individual interneurons. We computed Pearson's correlation coefficients (r), along with the corresponding probability (P) of each coefficient being significantly different from zero, for pairwise groupings of all nAChR subunit mRNA transcripts, utilizing single-cell RT-PCR data collected from 207 individual hippocampal stratum oriens and stratum radiatum interneurons (see Methods). The co-detection of the following subunits was greater than what would be expected from a random association (where r would be zero): α3 +α5, α4 +β2, α4 +β3, α7 +β2, β2 +β3 and β3 +β4 (see Table 1 for corresponding r, P and n values). In addition, there were significant negative correlations for α2 with β4 and α4 with β4, indicating a tendency for these subunits to not be expressed together by the same interneuron.
Correlating nAChR subunit mRNA expression with rise times and desensitization kinetics
Since the two interneuronal populations differ in their nAChR rise time and desensitization kinetics, as well as their nAChR subunit mRNA expression profiles (see Fig. 3), we looked for significant correlations between subunit mRNA expression and the observed nAChR properties. Whole-cell patch-clamp nAChR recordings, performed together with single-cell RT-PCR analysis of nAChR subunit mRNA expression, were obtained from 20 stratum oriens and 33 stratum radiatum interneurons. We divided the peak rise times for all recordings into four different groups: fast (0.00–0.90 s), medium (0.91–2.20 s), slow (2.21–4.20 s) and very slow (> 4.21 s). These divisions were based on break-points in the histogram created by plotting the various rise times of all whole-cell nAChR recordings obtained (see Fig. 4A). Pearson's correlation coefficients were computed between each nAChR subunit mRNA, and each peak rise time group (see Methods). Significant correlations were observed between α2 and a medium rise time, α3 and a fast rise time, α4 and a slow rise time, α7 and a fast rise time, and β2 and a fast rise time (see Table 2). In addition, a significant inverse correlation was detected between α3 expression and very slow rise times.
Table 2.
Correlations between nAChR subunits and 10–90% peak rise times
| Peak rise times | ||||
|---|---|---|---|---|
| NAChR subunit | Fast 0–0.90 s | Medium 0.91–2.20 s | Slow 2.21–4.20 s | Very slow Over 4.20 s |
| α2 | r =−0.16 | r = 0.29 | r =−0.23 | r = 0.15 |
| (n = 40) | P = 0.16 | *P = 0.04 | P = 0.07 | P = 0.18 |
| α3 | r = 0.28 | r = 0.14 | r =−0.12 | r =−0.29 |
| (n = 40) | *P = 0.04 | P = 0.19 | P = 0.23 | *P = 0.04 |
| α4 | r =−0.07 | r =−0.19 | r = 0.23 | r = 0.05 |
| (n = 53) | P = 0.30 | P = 0.09 | *P = 0.05 | P = 0.36 |
| α5 | r =−0.09 | r = 0.22 | r =−0.04 | r =−0.09 |
| (n = 40) | P = 0.29 | P = 0.08 | P = 0.41 | P = 0.29 |
| α7 | r = 0.25 | r =−0.21 | r = 0.01 | r =−0.08 |
| (n = 53) | *P = 0.03 | P = 0.07 | P = 0.48 | P = 0.29 |
| β2 | r = 0.27 | r =−0.25 | r =−0.03 | r = 0.01 |
| (n = 40) | *P = 0.05 | P = 0.06 | P = 0.44 | P = 0.48 |
| β3 | r =−0.14 | r =−0.02 | r = 0.05 | r = 0.11 |
| (n = 40) | P = 0.19 | P = 0.45 | P = 0.38 | P = 0.26 |
| β4 | r = 0.07 | r =−0.25 | r =−0.04 | r = 0.22 |
| (n = 40) | P = 0.34 | P = 0.06 | P = 0.41 | P = 0.08 |
The Pearson's correlation coefficients (r), calculated for the association between the singlecell mRNA expression of each nAChR subunit (except α6, for which there was no significant expression) and the 10–90% peak rise times of the nAChR-mediated currents, along with the probability values for each coefficient being statistically different from zero (P), and the number of neurons where both singlecell RT-PCR data for the particular subunit and wholecell recordings were obtained (n). Statistically significant (P < 0.05) correlations are marked with an asterisk and are shown in bold type; they include the α2 subunit with a medium rise time, the α3 subunit with a fast rise time (and an inverse correlation with a very slow rise time), the α4 subunit with a slow rise time, the α7 subunit with a fast rise time, and the β2 subunit with a fast rise time.
To examine how nAChR subunit expression may be related to the kinetics of desensitization, we looked for significant correlations in nAChR subunit mRNA expression and nAChR current decay. The nAChR currents were divided into three categories based on the percentage of the peak current remaining at the end of the 5 s ACh application (see Methods); < 32 % (rapidly desensitizing), 32–75 % (moderately desensitizing) and > 75 % (slowly desensitizing). These divisions were based on break-points in the histogram created by plotting the percentage of peak current remaining at the end of the ACh application for all whole-cell currents obtained from the two interneuron populations (see Fig. 4B). Pearson's correlation coefficients (r) and their corresponding probability values (P), were computed between the detection of each nAChR subunit and each desensitization category. Correlations that were significantly different from that expected from a random association are reported in Table 3, along with the corresponding probabilities. The α2 and α4 nAChR subunits were significantly correlated with slowly desensitizing currents, while the α2 and β3 nAChR subunits were inversely correlated with rapidly desensitizing currents. No significant positive correlations were detected between any individual subunit and either a rapidly desensitizing current or a moderately desensitizing current.
Table 3.
Correlations between nAChR subunits and nAChR desensitization
| Peak current remaining at the end of ACh application (%) | |||
|---|---|---|---|
| nAChR subunit | Rapidly desensitizing < 32% | Moderately desensitizing 32–75% | Slowly desensitizing > 75% |
| α2 | r =−0.26 | r =−0.19 | r = 0.44 |
| (n = 40) | *P = 0.05 | P = 0.12 | *P < 0.001 |
| α3 | r = 0.18 | r =−0.18 | r = 0.04 |
| (n = 40) | P = 0.14 | P = 0.14 | P = 0.39 |
| α4 | r =−0.12 | r =−0.11 | r = 0.26 |
| (n = 53) | P = 0.20 | P = 0.21 | *P = 0.03 |
| α5 | r =−0.07 | r = 0.20 | r =−0.16 |
| (n = 40) | P = 0.35 | P = 0.11 | P = 0.13 |
| α7 | r = 0.13 | r =−0.15 | r =−0.04 |
| (n = 53) | P = 0.17 | P = 0.14 | P = 0.40 |
| β2 | r =−0.08 | r = 0.05 | r = 0.01 |
| (n = 40) | P = 0.31 | P = 0.37 | P = 0.47 |
| β3 | r =−0.37 | r = 0.10 | r = 0.21 |
| (n = 40) | *P = 0.01 | P = 0.26 | P = 0.07 |
| β4 | r =−0.07 | r = 0.20 | r =−0.16 |
| (n = 40) | P = 0.35 | P = 0.11 | P = 0.13 |
The Pearson's correlation coefficients (r), calculated for the association between the singlecell mRNA expression of each nAChR subunit (except α6, for which there was no significant expression) and the percentage of the peak current remaining at the end of the 5 s application of ACh, along with the probability values for each coefficient being statistically different from zero (P), and the number of neurons where both singlecell RTPCR data for the particular subunit and wholecell recordings were obtained (n). Statistically significant (P < 0.05) correlations are marked with an asterisk and are shown in bold type; they include the α2 and the α4 subunits with slowly desensitizing responses, and the significant inverse correlations between the α2 and β3 subunits and rapidly desensitizing nAChR responses. The values computed are included for all subunits to illustrate trends that are apparent, but do not reach the significance level of P < 0.05; e.g. the α5 subunit is correlated with moderately desensitizing responses with P = 0.11. This may indicate the presence of multiple receptor types, with the slowerdesensitizing populations slightly masking the more rapidly desensitizing populations.
DISCUSSION
Neuronal nAChR subunits are widely expressed throughout the brain, and are believed to participate in a variety of physiological and pathological processes; however, the precise cellular roles of these ion channels in these processes remain largely undetermined (see review by Jones et al. 1999). Our aim in performing this study was to better characterize the functional and molecular properties of nAChRs in the CA1 region of the hippocampus, a structure in the brain historically linked to cognition (Scoville & Milner, 1957). While pyramidal neurons in the CA1 region are thought to be very homogeneous in both geometry and function, the interneurons in the strata oriens and radiatum are extremely diverse (see Freund & Buzsaki, 1996). In fact, Parra et al. (1998) have demonstrated that at least 16 distinct morphological classes of CA1 interneurons exist. Taking this into account, it may be surprising that the nAChR currents observed from stratum radiatum and stratum oriens interneurons showed any generalized tendencies at all. However, we found that stratum radiatum interneurons possessed mostly rapidly activating and rapidly desensitizing nAChR-mediated responses, and expressed detectable levels of the α4, α5, α7 and β2–4 nAChR subunits in > 20 % of interneurons, whereas stratum oriens interneurons possessed mostly slowly activating and slowly desensitizing responses, and expressed detectable levels of the α2, α4, α7, β2 and β3 subunits. These data are consistent with the presence of both α7 and non-α7 nAChRs in hippocampal interneurons, as has been suggested by pharmacological analysis (Alkondon et al. 1997; Jones & Yakel, 1997; McQuiston & Madison, 1999).
There are many possible reasons that could explain the kinetic differences observed in the nAChR responses between these two interneuron populations, e.g. differences in receptor distribution along the cell surface, access of agonist to the cell surface in the hippocampal slice or nAChR subunit composition. Labelling studies for nAChRs in the hippocampus, utilizing either antibodies (Hill et al. 1993) or radioactively labelled agonist (Freedman et al. 1993), have both reported rather uniform labelling of interneuron cell bodies and dendrites in the strata radiatum and oriens, providing no direct evidence that differences in receptor localization play a major role in the observed kinetic differences between these two layers. Also, at the level of resolution provided by the DIC optics used in this study, we find no evidence for any differences in hippocampal slices that would suggest a disparity in the access of ACh to nAChRs on the cell soma between the strata oriens and radiatum interneurons. Distinct kinetic differences in nAChR responses from cultured neurons have been well documented in a system where ligand application is more uniform (Zorumski et al. 1992; Albuquerque et al. 1995). McQuiston & Madison (1999) and Ji & Dani (2000) have reported kinetic differences − similar to those seen in our report using widespread application of agonist − in the nAChRs from CA1 hippocampal stratum oriens and stratum radiatum interneurons using localized application of agonist, demonstrating that the differences are not likely to be simply due to receptor localization. We also report a significant difference in the nAChR subunit mRNA expression profiles between the two layers, and it is well documented that subunit composition affects receptor kinetics (see Boyd, 1997 and McGehee, 1999, for reviews). These observations all imply that the kinetic diversity apparent in nAChRs from different layers in hippocampal slices come from nAChR subtypes that differ in their subunit composition.
It has been demonstrated previously using pharmacological techniques that the α7 subunit plays a role in the rapidly activating and desensitizing currents in these interneurons (Jones & Yakel, 1997; Alkondon et al. 1998; Frazier et al. 1998b; McQuiston & Madison, 1999), but the incomplete block by α7-specific antagonists suggests that there is also a class of non-α7-containing receptors. In our analysis using single-cell nAChR subunit mRNA expression and whole-cell electrophysiology, we have attempted to determine which other subunits are involved in forming nAChRs in these two populations. Since pharmacological methods are not currently available to elucidate the subunit-specific roles for most of the other nAChR subunits, we looked for statistical correlations between subunit mRNA expression and receptor function. As with any analytical method, there are some caveats involved in the use of this technique. First of all, mRNA expression is not always directly related to functional protein expression. For this reason we have included both an assay for mRNA expression and an assay of protein function (whole-cell recording) from the same individual cells, and looked for functional properties that were associated with the expression of any particular subunit a significant amount of the time. This analysis has provided several statistically significant correlations, the validity of which will need to be tested in future experiments. The interpretation of these correlations should be tempered by the fact that statistical correlations are not always causative in nature. For example, in a mixed receptor population, a subunit forming one type of channel (i.e. one with fast kinetics) might become significantly correlated with the kinetics of another type of channel (i.e. slow kinetics), if both channel types were co-expressed in a large proportion of the population. With this in mind, the significant co-expression of two subunits (Table 1) could have more than one interpretation. The two subunits could be co-assembling into one receptor subtype, or they could be involved in two separate receptor subtypes that are co-expressed in a significant number of cells. In either case, the two subunits demonstrate a tendency to be expressed in the same hippocampal interneuron more often than randomly expected.
In support of this method of analysis, the correlations we have identified in actual neurons between the expression of the α7 subunit and fast activating responses and the α4 subunit with slower responses are consistent with the previously reported functional properties of nAChRs containing these subunits in heterologous expression systems (Boulter et al. 1987; Couturier et al. 1990). Additionally, we have demonstrated the ability of this technique to differentiate between neuronal populations based on different functional properties using the detection of GABAergic markers in interneurons and the lack of their detection in pyramidal neurons. Both of these findings support the validity of our approach.
Another point should be kept in mind when comparing the subunit mRNA detection data obtained from single-cell RT-PCR analysis. As detailed in the Results section, the most accurate comparison of subunit mRNA expression levels is to compare the detection of a single subunit across neuron types (e.g. α5 in stratum oriens interneurons vs.α5 in stratum radiatum interneurons), since the detection limit for that mRNA does not change with the population examined (assuming similar cell sizes, which is demonstrated by similar capacitance measurements, see Fig. 1C). When comparing the levels of mRNA detected between two different subunits (e.g. α2 in stratum oriens interneurons vs.α3 in stratum oriens interneurons), it is important to realize that the detection limit for different subunits is not necessarily the same. In this case, the detection limit of each individual subunit will play a role in what proportion of neurons has detectable expression. The experimentally determined detection limits of our RT-PCR protocol are reported in the Methods section for all of the nAChR subunits we analysed except β3 (see Methods).
In addition to the previously mentioned kinetic correlations of α7 and α4 subunits with fast and slow activation kinetics, our analysis also uncovered novel correlations between the α2, α3 and β2 nAChR subunits and various nAChR peak rise times. We found that the α2 and α4 nAChR subunits were correlated with medium and slowly activating nAChR responses, respectively. These α subunits, certainly in combination with one or more β subunits, may be major contributors to the slower-activating non-α7 types of nAChRs in stratum oriens and stratum radiatum interneurons. Even though there is detectable expression of the α3 and α4 subunits in the stratum oriens interneurons (see Fig. 2), α2 is probably the major functional contributor to the slow nAChR response in these neurons, since it was shown by McQuiston & Madison (1999) to have no sensitivity to α-CTX MII (a blocker of α3-containing nAChRs) and relatively low sensitivity to dihydro-β-erythroidine (which blocks α4 and various other subunit-containing nAChRs). This pharmacological analysis, together with our data showing a high level of α2 detection in the stratum oriens (see also Wada et al. 1989) and the functional correlation of α2 with nAChR responses with medium rise times and slow desensitization kinetics, all provide evidence that the α2 subunit is a major component in forming functional nAChRs in stratum oriens interneurons.
Within the stratum radiatum, we found that a significant proportion of interneurons express the α5, β3 and β4 nAChR subunits as well as the α4, α7 and β2 subunits. While the functional implications of β3 and β4 subunit mRNA expression are currently unclear, recent work has shown that the α5 subunit can form channels both in native (chick sympathetic neurons) and in heterologously expressed receptors together with both the α4 and β2 subunits (Ramirez-Latorre et al. 1996; Yu & Role, 1998b; Girod et al. 1999). The inclusion of the α5 subunit alters the functional properties of the resulting nAChRs, most notably with a significantly larger single channel conductance value (Ramirez-Latorre et al. 1996). Interestingly, in the accompanying paper, Shao & Yakel (2000) show that the activation of nAChRs in outside-out patches from rat CA1 stratum radiatum interneurons in hippocampal slices induces the opening of two distinct channels with conductance levels of 38 and 62 pS. The 38 pS channel contains the α7 subunit since it was sensitive to block by methyllycaconitine, whereas the 62 pS channel was not. The large size of this non-α7 subunit conductance level is consistent with the inclusion of the α5 subunit in these channels. Recently it has been reported that the α5 nAChR subunit is significantly co-expressed with α4 and β2 by a specific sub-population of interneurons in the neocortex (Porter et al. 1999), and these three subunits have been co-immunoprecipitated from chick brain (Conroy & Berg, 1998), indicating that this nAChR subtype may also be found in neurons from other areas of the brain.
We found the α7 and β2 subunits were significantly co-expressed within individual interneurons and were both significantly correlated with fast rise time kinetics. While it had been thought that α7 subunits only form homomeric receptors (reviewed in McGehee & Role, 1995), it has been recently demonstrated that α7-containing heteromeric nAChRs can be formed in heterologous systems (Palma et al. 1999), and it appears that such heteromeric α7-containing receptors might even occur in vivo, since it has been shown that heterologously expressed α7 homomeric channels do not match all of the properties of native α7 nAChRs (Anand et al. 1993; Yu & Role, 1998a; also see Girod et al. 1999). Thus, our data suggest the possibility that α7β2-containing receptors may be a component of the rapidly activating nAChR-mediated responses common in stratum radiatum interneurons.
Pyramidal neurons in hippocampal slices have usually been reported as having either no, or occasionally very small, nAChR responses (Alkondon et al. 1997; Jones & Yakel, 1997; Frazier et al. 1998a, b,McQuiston & Madison, 1999). However, Hefft et al. (1999) reported finding evoked nAChR responses in hippocampal pyramidal neurons in cultured slices, and in some acutely prepared slices as well. It is well known that neurons in hippocampal cultures (presumably mostly pyramidal neurons) express functional nAChRs (Zorumski et al. 1992; Alkondon & Albuquerque, 1993). Perhaps the expression of functional nAChRs in the hippocampus is regulated, either developmentally or via some other mechanism, such that functional nAChRs may be observed in pyramidal neurons under certain conditions. However, our lack of observing functional nAChR responses in pyramidal neurons under our slice preparation conditions is consistent with the RT-PCR expression data reported here, where there was only very limited detection of any α nAChR subunits (which may contain the ACh binding site) in pyramidal cells.
In summary, we have demonstrated that the CA1 hippocampal interneurons from the stratum oriens and the stratum radiatum differ significantly in their overall nAChR kinetics and in their nAChR subunit mRNA expression patterns. Furthermore, we have demonstrated that significant correlations exist between functional nAChR properties (10–90 % rise times and desensitization kinetics) and individual nAChR subunit expression. These findings may help to elucidate the molecular composition of functional nAChRs in native hippocampal interneurons. This information would increase our understanding of how nAChRs may be involved in such pathological conditions as Alzheimer's disease, certain forms of epilepsy and schizophrenia, and how nAChRs may be specifically modulated for beneficial outcome in the therapeutic treatment of these conditions.
Acknowledgments
This work was funded by the NIEHS Intramural program. We thank D. Armstrong, S. Kriegler and D. Pettit for their advice in preparing the manuscript. We also thank J. Patrick and J. Boulter for generously providing nAChR subunit plasmids, R. Lester for sharing the nAChR β2 subunit PCR primer sequences, and R. Sudweeks for his insights concerning the statistical procedures.
References
- Albuquerque EX, Pereira EFR, Castro NG, Alkondon M, Reinhardt S, Schroder H, Maelicke A. Nicotinic receptor function in the mammalian central nervous system. Annals of the New York Academy of Sciences. 1995;757:48–72. doi: 10.1111/j.1749-6632.1995.tb17464.x. [DOI] [PubMed] [Google Scholar]
- Alkondon M, Albuquerque EX. Diversity of nicotinic acetylcholine receptors in rat hippocampal neurons. I. Pharmacological and functional evidence for distinct structural subtypes. Journal of Pharmacology and Experimental Therapeutics. 1993;265:1455–1473. [PubMed] [Google Scholar]
- Alkondon M, Pereira EFR, Albuquerque EX. α-Bungarotoxin- and methyllcaconitine-sensitive nicotinic receptors mediate fast synaptic transmission in interneurons of rat hippocampal slices. Brain Research. 1998;810:257–263. doi: 10.1016/s0006-8993(98)00880-4. [DOI] [PubMed] [Google Scholar]
- Alkondon M, Pereira EFR, Barbosa CT, Albuquerque EX. Neuronal nicotinic acetylcholine receptor activation modulates γ-aminobutyric acid release from CA1 neurons of rat hippocampal slices. Journal of Pharmacology and Experimental Therapeutics. 1997;283:1396–1411. [PubMed] [Google Scholar]
- Anand R, Peng X, Lindstrom J. Homomeric and native α7 acetylcholine receptors exhibit remarkably similar but non-identical pharmacological properties, suggesting that the native receptor is a heteromeric protein complex. FEBS Letters. 1993;327:241–246. doi: 10.1016/0014-5793(93)80177-v. [DOI] [PubMed] [Google Scholar]
- Boulter J, Connolly J, Deneris E, Goldman D, Heinemann S, Patrick J. Functional expression of two neuronal nicotinic acetylcholine receptors from cDNA clones identifies a gene family. Proceedings of the National Academy of Sciences of the USA. 1987;84:7763–7767. doi: 10.1073/pnas.84.21.7763. [DOI] [PMC free article] [PubMed] [Google Scholar]
- Boyd RT. The molecular biology of neuronal nicotinic acetylcholine receptors. Critical Reviews in Toxicology. 1997;27:299–318. doi: 10.3109/10408449709089897. [DOI] [PubMed] [Google Scholar]
- Changeux JP, Bertrand D, Corringer PJ, Dehaene S, Edelstein S, Lena C, Le Novere N, Marubio L, Picciotto M, Zoli M. Brain nicotinic receptors: structure and regulation, role in learning and reinforcement. Brain Research Reviews. 1998;26:198–216. doi: 10.1016/s0165-0173(97)00040-4. [DOI] [PubMed] [Google Scholar]
- Conroy WG, Berg DK. Nicotinic receptor subtypes in the developing chick brain: appearance of a species containing the α4, β2, and α5 gene products. Molecular Pharmacology. 1998;53:392–401. doi: 10.1124/mol.53.3.392. [DOI] [PubMed] [Google Scholar]
- Couturier S, Bertrand D, Matter JM, Hernandez MC, Bertrand S, Millar N, Valera S, Barkas T, Ballivet M. A neuronal nicotinic acetylcholine receptor subunit (α7) is developmentally regulated and forms a homo-oligomeric channel blocked by α-BTX. Neuron. 1990;5:847–856. doi: 10.1016/0896-6273(90)90344-f. [DOI] [PubMed] [Google Scholar]
- Eberwine J, Yeh H, Miyashiro K, Cao Y, Nair S, Finnell R, Zettel M, Coleman P. Analysis of gene expression in single live neurons. Proceedings of the National Academy of Sciences of the USA. 1992;89:3010–3014. doi: 10.1073/pnas.89.7.3010. [DOI] [PMC free article] [PubMed] [Google Scholar]
- Frazier CJ, Buhler AV, Weiner JL, Dunwiddie TV. Synaptic potentials mediated via α-bungarotoxin-sensitive nicotinic acetylcholine receptors in rat hippocampal interneurons. Journal of Neuroscience. 1998a;18:8228–8235. doi: 10.1523/JNEUROSCI.18-20-08228.1998. [DOI] [PMC free article] [PubMed] [Google Scholar]
- Frazier CJ, Rollins YD, Breese CR, Leonard S, Freedman R, Dunwiddie TV. Acetylcholine activates an α-bungarotoxin-sensitive nicotinic current in rat hippocampal interneurons, but not pyramidal cells. Journal of Neuroscience. 1998b;18:1187–1195. doi: 10.1523/JNEUROSCI.18-04-01187.1998. [DOI] [PMC free article] [PubMed] [Google Scholar]
- Freedman R, Coon H, Myles-Worsley M, Orr-Urtreger A, Olincy A, Davis A, Polymeropoulos M, Holik J, Hopkins J, Hoff M, Rosenthal J, Waldo MC, Reimherr F, Wender P, Yaw J, Young DA, Breese CR, Adams C, Patterson D, Adler LE, Kruglyak L, Leonard S, Byerley W. Linkage of a neurophysiological deficit in schizophrenia to a chromosome 15 locus. Proceedings of the National Academy of Sciences of the USA. 1997;94:587–592. doi: 10.1073/pnas.94.2.587. [DOI] [PMC free article] [PubMed] [Google Scholar]
- Freedman R, Wetmore C, Stromberg I, Leonard S, Olson L. Alpha-bungarotoxin binding to hippocampal interneurons: immunocytochemical characterization and effects on growth factor expression. Journal of Neuroscience. 1993;13:1965–1975. doi: 10.1523/JNEUROSCI.13-05-01965.1993. [DOI] [PMC free article] [PubMed] [Google Scholar]
- Freund TF, Buzsaki G. Interneurons of the hippocampus. Hippocampus. 1996;6:347–470. doi: 10.1002/(SICI)1098-1063(1996)6:4<347::AID-HIPO1>3.0.CO;2-I. [DOI] [PubMed] [Google Scholar]
- Frotscher M, Leranth C. Cholinergic innervation of the rat hippocampus as revealed by choline acetyltransferase immunocytochemistry: a combined light and electron microscopic study. Journal of Comparative Neurology. 1985;239:237–246. doi: 10.1002/cne.902390210. [DOI] [PubMed] [Google Scholar]
- Girod R, Crabtree G, Ernstrom G, Ramirez-Latorre J, McGehee D, Turner J, Role L. Heteromeric complexes of α5 and/or α7 subunits – effects of calcium and potential role in nicotine-induced presynaptic facilitation. Annals of the New York Academy of Sciences. 1999;868:578–590. doi: 10.1111/j.1749-6632.1999.tb11331.x. [DOI] [PubMed] [Google Scholar]
- Hefft S, Hulo S, Bertrand D, Muller D. Synaptic transmission at nicotinic acetylcholine receptors in rat hippocampal organotypic cultures and slices. The Journal of Physiology. 1999;515:769–776. doi: 10.1111/j.1469-7793.1999.769ab.x. [DOI] [PMC free article] [PubMed] [Google Scholar]
- Hill JA, Jr, Zoli M, Bourgeois J P, Changeux J P. Immunocytochemical localization of a neuronal nicotinic receptor: the β2-subunit. Journal of Neuroscience. 1993;13:1551–1568. doi: 10.1523/JNEUROSCI.13-04-01551.1993. [DOI] [PMC free article] [PubMed] [Google Scholar]
- Hinkle DE, Wiersma W, Jurs SG. Applied Statistics for the Behavioral Sciences. Boston, MA, USA: Houghton-Mifflin; 1994. pp. 213–215. [Google Scholar]
- Howell DC. Fundamental Statistics for the Behavioral Sciences. 4. Pacific Grove, CA, USA: Duxbury Press; 1999. pp. 395–401. [Google Scholar]
- Ji D, Dani J. Inhibition and disinhibition of pyramidal neurons by activation of nicotinic receptors on hippocampal interneurons. Journal of Neurophysiology. 2000;83:2682–2690. doi: 10.1152/jn.2000.83.5.2682. [DOI] [PubMed] [Google Scholar]
- Jonas P, Racca C, Sakmann B, Seeburg PH, Monyer H. Differences in Ca2+ permeability of AMPA-type glutamate receptor channels in neocortical neurons caused by differential GluR-B subunit expression. Neuron. 1994;12:1281–1289. doi: 10.1016/0896-6273(94)90444-8. [DOI] [PubMed] [Google Scholar]
- Jones S, Sudweeks S, Yakel JL. Nicotinic receptors in the brain: correlating physiology with function. Trends in Neurosciences. 1999;22:555–561. doi: 10.1016/s0166-2236(99)01471-x. [DOI] [PubMed] [Google Scholar]
- Jones S, Yakel JL. Functional nicotinic ACh receptors on interneurones in the rat hippocampus. The Journal of Physiology. 1997;504:603–610. doi: 10.1111/j.1469-7793.1997.603bd.x. [DOI] [PMC free article] [PubMed] [Google Scholar]
- Lambolez B, Audinat E, Bochet P, Crepel F, Rossier J. AMPA receptor subunits expressed by single Purkinje cells. Neuron. 1992;9:247–258. doi: 10.1016/0896-6273(92)90164-9. [DOI] [PubMed] [Google Scholar]
- Levin ED. Nicotinic systems and cognitive function. Psychopharmacology. 1992;108:417–431. doi: 10.1007/BF02247415. [DOI] [PubMed] [Google Scholar]
- McFarland BJ, Seidler FJ, Slotkin TA. Inhibition of DNA synthesis in neonatal rat brain regions caused by acute nicotine administration. Developmental Brain Research. 1991;58:223–229. doi: 10.1016/0165-3806(91)90008-7. [DOI] [PubMed] [Google Scholar]
- McGehee DS. Molecular diversity of neuronal nicotinic acetylcholine receptors. Annals of the New York Academy of Sciences. 1999;868:565–577. doi: 10.1111/j.1749-6632.1999.tb11330.x. [DOI] [PubMed] [Google Scholar]
- McGehee DS, Role LW. Physiological diversity of nicotinic acetylcholine-receptors expressed by vertebrate neurons. Annual Review of Physiology. 1995;57:521–546. doi: 10.1146/annurev.ph.57.030195.002513. [DOI] [PubMed] [Google Scholar]
- McIntire SL, Reimer RJ, Schuske K, Edwards RH, Jorgensen EM. Identification and characterization of the vesicular GABA transporter. Nature. 1997;389:870–876. doi: 10.1038/39908. [DOI] [PubMed] [Google Scholar]
- McQuiston AR, Madison DV. Nicotinic receptor activation excites distinct subtypes of interneurons in the rat hippocampus. Journal of Neuroscience. 1999;19:2887–2896. doi: 10.1523/JNEUROSCI.19-08-02887.1999. [DOI] [PMC free article] [PubMed] [Google Scholar]
- Matthews DA, Salvaterra PM, Crawford GD, Houser CR, Vaughn JE. An immunocytochemical study of choline acetyltransferase-containing neurons and axon terminals in normal and partially deafferented hippocampal formation. Brain Research. 1987;402:30–43. doi: 10.1016/0006-8993(87)91044-4. [DOI] [PubMed] [Google Scholar]
- Moore DS. The Basic Practice of Statistics. New York: WH Freeman Press; 1995. pp. 487–509. [Google Scholar]
- Moore DS, McCabe GP. Introduction to the Practice of Statistics. 2. New York: WH Freeman Press; 1993. pp. 590–596. [Google Scholar]
- Palma E, Maggi L, Barabino B, Eusebi F, Ballivet M. Nicotinic acetylcholine receptors assembled from the alpha7 and β3 subunits. Journal of Biological Chemistry. 1999;274:18335–18340. doi: 10.1074/jbc.274.26.18335. [DOI] [PubMed] [Google Scholar]
- Parra P, Gulyas AI, Miles R. How many subtypes of inhibitory cells in the hippocampus? Neuron. 1998;20:983–993. doi: 10.1016/s0896-6273(00)80479-1. [DOI] [PubMed] [Google Scholar]
- Perry EK, Morris CM, Court JA, Cheng A, Fairbairn AF, McKeith IG, Irving D, Brown A, Perry R H. Alteration in nicotine binding sites in Parkinson's disease, Lewy body dementia and Alzheimer's disease: possible index of early neuropathology. Neuroscience. 1995;64:385–395. doi: 10.1016/0306-4522(94)00410-7. [DOI] [PubMed] [Google Scholar]
- Pontieri FE, Tanda G, Orzi F, Di Chiara G. Effects of nicotine on the nucleus accumbens and similarity to those of addictive drugs. Nature. 1996;382:255–257. doi: 10.1038/382255a0. [DOI] [PubMed] [Google Scholar]
- Porter JT, Cauli B, Tsuzuki K, Lambolez B, Rossier J, Audinat E. Selective excitation of subtypes of neocortical interneurons by nicotinic receptors. Journal of Neuroscience. 1999;19:5228–5235. doi: 10.1523/JNEUROSCI.19-13-05228.1999. [DOI] [PMC free article] [PubMed] [Google Scholar]
- Ramirez-Latorre J, Yu CR, Qu X, Perin F, Karlin A, Role L. Functional contributions of α5 subunit to neuronal acetylcholine receptor channels. Nature. 1996;380:347–351. doi: 10.1038/380347a0. [DOI] [PubMed] [Google Scholar]
- Scoville WB, Milner B. Loss of recent memory after bilateral hippocampal lesions. Journal of Neurology, Neurosurgery and Psychiatry. 1957;20:11–21. doi: 10.1136/jnnp.20.1.11. [DOI] [PMC free article] [PubMed] [Google Scholar]
- Shao ZY, Yakel JL. Single channel properties of neuronal nicotinic ACh receptors in stratum radiatum interneurons of rat hippocampal slices. The Journal of Physiology. 2000;527:507–513. doi: 10.1111/j.1469-7793.2000.00507.x. [DOI] [PMC free article] [PubMed] [Google Scholar]
- Steinlein OK, Mulley JC, Propping P, Wallace RH, Phillips HA, Sutherland GR, Scheffer IE, Berkovic SF. A missense mutation in the neuronal nicotinic acetylcholine receptor α-4 subunit is associated with autosomal dominant nocturnal frontal lobe epilepsy. Nature Genetics. 1995;11:201–203. doi: 10.1038/ng1095-201. [DOI] [PubMed] [Google Scholar]
- Wada E, Wada K, Boulter J, Deneris E, Heinemann S, Patrick J, Swanson LW. Distribution of α2, α3, α4, and β2 neuronal nicotinic receptor subunit mRNAs in the central nervous system: a hybridization histochemical study in the rat. Journal of Comparative Neurology. 1989;284:314–335. doi: 10.1002/cne.902840212. [DOI] [PubMed] [Google Scholar]
- Yu CR, Role LW. Functional contribution of the α7 subunit to multiple subtypes of nicotinic receptors in embryonic chick sympathetic neurones. The Journal of Physiology. 1998a;509:651–665. doi: 10.1111/j.1469-7793.1998.651bm.x. [DOI] [PMC free article] [PubMed] [Google Scholar]
- Yu CR, Role LW. Functional contribution of the α5 subunit to neuronal nicotinic channels expressed by chick sympathetic ganglion neurones. The Journal of Physiology. 1998b;509:667–681. doi: 10.1111/j.1469-7793.1998.667bm.x. [DOI] [PMC free article] [PubMed] [Google Scholar]
- Zorumski CF, Thio LL, Isenberg KE, Clifford DB. Nicotinic acetylcholine currents in cultured postnatal rat hippocampal neurons. Molecular Pharmacology. 1992;41:931–936. [PubMed] [Google Scholar]