Abstract
The epidemiology of bovine gastrointestinal nematodes was investigated through a 1-year (October 1999 to September 2000) longitudinal study in 38 Canadian dairy herds from 4 different provinces (Prince Edward Island, Quebec, Ontario, Saskatchewan). For each herd, fecal egg counts from 8 randomly selected animals were performed on a monthly or quarterly basis. Larval cultures were performed once, to determine the species breakdown of the parasites. All producers were interviewed regarding herd management practices. The observed fecal egg counts were low in this study, with a range from 0 to 419 nematode eggs per 5 g of feces. The mean count was 9.8 and the median was 1. Standard transformations failed to normalize the data, which followed an over-dispersed Poisson distribution. A zero inflated negative binomial model was applied to assess factors that would influence the fecal egg counts. Identified associations were: egg counts were lowest in the winter and highest in the late spring; first-lactation cattle had higher counts than older cows; if manure was spread mechanically on pastures used by lactating cattle the egg counts were higher; and if manure was spread on heifer-pastures, the adult cows had lower counts. In herds where pasture use was more extensive, the cattle had higher fecal egg counts. The difference in pasture exposure was found to be a main contributor to an observed difference in fecal egg counts among herds in the 4 provinces.
Introduction
Gastrointestinal nematodes in young cattle can have detrimental effects on how well the animals grow and thrive during their first grazing season. Ostertagia ostertagi is the most economically important helminth parasite in pastured cattle from temperate zones, but various Cooperia spp. are also commonly seen (1,2). Young animals in their first grazing season may commonly display clinical signs of parasitism following exposure to contaminated pastures. Adult cows will harbour worms, but rarely show clinical signs of infection. There is, however, evidence of a subclinical effect of gastrointestinal nematodes in cows, because production has been reported to increase when the worms were eliminated (3). In a clinical trial performed in conjunction with the current study, the estimated average increase in milk production following treatment with eprinomectin pour-on solution at calving was 0.94 kg (4). In a recent abattoir study performed in the Netherlands, 96% of 125 adult dairy cows were found to have worms present in their abomasa, and previous studies in North America and Western Europe have found proportions between 84% and 100% (5,6,7).
In order to formulate a rational plan for the control of parasitism in cattle both the actual prevalence of the parasites and factors that influence them, need to be determined. These factors include climatic conditions, herd and pasture management, types of diagnostic tests for parasitism, characteristics of the individual animal, and the parasite species present.
The gold standard for detection of bovine gastrointestinal nematodes is worm counts at necropsy, which is currently also the only way to detect hypobiotic larva (8). Larval cultures enable the parasite species to be identified, but are time consuming and hence not suitable for large-scale studies. The use of fecal egg counts (FEC) for individual adult cattle has been considered to be of limited value as a diagnostic tool, due to the lack of correlation with the adult worm counts observed at necropsy and the clinical signs of parasitism (9,10,11). However, a series of repeated FECs from a number of animals may offer information on population dynamics at a group or herd level (12,13). For this reason, FECs were used in the current study.
Fecal egg count data does not usually follow a normal distribution because of their wide range and many zero counts. Various standard transformations, the log-transformation in particular, along with non-parametric tests, are often used in the analysis of these data. Even though the Poisson model can be considered the standard way of describing count data, it is rarely adequate for FEC data since it assumes the mean and the variance to be approximately the same (14). Applying a negative binomial error distribution in generalized linear models has been suggested as a better way of dealing with the lack of normality in parasite data (15). One important benefit of this methodology is that it accounts for the dependence between observations that arises from the clustering of animals within farms, or from repeated samples being taken from the same animal over time (16). The negative binomial error distribution is a modification of the Poisson distribution for count data that allows for extra-Poisson variation.
While the negative binomial model takes over-dispersion into account, it may not adequately deal with the high number of zero counts present in FEC data from mature cows. Zero-inflated negative binomial (ZINB) models are negative binomial models that allow for additional over-dispersion via a splitting process that models the probability of a zero outcome by logistic regression, while the continuous count outcome is modelled using a negative binomial error structure (14). It is assumed that different underlying mechanisms can be involved in generating zero and non-zero counts. A negative binomial process generates both zero and positive counts, and in addition, zero counts can arise separately through a logistic process. The Vuong statistic (14,17) is applied to assess the usefulness of a zero-inflated versus a regular negative binomial model, with a high positive value favouring the zero-inflated version. Applied to parasite data, zero inflated negative binomial models might offer a useful way of dealing both with the high number of zero observations and with the extra-Poisson variation present among the non-zero counts.
The objective of this study was to compare the level of parasitism in Canadian dairy cattle as measured by FECs across different regions, seasons, and age groups. A second, and broader objective was to assess the usefulness of a zero inflated negative binomial regression model in the evaluation of various risk factors for gastrointestinal parasitism as measured by FECs.
Materials and methods
Test animals
Eight Holstein cows from each of 38 dairy farms in Canada were monitored for 1 y from October 1999 to September 2000. The farms were located in 4 different regions of Canada from Prince Edward Island (PEI) on the east coast (n = 14), moving west through St. Hyacinthe in Quebec (n = 14) and Guelph, Ontario (n = 5), to Saskatoon, Saskatchewan (n = 5). Herds in PEI and Quebec were also part of a clinical trial evaluating the effect of treating cows with eprinomectin pour-on solution (Ivomec Eprinex; Merial Canada, Baie D'urfé, Quebec) at the time of calving (4). Selection of participating herds was a convenience sample, based on proximity to the 4 Canadian veterinary colleges and expected compliance from the producer. All herds had some exposure to pasture, and had not used broad-spectrum endectocides in the milking cows in the 6 mo prior to the onset of the trial.
Fecal egg counts were performed on samples collected rectally from the 8 cows randomly selected within 2 strata at each farm: 1st lactation, and 2nd lactation or older animals. The animals were chosen from herd records during the initial visit at each farm using a random numbers table. Fecal sampling was done either by the researchers, the farm service veterinarians, or by the technicians during regular herd health visits. During the initial visit in the fall of 1999, fecal samples from 15 additional animals on each farm were collected for larval culturing. The most recently calved primiparous (n = 5) and multiparous (n = 5) animals were chosen, in addition to 5 randomly selected nulliparous heifers. In some cases the heifers were still on pasture and unavailable at the time of sampling; these animals were sampled at a later visit.
Information on the use of pasture and other management factors was collected using a standard in-person interview questionnaire at all participating farms. Fecal egg count data, from cows that were treated with the endectocide as part of the clinical trial, were included only until the last sampling date before such treatment. Data from untreated cows and cows treated with placebo were kept for all analyses.
Fecal examinations
Fecal egg counts (FEC) — Fecal samples were collected per rectum, stored at 4°C and analyzed within 1 to 7 days (mean = 4 d), at each of the 4 study sites. The number of nematode eggs per 5 g of feces was determined for individual cows using a modified Wisconsin sugar flotation technique (9). The animals from PEI were sampled monthly through the entire duration of the study. Herds in Quebec were sampled every month for the first 6 mo and then bi-monthly, while the Ontario and Saskatchewan cattle were sampled quarterly through the 1-year period of the trial.
Larval cultures — Larval cultures were performed on fecal samples from the initial visit, pooled by age group at each farm. All samples were refrigerated and shipped on ice to the University of Prince Edward Island for larval culturing. Duplicate samples were cultured for each herd age group. Approximately 10 g of feces from each of the 5 animals in the age groups nulliparous, primiparous, and multiparous were mixed with vermiculite and left at room temperature for 2 wk allowing nematode eggs to develop into L3-larva. The larva were harvested using a Baerman apparatus and identified based on microscopic features (18,19). When available, 100 larva per culture were identified, and the relative proportion of each species present was calculated.
Data analysis
Descriptive statistics — The mean and median number of eggs per 5 g of feces (ep5g) was compared among the different regions and age groups, and through the year. The log (ep5g + 1) was used in the graphical presentation of the results. The proportion of different L3 species in the larval cultures was determined and compared to the FECs, using the t-test.
Multivariable methods — A zero-inflated negative binomial (ZINB) model was used to evaluate factors that affected the FECs. The clustering of observations by cow due to repeated samples through time was accounted for by the negative binomial model that allows for extra-Poisson variation, in conjunction with the Huber/White/ sandwich estimator of variance (17). A variable representing herd was included as a fixed effect in each model, to account for the lack of independence between cows in the same herd.
Factors such as season, region, age group, and different management practices were tested in both the logistic and the negative binomial parts of the model. Factors from the management questionnaires were selected through a screening process where subsets of management variables were tried in a backward stepwise negative binomial regression model. First, all the factors regarding heifer management were tested in the model with a liberal cut-off for inclusion (P = 0.1), then factors pertaining to lactating animals, and finally dry cows were screened in the same way. The ZINB model was fitted manually, testing factors that had been identified as significant predictors through the stepwise regression screening process. The cut-off for keeping a variable in the final model was set to P < 0.05. All analyses were done on the same software (Stata, Version 7; Strata Corporation, College Station, Texas, USA) (20).
To assess the distribution of the variance present at each of the levels of the hierarchy in the data (region, herd, cow, test day), a 4-level random effects negative binomial model was built using computer software (MLwiN 1.1; Institute of Education, University of London, London, England) (21). The same independent variables as were used in the ZINB model were included and an exchangeable correlation structure was assumed. The purpose of this exercise was to determine in which hierarchical level most of the variability in the data was located.
Results
Test animals
Table I summarizes the number of samples taken from the 4 study sites. A total of 315 cows were included in the study. The number of samples from each cow varied from 1 to 12. Some cows were culled after only 1 sample; these were replaced at the 2nd visit. The number of cows in the study decreased in the PEI and Quebec farms, partially due to the fact that these herds were enrolled in a clinical trial where 50% of the animals received an anthelmintic drug at calving and hence were excluded from further analyses.
Table I.
Each producer was asked how heifers, lactating, and dry cows were managed. The questionnaire results revealed some differences in the use of pasture between provinces, with pasture use being more widespread in herds from the 2 eastern locations. In 70% of the herds in PEI and Quebec, lactating animals met some of their nutritional requirements from pasture versus in 20% of the herds from Ontario and Saskatchewan. Herd size was another parameter that showed variability across the regions (Table II), with the western herds in this study being larger than the eastern.
Table II.
Fecal examinations
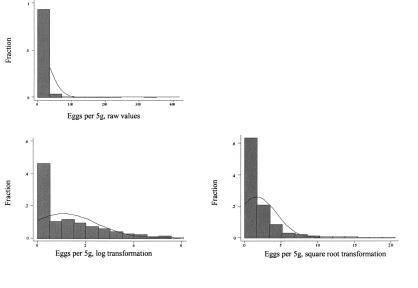
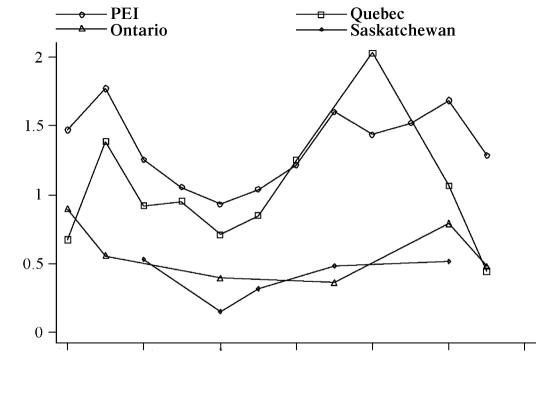
Fecal egg counts (FEC) — The FEC results were reported as ep5g. The range of egg counts was from 0 to 419 ep5g. Table III summarizes the range, mean, and median counts for the 4 regions. The majority of the eggs detected in positive samples were trichostrongyle-type, along with small numbers of Nematodirus spp. eggs in a few animals. In 46% of the samples no eggs were detected, leading the data to being strongly right-skewed with many zero counts and a wide range of values among the non-zero count samples. The average ep5g among the non-zero counts was 17.0. Standard transformations failed to normalize the data, as can be seen in Figure 1. However, a ln(ep5g + 1) transformation was used to illustrate the seasonal variability in FEC as it reduced some of the impact of single large observations on the mean. Figure 2 shows the fluctuation in FEC through the year for the 4 study sites.
Table III.
Figure 1. Distribution of fecal egg counts (FEC) as ep5g, square root (ep5g) and ln(ep5g + 1). Data from 1946 samples collected form 38 Canadian dairy herds between October 1999 and September 2000.
Figure 2. Variation in fecal egg counts (FEC) from cows in 4 different regions of Canada, from October 1999 to September 2000. Data from 1946 samples collected from 38 herds.
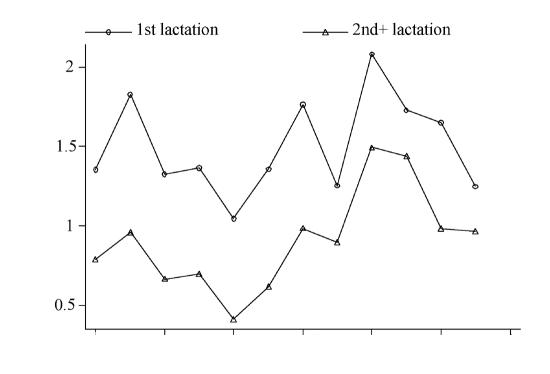
The cows were classified in age groups as either 1st lactation or 2nd lactation and greater. Figure 3 shows the mean ln(ep5g +1) for primiparous and multiparous cows as a function of season.
Figure 3. The variation in fecal egg counts (FEC) for cows from primiparous and multiparous cows in Canada, from October 1999 to September 2000. There were 1946 samples from 38 dairy herds.
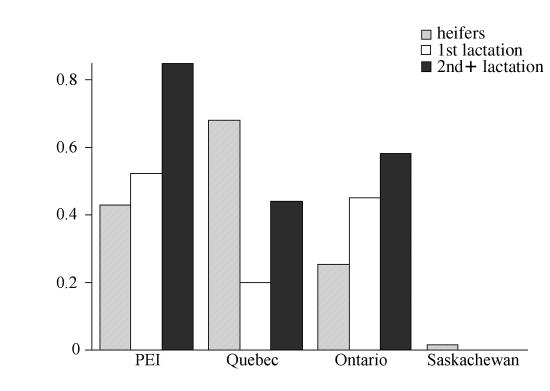
Larval cultures — Out of 236 pooled larval cultures examined, 161 (68%) yielded infective 3rd-stage larva (L3). Fecal egg counts based on the same samples gave 216 positive results. The number of FEC positive and larval culture negative samples was 59 (27.3%), and the number of negative FECs that yielded positive larval cultures was 4 (2.0%). The majority (99.49%) of L3 larva identified in the cultures were either Ostertagia or Cooperia. The remaining larva belonged to the species Oesophagostomum (0.15%), Haemonchus (0.13%), and Trichostrongylus (0.23%). Figure 4 shows the relative number of Ostertagia to Cooperia larva categorized by the age of the animals and by province.
Figure 4. The proportion O. ostertagi of the total number of larva, from cultures taken in the fall of 1999. Presented by age group and province.
Each pooled age group sample was classified as being either predominantly Cooperia or predominantly Ostertagia. The groups in which most of the identified larva were Cooperia had significantly higher mean FEC on the day of sampling (27.4 ep5g) than the Ostertagia groups (16.0 ep5g), P < 0.03.
Data analysis — multivariable methods
The FEC data were heavily skewed to the right and contained a high proportion (46.2%) of zero counts. The overall variance was 998.7 and the mean 9.8; hence a Poisson model was not considered appropriate since it assumes the mean and the variance to be approximately the same.
A zero-inflated negative binomial model was fit to the data. The Vuong test (14) had a high positive value; 8.43 (P < 0.001), indicating that the zero inflated model fit the data better than a regular negative binomial model. Herd was included in the logistic part of the model as a fixed effect, and a robust variance estimator was used to account for the clustering of observations at the animal level. A number of herd level variables from the management questionnaires were tested in the model, along with province, season, and age of the animal.
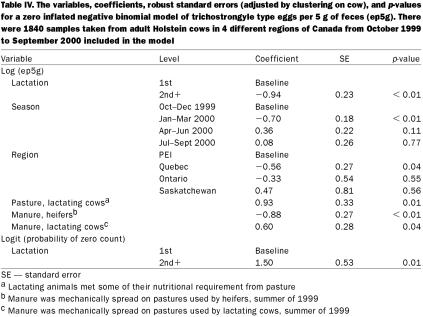
Coefficients for the final model are shown in Table IV, separated into the logit and the negative binomial part of the model. Samples taken from October 1999 up until September 2000 were included in the model to give 1 y of results, which accounts for the fact that 1840 observations are included while a total of 1946 samples were collected.
Table IV.
Parity group, as well as herd, was a significant predictor of FEC in the logistic part of the model. The coefficient for age was 1.50 with the 1st lactation as the baseline. Since the probability of a zero count is what was modelled, the interpretation of the coefficient is that cows from a 2nd lactation or later have a higher probability of a zero FEC. By exponentiation of the coefficient, the odds ratio can be estimated to be 4.48. In other words, the odds of a 2nd lactation or older animal having a zero count were approximately 4.5 times higher than the odds for a 1st lactation animal.
In the negative binomial or count part of the FEC model, the lactation group variables, season, and region were included together with 3 management variables that were found to be significant. As can be seen from Table IV, 2nd lactation animals had a negative coefficient, meaning that older animals had lower expected egg counts. Both season and region were overall significant variables based on a likelihood ratio test. When fall was used as a baseline, the winter samples yielded lower expected FECs than all the other seasons. Consequently, in the spring (April to June), counts were higher than in the winter months. When pasture exposure, season, and age were accounted for, the Quebec herds had lower expected FEC numbers than herds from PEI (the baseline). Mechanical spreading of manure on pastures used by heifers contributed to a lower expected FEC, while mechanical spreading of manure on pastures used by lactating cows had the opposite effect. If lactating cows were on pasture, the expected number of nematode eggs was increased compared to that for non-pastured animals.
Continuous versus rotational grazing; grazing heifers with other age groups; clipping, cutting or dragging of pastures; together with various parasite treatment practices, did not affect the FEC in this model.
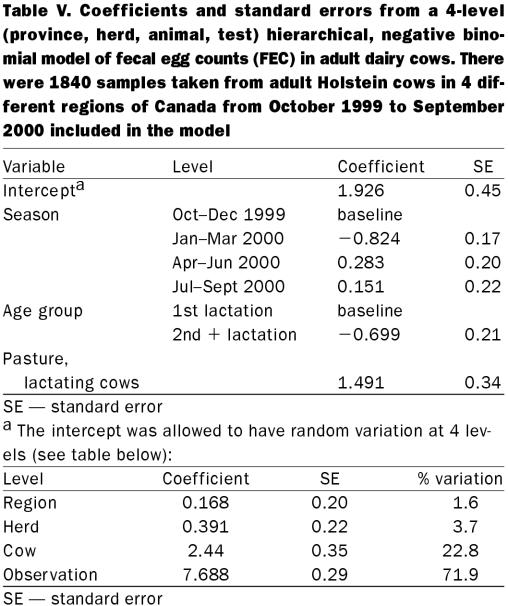
A multilevel negative binomial model was built, with region, herd, cow, and observation included as random effects. The proportion of variance found at each of the 4 levels was 1.6%, 3.7%, 22.8%, and 71.9%, respectively. The coefficients and standard errors from the 4-level model are presented in Table V.
Table V.
Discussion
The herds included in the current study were a convenience sample of farms in close proximity of the 4 Canadian veterinary colleges. This may potentially bias the results, as expected compliance from the producer was among the inclusion criteria and this could lead to a selection of well-managed herds that do not represent the underlying population of Canadian dairy herds. However, factors that affect the FEC can be expected to be the same across herds and hence these analytical results will be less biased than descriptive results, such as estimated prevalence of gastrointestinal parasitism. Only including animals up until the day anthelmintic treatment was administered, and animals that were in the negative control group, minimized the potential impact of the concurrent clinical trial.
Overall, FECs were low in all of the cows monitored in this study. Variation in the magnitude of egg output was seen among seasons and age groups. A small, but statistically significant, rise in the fecal egg counts was seen in the early spring. In order to facilitate comparison to previous results, this discussion will use eggs per gram (epg) as the unit. The FECs in the current study ranged from 0 to 419 ep5g, with a mean of 9.8 ep5g among all cows and mean among positive samples of only 17.0 ep5g. Expressed as eggs per gram, this translates to a range from 0 to 83.8 epg, a mean of 1.96 epg and a mean for positive samples of only 3.4 epg.
The FEC results from this study appear to be lower than previous work done in North America. A trial in Georgia reported an average count of 5.0 epg (5). A prevalence study of gastrointestinal nematodes in dairy heifers from 3 western Canadian provinces concluded that the average FEC in the Saskatchewan herds included was 10.3 epg (22). Maine has similar climatic conditions as Atlantic Canada, and a study performed there found average FECs of 1.1 epg in January and February, and 14.2 epg in cows in May and June. This study also described a small increase in the number of Ostertagia eggs recovered in the spring (12). An increase in the FECs in spring, before animals were exposed to pasture, was also seen in a study performed in Quebec (23). In that 1-year study, 50% of the adult cattle had trichostrongyle-type eggs present on the day of analysis and 7% had between 100 and 1000 epg. Smith (24) suggested 200 epg as the cutoff value for clinically important counts in bovine yearlings, and all the results from the present study were well below that threshold. Other reports of FEC levels in adult cattle have also typically been in the area of 3 to 5 epg (25,26,27).
More than 99% of the larva identified in the larval cultures were either Ostertagia or Cooperia. Similar results were reported in studies on adult cattle conducted elsewhere in Canada (23,28,29). The species breakdown between the larva was more or less the same for PEI, Quebec, and Ontario, while the Saskatchewan herds had the highest relative number of Cooperia to Ostertagi L3 larva recovered. The predominance of Cooperia in the samples from Saskatchewan is hard to explain. Larval cultures from Alberta beef cattle have shown a 60 (Cooperia) and 40 (Ostertagia) breakdown between the 2 species (30), and Saskatchewan could be expected to have comparable conditions. Based on experiments with larval cultures, Berrie et al (31) conclude that larval recoveries are disproportionate and that the technique should only be used to identify the species present, not to draw conclusions about the relative proportions.
Multivariable models
Fecal egg count observations were not statistically independent, as the data set contained repeated measures from the same individuals over time, and cows were clustered in herds. However, software to fit multilevel zero inflated negative binomial models is currently not available. Consequently, a multilevel negative binomial model and a zero-inflated negative binomial model were considered for these analyses. Since the high proportion of tests with zero counts was a prominent feature of the data, the ZINB model was selected. The multilevel model yielded similar results, but is theoretically less suited for dealing with the high proportion of zero counts.
Based on the analysis of crude variance components from the multilevel model, most of the variance (72%) was found between samples within a cow. Due to the large degree of variability in egg counts, both between cows in a herd and between observations within a cow, there was relatively little variation between herds once factors such as exposure to pasture and age were taken into account. Applying the robust variance estimator at the cow level, along with the negative binomial error distribution, should have prevented the dependency among observations within each cow from having a substantial effect on the standard errors in the ZINB model. Clustering within the herd was accounted for by including herd as a fixed effect in the logistic component of the ZINB model. Both herd and region were significant predictors in the ZINB model, based on the likelihood ratio test. However, region was not significant in the multilevel model once factors such as age, season, and pasture use were controlled for and herd was included as a random effect.
Estimated coefficients in the negative binomial part of the model are interpreted as count models, while coefficients from the logistic part are related to the probability of a zero outcome. A positive coefficient in the logistic part of the model would be interpreted as an increased probability of a zero count (not having any nematode eggs present in a fecal sample).
Age was dichotomized into 1st lactation or 2nd lactation and older animals. The model uses 1st lactation as a baseline, and since the group of 2nd lactation or older animals had a positive coefficient in the logistic model, these older cows were more likely to be in the group that had zero FECs. In the negative binomial part of the model, age group had a negative coefficient, meaning that older cows had lower FECs than the 1st lactation group. If we assume that a similar biological mechanism (for example, host immunity) is involved in increasing the probability of a zero count and in lowering the magnitude of a positive outcome, these 2 coefficients must always have opposite signs.
The study period was categorized into 4 seasons, based on the patterns seen in the graphical presentation of egg output through the year. The winter FECs were significantly lower than all the other seasons, hence the April/June egg counts were higher than those for January to March. It is interesting to note that the egg counts in PEI and Quebec rose as early as April or May, even though the cattle were not let out on pasture until late May or early June in 2000 (Figure 2). The observation that the counts start rising even before any possible re-exposure could have occurred can be attributed to hypobiotic L4 larva maturing to adult fecund females at this time. Although the magnitude of this increase in FECs is low, it was statistically significant using both methods of analysis (multilevel negative binomial and ZINB). This apparent ‘spring-rise’ is a well know phenomenon in small ruminants, and has previously been reported in cattle, although in this species it is seen on a much smaller scale (32).
Visual assessment of the data suggests that PEI and Quebec herds had higher FECs than the western herds included in the study (Figure 2). The interpretation of the ZINB model is that cattle from farms that used pasture for lactating cows had higher counts than if pasture was used to a lesser extent. Based on the questionnaire, we know that the use of pasture was less widespread amongst the group of study herds in the 2 western locations, even though all herds had to have used some degree of pasture use or outdoor exercise. Once use of pasture and other factors were accounted for, the differences in parasite levels between provinces were less pronounced. This indicates that the apparent difference between PEI and the western provinces was more likely attributable to variation in the degree of pasture exposure rather than to climatic or geographic differences. In general, there is no reason to believe that parasite burdens should be substantially different among pastured herds in Saskatchewan, Ontario, Quebec, and PEI.
The current study confirms previous work done on the epidemiology of bovine gastrointestinal nematodes and suggests that ZINB models can be useful in explaining associations between herd, animal factors, and FECs. The method could potentially be applied in other areas of parasitology where the outcome is count data that include many zero observations, and have a large degree of variation in the non-zero counts.
Footnotes
Acknowledgments
The authors thank Theresa Rogers, Drs. VanLeeuwen, and Wichtel at the Atlantic Veterinary College Ambulatory Clinic; Dr. Dominique Cecyre in St. Hyacinthe and Dr. Jeromy TenHaag at the Department of Population Medicine, Ontario Veterinary College. Bob Maloney, Robert MacMillan, and Terri McKenzie provided technical assistance in parasitology. The study was funded by Merial Canada.
Address all correspondence and reprint requests to Dr. Ane Nødtvedt; The Norwegian Zoonosis Centre, National Veterinary Institute, P.O. Box 8156, 0033 Oslo, Norway; telephone: + (47) 23-21-6482; e-mail: ane.nodtvedt@vetinst.no
Received December 4, 2001. Accepted May 13, 2002.
References
- 1.Armour J. The influence of host immunity on the epidemiology of trichostrongyle infections in cattle. Vet Parasitol 1989;32:5–19. [DOI] [PubMed]
- 2.Gibbs HC, Herd RP. Nematodiasis in cattle. Importance, species involved, immunity, and resistance. Vet Clin North Am Food Anim Pract 1986;2:211–224. [PubMed]
- 3.Gross SJ, Ryan WG, Ploeger HW. Anthelmintic treatment of dairy cows and its effect on milk production. Vet Rec 1999;144:581–587. [DOI] [PubMed]
- 4.Nødtvedt A, Dohoo IR, Sanchez J, Conboy G, DesCoteaux L, Keefe GP. Increase in milk yield following eprinomectin treatment at calving in pastured dairy cattle. Vet Parasitol 2002;105: 179–268. [DOI] [PubMed]
- 5.Ciordia H. Occurrence of gastrointestinal parasites in Georgia cattle. Am J Vet Res 1975;36:457–461. [PubMed]
- 6.Gutierres V, Todd AC, Crowley JW, Jr. Natural populations of helminths in Wisconsin dairy cows. Tierarztl Prax Ausg G Grosstiere Nutztiere 1979;74:369–72,374. [PubMed]
- 7.Borgsteede FH, Tibben J, Cornelissen JB, Agneessens J, Gaasenbeek CP. Nematode parasites of adult dairy cattle in the Netherlands. Vet Parasitol 2000;89:287–296. [DOI] [PubMed]
- 8.Armour J, Duncan M. Arrested larval development in cattle nematodes. Parasitol Today 1987;3(6):171–176. [DOI] [PubMed]
- 9.Cox DD, Todd AC. Survey of gastrointestinal parasitism in Wisconsin cattle. J Am Vet Med Assoc 1962;141:706–709. [PubMed]
- 10.Anderson N, Armour J, Jarrett WF, Jennings FW, Ritchie JS, Urquhart GM. A field study of parasitic gastritis in cattle. Vet Rec 1965;77:1196–1204. [PubMed]
- 11.Burrows RO, Davison CC, Best PJ. Survey of abomasal parasitism of culled dairy cows in southern Britain. Vet Rec 1980;107: 289–290. [DOI] [PubMed]
- 12.Yazwinski TA, Gibbs HC. Survey of helminth infections in Maine dairy cattle. Am J Vet Res 1975;36:1677–1682. [PubMed]
- 13.Gasbarre LC, Leighton EA, Bryant D. Reliability of a single fecal egg per gram determination as a measure of individual and herd values for trichostrongyle nematodes of cattle. Am J Vet Res 1996;57:168–171. [PubMed]
- 14.Long JS. Count Outcomes: Regression Models for Counts. Regression Models for Categorical and Limited Dependent Variables. Thousand Oaks: Sage Publications, 1997:217–250.
- 15.Wilson K, Grenfell BT. Generalized Linear Modelling for Parasitologists. Parasitol Today 1997;13:33–38. [DOI] [PubMed]
- 16.McDermott JJ, Schukken YH. Study design and analytic methods for data collected from clusters of animals. Prev Vet Med 1994;18:175–191.
- 17.Statacorp. Stata Statistical Software. Relase 7 Manual. College Station, Texas: Stata Corporation, 2001.
- 18.MAFF. Manual of Veterinary Parasitological Laboratory Techniques. 3rd ed. London: Ministry of Agriculture and Food, 1986.
- 19.Bowman DD. Georgis' parasitology for veterinarians. 7th ed. Philadelphia: WB Saunders, 1999.
- 20.Stata Statistical Software. College Station, Texas: Stata Corporation, 2001.
- 21.Goldstein H, Rasbash J, Plewis I, et al. A user's guide to MLwiN. 1.1 ed. Institute of Education, University of London, 1998.
- 22.Cox WR, Lemiski D. Prevalence of gastrointestinal nematodes in dairy heifers in western Canada. Can Vet J 1989;30:666–668. [PMC free article] [PubMed]
- 23.Frechette JL, Gibbs HC. Studies on the incidence of gastrointestinal helminths of cattle in Quebec. Can Vet J 1971;12: 207–210. [PMC free article] [PubMed]
- 24.Smith HJ. On the development of gastrointestinal parasitism in bovine yearlings. Can J Comp Med 1970;34:303–308. [PMC free article] [PubMed]
- 25.Thomas RJ, Rowlinson P. An evaluation of anthelmintic treatment in a dairy herd. In: Nansen P, Jorgensen P, Soulsby EJL, eds. Epidemiology and Control of Nematodiasis in Cattle. Copenhagen: The Commission of the European Communities, 1981:101–115.
- 26.Fox MT, Jacobs DE. Observations on the epidemiology and pathogenicity of nematode infections in adult dairy cattle in Great Britain. In: Nansen P, Jorgensen P, Soulsby EJL, eds. Epidemiology and Control of Nemtodiasis in Cattle, Copenhagen: The Commission of the European Communities, 1981:87–97.
- 27.Caldwell V. Gastro-intestinal nematodes in dairy cattle: Prevalence, level of infection estimated by bulk tank milk ELISA testing and related risk factors. (MSc thesis). Faculté de médecine vétérinaire, Université de Montréal, Québec 2000.
- 28.Slocombe JO. Parasitisms in domesticated animals in Ontario. I. Ontario Veterinary College Records 1965–70. Can Vet J 1973; 14:36–42. [PMC free article] [PubMed]
- 29.Ranjan S, Trudeau C, Prichard RK, Piche C, Bauck S. Epidemiological study of parasite infection in a cow-calf beef herd in Quebec. Vet Parasitol 1992;42:281–293. [DOI] [PubMed]
- 30.Piché CA. The epidemiology of gastrointestinal nematode infections in two beef cow-calf herds in Alberta and Quebec (MSc thesis). Department of Biological Sciences, The University of Calgary, 1992.
- 31.Berrie DA, East IJ, Bourne AS, Bremner KC. Differential recoveries from faecal cultures of larvae of some gastro- intestinal nematodes of cattle. J Helminthol 1988;62:110–114. [DOI] [PubMed]
- 32.Burrows RO, Best PJ, Preston JM. Trichostrongylid egg output of dairy cows. Vet Rec 1980;107:399–401. [DOI] [PubMed]


