

Abstract
Fatty acid-induced cholecystokinin (CCK) secretion in humans and from the enteroendocrine cell line STC-1 depends critically on acyl chain length.
Therefore we have characterized the relationship between acyl chain length and the potency of the fatty acid to induce CCK secretion and changes in intracellular Ca2+ concentration ([Ca2+]i) in two enteroendocrine cell lines (STC-1 and GLUTag). We found that the potency of the fatty acid was directly proportional to its chain length and therefore inversely proportional to its solubility.
In both cell types, the fatty acid-induced rise in [Ca2+]i in response to decanoic acid (C10), dodecanoic acid (C12) and tetradecanoic acid (C14) was significantly reduced in Ca2+-free medium and largely blocked by nicardipine. Intracellular stores also contributed to the overall shape of the [Ca2+]i peak. Thus all the fatty acids tested caused the release of Ca2+ from stores and influx of extracellular Ca2+, presumably through L-type calcium channels.
To probe the site of fatty acid action, we studied the distribution of 14C-labelled dodecanoic acid. This label was rapidly and irreversibly accumulated by both cell types, where it became concentrated about 20-fold. Confocal microscopy of a fluorescent analogue of dodecanoic acid clearly demonstrated that it entered the cytosol and was not merely partitioning in the cell membrane. These data indicate that an intracellular action for fatty acid-induced CCK secretion cannot be eliminated.
Dodecanoic acid itself, and not a metabolite, is the agent responsible for triggering Ca2+ entry since a non-metabolizable form of dodecanoic acid (2-bromododecanoic acid) was also capable of inducing a rise in [Ca2+]i in both cell types.
In conclusion, the rise in [Ca2+]i in STC-1 and GLUTag cells evoked by medium- to long-chain fatty acids results from the triggering of a specific signalling pathway. Whether triggering occurs through activation of a membrane-bound receptor or at an intracellular site remains to be clarified.
The presence of ingested nutrients, particularly protein and fat, in the proximal small intestine induces the secretion of the gut hormone cholecystokinin (CCK) from specialized enteroendocrine cells (I-cells; Liddle, 1997). CCK is important in digestion because it plays a key role in regulating a range of intestinal responses, which include stimulation of pancreatic secretion, gall bladder emptying and inhibition of gastric motility (Hopman et al. 1985; Liddle et al. 1986; Smith & Gibbs, 1994; Higham et al. 1997; Liddle, 1997). Collectively, these responses help to integrate and optimize the digestion of fat and protein (Liddle, 1997).
Long-chain rather than short-chain triglycerides stimulate the release of CCK in humans (Isaacs et al. 1987), specifically via intraduodenal free fatty acids (Beardshall et al. 1989; Guimbaud et al. 1997). Recently, we have demonstrated that fatty acids require a minimum acyl chain length of twelve carbon atoms to cause a measurable increase in the concentration of CCK in human serum (McLaughlin et al. 1999).
While the mechanisms responsible for protein-induced CCK release have at least been partially elucidated and appear to involve one or more releasing factors (Bouras et al. 1992; Sharara et al. 1993), the mechanism(s) responsible for lipid-induced CCK release remain unknown. However, we have shown that stimulation by fatty acids does not necessarily involve a releasing factor; the application of dodecanoic acid (C12), in the absence of albumin, onto the CCK-secreting enteroendocrine cell line STC-1 directly stimulates CCK secretion (McLaughlin et al. 1998). Such secretion appears to involve the influx of extracellular Ca2+ through L-type Ca2+ channels, although we did not evaluate the precise contribution of intracellular Ca2+ stores (McLaughlin et al. 1998).
This study raised several important questions which we have examined in detail by monitoring the [Ca2+]i response to saturated fatty acids in both STC-1 cells and a second enteroendocrine cell line of colonic origin, GLUTag (Drucker et al. 1994). First, is the chain length dependency observed in the STC-1 cell line unique, or can it be demonstrated in other enteroendocrine cell lines? Second, is the chain length dependency absolute or does the response observed represent a change in the potency of the fatty acid with varying chain length? Third, do fatty acids enter cells when presented in solutions which lack bovine serum albumin (BSA; usually included as a fatty acid carrier)? This question is important in determining the site of action of fatty acids. We have also examined the source of the [Ca2+]i rise that occurs in response to saturated fatty acids and find it to be mediated mostly by the influx of extracellular Ca2+, with release from stores playing a minor role. Our data indicate that the rise in [Ca2+]i, induced by medium- to long-chain fatty acids, is not due to non-specific cellular interactions but rather operates via a defined signal transduction pathway.
METHODS
Materials
Cell culture consumables (Dulbecco's modified Eagle's medium (DMEM), horse serum, fetal bovine serum, penicillin/streptomycin) were purchased from Gibco (Paisley, UK). Saturated fatty acids including C8 (octadecanoic), C9 (nonanoic), C10 (decanoic), C11 (undecanoic), C12 (dodecanoic), C13 (tridecanoic) and C14 (tetradecanoic) were purchased from Sigma (Poole, UK). All other materials were obtained from either Sigma or BDH (Poole, UK) with the exception of fura-2 AM and Pluronic F-127 which were obtained from Molecular Probes (Leiden, Netherlands). Nicardipine (Sigma) was dissolved in dimethyl sulfoxide (DMSO) to produce a stock concentration of 5 mm. Phosphate-buffered saline (PBS) tablets were purchased from Oxoid (Basingtoke, Hampshire, UK)
Tissue culture
STC-1 cells (kindly supplied by D. Hanahan, University of California, San Francisco, CA 94143, USA) were grown in DMEM supplemented with 15 % horse serum and 2·5 % fetal bovine serum in an atmosphere of 5 % CO2-95 % air at 37°C. Cells were routinely passaged upon reaching 80–90 % confluency by washing the cell layer repeatedly with PBS and incubating with a solution of 0·25 % trypsin for 1 min. Plating densities ranging from 1 × 10⁴ to 1 × 10⁵ cells cm−2 were used for routine subculture in flasks.
GLUTag cells (a kind gift from D. Drucker, Toronto Hospital, 200 Elizabeth Street, Toronto, Canada) were grown in DMEM supplemented with 10 % fetal bovine serum in an atmosphere of 5 % CO2-95 % air at 37°C. Cells were routinely cultured and plated as described above for STC-1.
For fluorescence studies, STC-1 and GLUTag cells were plated at densities between 1 × 10⁵ and 8 × 10⁴ cells cm−2 on coverslips coated with 0·025 % (w/v) poly-L-lysine placed in 24-well plates. Measurements of intracellular calcium concentration in both cell lines were carried out 24–48 h after seeding. Only cells between passages 4 and 16 were used in these experiments. Cell viability was estimated by trypan blue exclusion and was greater than 95 %.
Preparation of fatty acid
Fatty acid stock solutions were prepared at a concentration of 500 mm in absolute ethanol. These were diluted into a buffered (pH 7·4) isotonic solution with the following composition (mm): 140 NaCl, 4·5 KCl, 10 Hepes acid, 10 Hepes salt, 1·2 CaCl2, 1·2 MgCl2 and 10 glucose, so as to produce working solutions with a fatty acid concentration of between 50 μm and 1.5 mm. Since fatty acids of chain length C10 and longer are poorly soluble in aqueous solution, each fatty acid solution was sonicated just prior to use with a probe sonicator (Soniprep 150, Sanyo, Herts, UK) for 4 min at room temperature. For experiments carried out under calcium-free conditions, fatty acids were prepared in buffer from which Ca2+ was omitted and which contained 0·2 mm EGTA.
In order to determine the solubility range and particle size of dodecanoic acid in our buffer solution, the average hydrodynamic size of particles in solution (Z average) was determined using a Malvern Zeta sizer 3000 (Spring Lane South, Malvern, Worcs WR14 1XZ, UK). At low concentrations of dodecanoic acid (0–40 μm), the particle size was too small to be measured accurately by the instrument. Between the concentrations of 50 and 90 μm dodecanoic acid the Z average rapidly increased from 548·9 nm to 1517 nm. Above 90 μm the sedimentation rate was too great to accurately measure the size of fatty acid molecules in solution.
Calcium imaging studies
[Ca2+]i in STC-1 and GLUTag cells was determined using dual-excitation fluorescence microscopy with the calcium-sensitive ratiometric dye fura-2. Cells grown on individual coverslips were incubated at room temperature with 4 μm fura-2 AM dissolved in isotonic buffer (described above) containing Pluronic acid (0·025 %) for 45 min. The cells were then washed three times with buffer solution and the coverslips mounted into a perfusion chamber. The preparation was viewed on an inverted epifluorescence microscope (Nikon Diaphot, Chiyoda, Tokyo). Fluorescence micrographs at an emission wavelength of 510 nm were then captured by a cooled slow scan CCD camera (Digital Pixel Ltd, Brighton, UK) at the excitation wavelengths of 340 and 380 nm. Images were acquired every 20 s and 340 nm/380 nm ratio images were determined ‘off-line’ following background subtraction. All studies were carried out at room temperature. Where appropriate, traces were calibrated using a two-point calibration of fura-2 fluorescence as described previously (Grynkiewicz et al. 1985).
Measurement of CCK
Supernatant was collected from cell cultures and centrifuged (5000 g) to remove cell debris. CCK was measured using a radioimmunoassay. The antibody used (L425) was raised by immunizing rabbits with sulphated CCK octapeptide (McLaughlin et al. 1998). In order to control for differing cell plating densities, CCK concentrations were normalized against total cellular protein using a fluorometric assay (Undenfriend et al. 1972) with bovine serum albumin (BSA; BDH) used as a protein standard.
Permeation of dodecanoic acid into cells
A trace of amount of 14C-radiolabelled dodecanoic acid (0·05 μCi ml−1; Amersham, Little Chalfont, Bucks, UK) was added to a 50 μm solution of dodecanoic acid. GLUTag and STC-1 cells were then exposed to this solution for 2–15 min. Initial experiments, using blank culture plates, indicated that the radiolabelled dodecanoic acid rapidly associated with the plastic of the culture well. To eliminate this problem, cells which had been exposed to the dodecanoic acid label were washed once and then physically removed from the culture wells by a brief incubation (∼30 s) with 1·25 % trypsin. The resultant cell suspension was then rapidly centrifuged (2000 g) through 50 μl of oil (di-n-butyl phthalate:dinonyl phthalate, 3:2; Fluka, Glossop, Derbyshire, UK). The base of the centrifuge tube containing the pellet was cut off and placed in a new centrifuge tube containing 1 ml of 2 % Triton X-100. From this solution 700 μl was removed and added to scintillation vials for counting on a beta counter (Tricarb 460; Packard, Berks, UK). From the remaining 300 μl, 100 μl was processed to determine total cellular protein as described above. Results were expressed as nanomoles of dodecanoic acid per milligram of protein. Intracellular dodecanoic acid concentrations were estimated by using the non-metabolizable intracellular space marker 3-O-methyl-glucose with trace amounts (0·33 μCi ml−1) of the tritiated form of this compound (Amersham) as described previously (Benson et al. 1996).
Confocal microscopy
STC-1 cells were plated on 35 mm tissue culture dishes (Corning Costar Corp, Cambridge, MA, USA) at a density of 5 × 10⁴ cells cm−2 and used 24–48 h later. Just prior to the experiment, the cells were washed twice and placed in 4 ml of isotonic buffer (described above) containing bodipy-labelled dodecanoic acid (Molecular Probes) at a concentration of 50 μm. The culture dish was then quickly placed onto the microscope stage and the field examined with a BioRad MRC 600 confocal laser scanning attachment mounted on a suitably modified photomicroscope II (Zeiss) using an argon laser (excitation 488 nm, 25 mW, Ion Laser Technology, Salt Lake City, UT, USA) and a × 20 water immersion objective lens. A series of images (768 × 512 pixels), using a minimum pinhole size were acquired 2 min after initial incubation at different depths through the cells separated by 5–10 μm. This allowed the spatial distribution of the bodipy-labelled dodecanoic acid, within the cell, to be determined. The completed Z-series were stored on optical disks using an optical drive (Panasonic 7030E).
Data analysis
All data are expressed as means ± s.e.m. Unless otherwise stated statistical comparisons were made using Student's unpaired two-tailed t test, with P values of less than 0·05 being considered significant. In experiments which measured the change in [Ca2+]i, a change in the 340 nm/380 nm ratio of 0·2 units was considered significant.
RESULTS
The potency of fatty acids to induce CCK secretion in STC-1 and GLUTag cells is correlated to fatty acid chain length
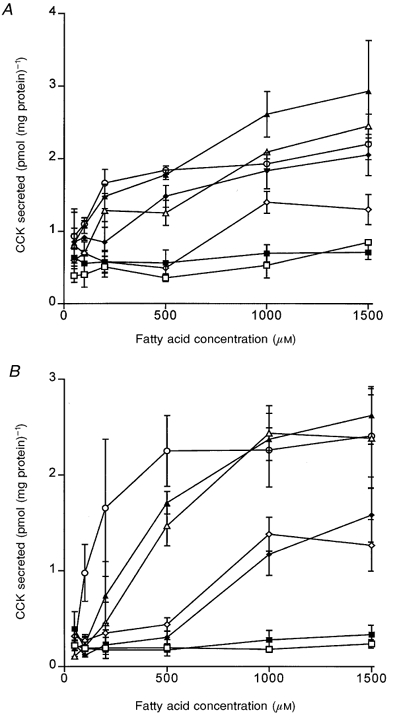
In a previous study, we showed that the fatty acid-induced CCK response in humans depends primarily on the chain length of the fatty acid in the test meal (McLaughlin et al. 1999). An identical chain length dependency was observed in the STC-1 cell line (McLaughlin et al. 1998). In order to confirm that the secretion of CCK induced by fatty acids was not peculiar to the STC-1 cell line model, we tested a second CCK-containing enteroendocrine cell line (GLUTag) of colonic origin (Drucker et al. 1994). When exposed to various doses of fatty acids of chain length C8-C14, both cell lines displayed fatty acid-induced CCK secretion which was chain length dependent (Fig. 1). However, these data also indicate a correlation between the acyl chain length of the fatty acid and its potency to induce CCK secretion. Octanoic (C8) and nonanoic (C9) acid were never observed to induce CCK secretion in either STC-1 or GLUTag cells, whereas decanoic (C10), undecanoic (C11), dodecanoic (C12), tridecanoic (C13) and tetradecanoic (C14) acids were all able to induce CCK secretion and the amount of CCK secreted was correlated to the dose of fatty acid to which the cells were exposed (Fig. 1).
Figure 1.
Fatty acid-induced CCK secretion in two enteroendocrine cell lines
The effect of fatty acid concentration on CCK secretion in STC-1 (A) and GLUTag (B) cells induced by octanoic (C8; □), nonanoic (C9; ▪), decanoic (C10; ⋄), undecanoic (C11; ♦), dodecanoic (C12; ▵), tridecanoic (C13; ▴) and tetradecanoic (C14; ○) acid. Enteroendocrine cells were washed once and exposed to to fatty acid solutions for 1 h. The supernatant was collected from the cells and the concentration of CCK in the solution determined using a radioimmunoassay. The CCK concentration was normalized against total cellular protein. Data points represent the means ± s.e.m. of 4 experiments.
The effect of dodecanoic acid on [Ca2+]i
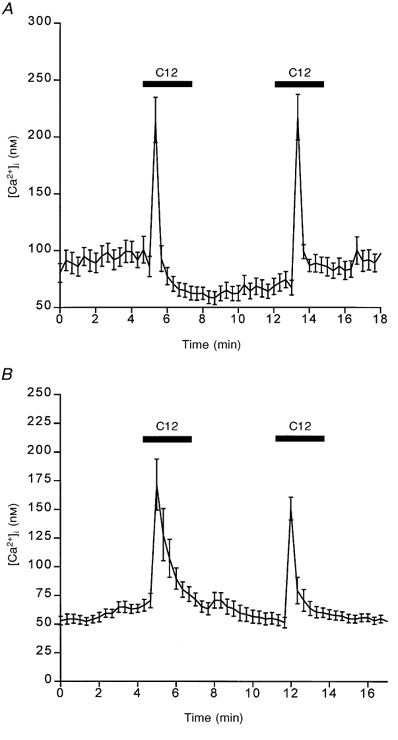
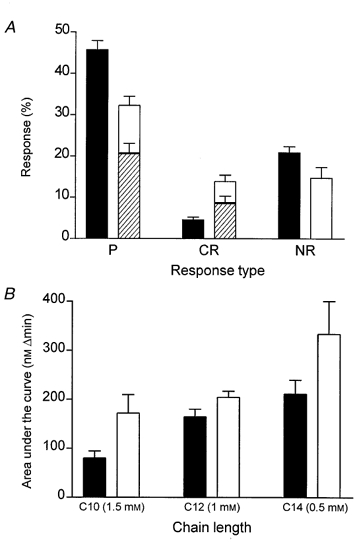
Dodecanoic acid (500 μm) elevates [Ca2+]i when applied to STC-1 (Fig. 2A) and GLUTag (Fig. 2B) cells. The mean rise in [Ca2+]i for the cell population was rapid and transient, returning to normal levels before the stimulus was removed. However, the shape of the response varied from cell to cell, with some cells exhibiting a transient Ca2+ spike while others had a broader peak that lasted the full duration of the stimulus. We have classified these responses into three categories and the percentage of cells in each category is shown in Fig. 3A. The most common cellular response was a rapid transient rise in [Ca2+]i in both STC-1 and GLUTag cell lines (labelled ‘P’ in Fig. 3A). GLUTag cells also commonly displayed a transient rise in [Ca2+]i upon the removal of dodecanoic acid (shown as a hatched bar in Fig. 3A). Both STC-1 and GLUTag cells could be re-stimulated with dodecanoic acid after a recovery period of 4 min (Fig. 2). Figure 3B shows the mean area under the [Ca2+]i response curve that was observed when STC-1 and GLUTag cells were exposed to a dose of fatty acid which caused a maximal response. These data demonstrate that the ability of fatty acids to induce a rise in [Ca2+]i increases with increasing chain length.
Figure 2.
Fatty acid-induced changes in [Ca2+]i in two enteroendocrine cell lines
The effect of 500 μm dodecanoic acid (C12) on [Ca2+]i (nM) in STC-1 cells (A) and GLUTag cells (B). Cells were exposed to dodecanoic acid for 3 min (horizontal bars). Fluorescence images were acquired every 20 s and cells were identified using global thresholding to create a binary image which was applied to the ratio images to identify the regions of interest. The ratio for each region was calculated and all the regions were then averaged to give a mean ±s.e.m. fluorescence ratio for all cells present in the field. This was then converted to a Ca2+ concentration using standard calibration techniques (see Methods). The mean Ca2+ concentration (nM) is plotted on the ordinate. For STC-1 cells, the number of cells which make up this mean is 22 and this figure is representative of at least 4 other experiments. For GLUTag cells, the number of cells which make up this mean is 11 and this figure is representative of 7 other experiments.
Figure 3.
The [Ca2+]i response varies in individual enteroendocrine cells and the magnitude of the [Ca2+]i response is correlated with acyl chain length
A, classification and quantification of [Ca2+]i changes which occurred in individual STC-1 (▪) and GLUTag (□) cells in response to 500 μm dodecanoic acid. Three main response type were observed: (1) cells which responded to dodecanoic acid with a transient rise in [Ca2+]i which rapidly returned to resting values (i.e. similar to those responses shown in Fig. 2), coded as a ‘primary response’ (P); (2) cells which responded to dodecanoic acid with either a sustained rise in [Ca2+]i which did not return to resting values until the stimulus was removed or cells which demonstrated some other feature such as a bursting pattern with respect to [Ca2+]i, coded as a ‘complex response’ (CR); (3) cells in which [Ca2+]i was unchanged by the addition of dodecanoic acid, coded as ‘no response’ (NR). The hatched bars present inside the open bars represent GLUTag cells which displayed a change in [Ca2+]i when dodecanoic acid was removed. This ‘off’ response was mostly seen as a small transient rise in [Ca2+]i. ‘Off’ responses were only rarely observed in the STC-1 cell line. The data represent the means ±s.e.m. of 16 experiments, where each experiment contained 30–40 cells which were categorized into the groups described. B, the efficacy of fatty acids to induce changes in [Ca2+]i in STC-1 cells (▪) and GLUTag cells (□). The ordinate axis represents the area under the [Ca2+]i curve and is calculated over the duration of the fatty acid-induced change in [Ca2+]i using the trapezoid rule to obtain a numerical integral. Three fatty acids were examined: decanoic acid (C10, 1·5 mm), dodecanoic acid (C12, 1 mm) and tetradecanoic acid (C14, 0·5 mm). The doses chosen gave a maximal rise in [Ca2+]i. Each column represents the mean ±s.e.m. of 4 experiments.
Chain length specificity is conserved in both the STC-1 and GLUTag cell lines
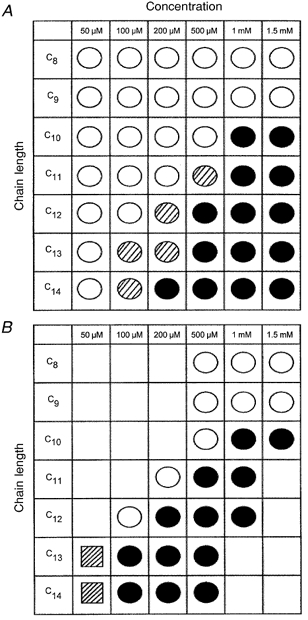
Figure 4 summarizes the relationship of fatty acid concentration to chain length and shows that a decrease in carbon chain length is directly correlated to a decrease in the potency of the fatty acid to induce CCK secretion (Fig. 4A) or a rise in [Ca2+]i (Fig. 4B). Thus, C14 causes a significant CCK secretion and a rise in [Ca2+]i at 200 μm whereas in the case of C10 these effects are observed only at 1 mm. The STC-1 and GLUTag cell lines responded in a similar manner although STC-1 cells tended to respond at slightly lower fatty acid concentrations (as indicated by the hatched circles; Fig. 4A) and GLUTag but not STC-1 cells underwent a significant rise in [Ca2+]i when treated with 50 μm C13 or C14 fatty acid (as indicated by the hatched boxes; Fig. 4B). In summary, these data demonstrate that the chain length specificity of fatty acid detection is conserved in two enteroendocrine cell lines of different origins and that CCK secretion is always accompanied by a change in [Ca2+]i, although a change in [Ca2+]i will not always result in CCK secretion, especially in the GLUTag cell line.
Figure 4.
CCK secretion and changes in [Ca2+]i are correlated with acyl chain length in two enteroendocrine cell lines
Summary of the relationship between dose and fatty acid chain length and their effect on CCK secretion (A) and [Ca2+]i (B) in STC-1 and GLUTag cell lines. Each symbol represent at least 4 individual experiments. Significant CCK secretion was defined as a value equal to or greater than 1 pmol mg−1 of protein (normal control value is ≈0·3 pmol mg−1). With respect to [Ca2+]i, a change in the 340 nm/380 nm fluorescence ratio of greater than 0·2 units was considered significant. ○, no significant change; •, significant change in both cell lines;  significant change in the STC-1 cell line only;
  , a change in the GLUTag cell line only.
The effect of BSA on the dodecanoic acid-induced rise in [Ca2+]i
In contrast to most studies, which introduce fatty acids into aqueous solutions using a carrier protein such as bovine serum albumin (BSA), we have applied fatty acids directly to our experimental solutions. In our experimental system, fatty acids were unable to elicit a rise in [Ca2+]i in the presence of BSA. However, the inhibitory effect of BSA was reversible, as reapplication of dodecanoic acid after exposure of the cells to BSA elicited a rise in [Ca2+]i (Fig. 5).
Figure 5.
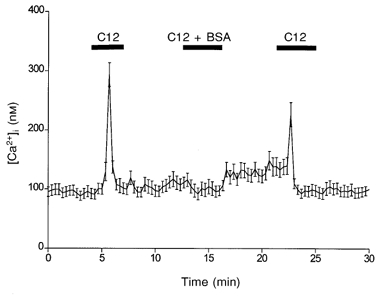
Enteroendocrine cells do not respond to fatty acids when presented with the carrier protein BSA
The influence of BSA on C12-induced [Ca2+]i in STC-1 cells. The mean fluorescence ratio was acquired and calculated as described for Fig. 2. Dodecanoic acid (500 μm) solutions were applied for three 3 min periods as indicated by the horizontal bars. The solution for the middle application (13–16 min) contained BSA (250 μm). The data are the means ±s.e.m. of 27 cells and are representative of 4 other experiments.
Quantitative determination of the Ca2+ source mediating the dodecanoic acid-induced rise in [Ca2+]i
In a previous study, we found that the L-type Ca2+ channel blocker nicardipine greatly diminished the dodecanoic acid-induced calcium rise in STC-1 cells (McLaughlin et al. 1998). In order to confirm that this was due to the blocking of Ca2+ entry from the extracellular medium, we pre-incubated both STC-1 and GLUTag cells in a Ca2+-free medium buffered with the chelating agent EGTA. Figure 6 demonstrates that the dodecanoic acid-induced rise in [Ca2+]i is mediated mostly by the influx of extracellular Ca2+, with the mean change in the [Ca2+]i peak being reduced from 146 ± 21 nM (control, mean ± s.e.m.) to 34 ± 10 nM (0 Ca2+ in bath) in STC-1 cells (Fig. 6A) and from 112 ± 16 nM (control) to 31 ± 11 nM (0 Ca2+ in bath) in GLUTag cells. The remaining response appears to be from intracellular stores, as both STC-1 and GLUTag cells pre-treated with the store-depleting agent thapsigargin showed no change in [Ca2+]i when exposed to dodecanoic acid in the absence of extracellular Ca2+. Likewise, when cells pre-treated with thapsigargin were exposed to dodecanoic acid in normal calcium-containing medium there was a reduction in the peak [Ca2+]i from the control values mentioned above to 119 ± 19 nM in STC-1 cells and 79 ± 2 nM in GLUTag cells (Fig. 6B). These experiments also demonstrate that the fatty acid-induced release of Ca2+ from intracellular stores and the Ca2+ influx from the extracellular space are independent and, therefore, that Ca2+ entry is not achieved through store-operated Ca2+ influx.
Figure 6.
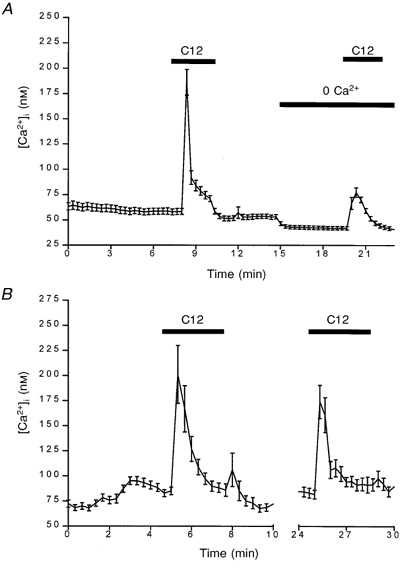
The influence of depleting extracellular Ca2+ (A) or intracellular Ca2+ stores (B) on C12-induced [Ca2+]i rise in STC-1 cells
The mean fluorescence ratio was acquired and calculated as described for Fig. 2. Extracellular Ca2+ was removed by placing cells in a 0 Ca2+ solution containing 0·2 mm EGTA, as indicated by the horizontal bar labelled 0 Ca2+. Stores were completely depleted by using thapsigargin (1 μm) and incubating the cells in a Ca2+-free medium for 7 min (achieved between axis break). The cells were then returned to normal Ca2+-containing medium prior to the second addition of dodecanoic acid. The data are the means ±s.e.m. of 24 cells (A) and 23 cells (B), respectively, and are representative of at least 3 other experiments.
Source of Ca2+ and chain length of fatty acid
We then examined whether the relative contributions of Ca2+ influx and Ca2+ release from stores is influenced by the differing chain length of the stimulating fatty acid. Figure 7 summarizes these experiments and shows that the relative contribution of Ca2+ influx versus Ca2+ release from stores was the same in both STC-1 and GLUTag cells when they were treated with 500 μm fatty acid of chain lengths 10, 12 and 14. Interestingly, pre-emptying the stores with thapisgargin does not have a significant effect on peak [Ca2+]i (Fig. 7A and B), but it does significantly decrease the area under the [Ca2+]i curve (Fig. 7C and D). This shows that removal of the stores component from the fatty acid-induced rise in [Ca2+]i results in a narrower peak with a height which is mostly unchanged. In addition, nicardipine was equipotent at diminishing the Ca2+ response in both cell lines and independent of the chain length of the fatty acid to which the cells were exposed (Fig. 7). In summary, these data show that the Ca2+ signal is independent of chain length (over the range C10-C14) and is similar in both enteroendocrine cell lines despite their different origins within the gastrointestinal (GI) tract.
Figure 7.
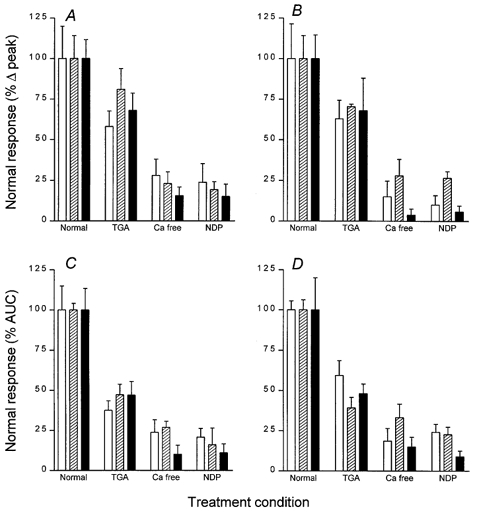
The fatty acid-induced change in [Ca2+]i is mostly mediated by an influx of extracellular Ca2+
A summary of fatty acid-induced [Ca2+]i changes in STC-1 cells (A and C) and GLUTag cells (B and D) following depletion of extracellular or intracellular Ca2+. Cells were exposed to C10 (□), C12 ( ) or C14 (▪) fatty acids, and changes in [Ca2+]i measured either as a change in the peak [Ca2+]i response (A and B) or as the area under the [Ca2+]i curve (AUC) (see Fig. 3B) that constitutes the peak response (C and D). These data were all normalized to the mean changes induced by the fatty acids in isotonic buffer (labelled ‘Normal’ on the abscissa and defined as 100 %). The treatment conditions shown are: cells which have had their stores depleted by pretreatment with 1 μm thapsigargin (labelled ′TGA′), cells which were exposed to fatty acid in a 0 Ca2+ medium buffered with 0·2 mm EGTA (labelled ‘Ca free’), or cells which have been treated with 10 μm nicardipine (labelled ‘NDP’). The columns represent the means ±s.e.m. of 4 individual experiments.
Permeation of dodecanoic acid into STC-1 and GLUTag cells
Assuming that fatty acids stimulate a specific signal transduction pathway, the question remains whether this involves a cell-surface receptor or whether the fatty acid is detected intracellularly. While the lipid partitioning coefficient of dodecanoic acid should be great enough to ensure its rapid entry into cells, such a process needs to be determined empirically because there is debate as to the role of facilitated versus passive transport in the movement of fatty acids into cells (Abumrad et al. 1998; Hamilton, 1998). In our experimental system, 50 μm dodecanoic acid rapidly entered both STC-1 and GLUTag cells (Fig. 8A and B), and appeared to accumulate within the cell to reach concentrations in the millimolar range (Fig. 8C and D). However, these experiments with radiolabelled dodecanoic acid do not preclude the possibility that the fatty acid is associating with the cell membrane rather than entering the cell. To settle this point, we examined the distribution of a fluorescently labelled analogue of dodecanoic acid using confocal microscopy as previously described (Elsing et al. 1995). Figure 9A shows a series of Z-plane light sections through STC-1 cells after 2 min incubation with 50 μm dodecanoic acid. It is clear from these micrographs that dodecanoic acid enters the cytosol and is not simply partitioning in the cell membrane.
Figure 8.
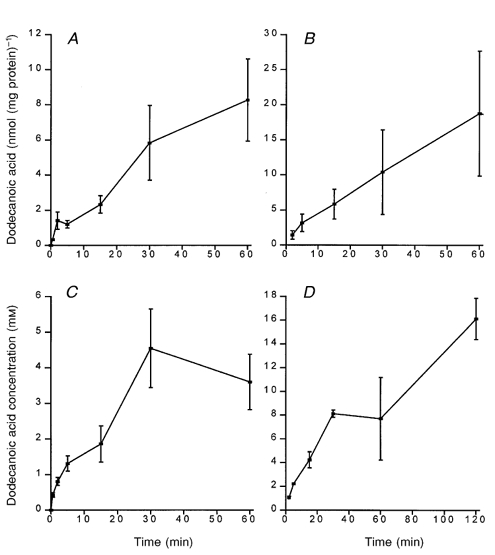
Dodecanoic acid rapidly associates with STC-1 and GLUTag cells
STC-1 cells (A and C) or GLUTag cells (B and D) were exposed to the dodecanoic acid solution (50 μm) for a period of 30 s to 120 min. The amount of dodecanoic acid or one of its metabolites associated with the cell pellet was normalized against total cellular protein and expressed as the amount of dodecanoic acid per milligram of protein. In C and D, the cellular concentration for dodecanoic acid has been estimated by using tritiated 3-O-methyl-glucose as an intracellular space marker (see Methods). Each data point represents the mean ±s.e.m. of 5, 7, 3 and 3 experiments for A, B, C and D, respectively.
Figure 9.
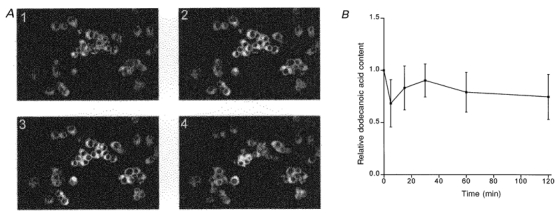
Dodecanoic acid rapidly and irreversibly enters STC-1 and GLUTag cells
A comprises four confocal micrographs showing the presence of dodecanoic acid inside STC-1 cells. Cells were loaded with bodipy-labelled dodecanoic acid (50 μm) for 2 min and then viewed using a BioRad MRC 600 confocal laser scanning microscope with a × 20 water immersion objective lens (see Methods). A Z-series of images was obtained using a minimum pinhole size. The four micrographs in the figure show dodecanoic acid staining at all depths within the cell. Micrograph 3 is near the cell centre and micrographs 2 and 1 are 5 and 10 μm, respectively, below this. Micrograph 4 is near the top of the cell, being 15 μm above micrograph 3. B illustrates the efflux of dodecanoic acid from STC-1 cells. Cells were loaded for 15 min with 50 μm dodecanoic acid, washed twice and transferred to an isotonic solution containing 1·5 % BSA. The amount of dodecanoic acid was calculated and normalized to the value of dodecanoic acid inside the cell measured just prior to placing the cells in the BSA wash solution (defined as ‘1.0′ on the ordinate). Data points represent the means ±s.e.m. of 3 experiments.
Since dodecanoic acid rapidly accumulates within the cell, and appears to be concentrated within it, we postulate that it is bound within the cell and so does not leave again once the external concentration is reduced to zero. Figure 9B is consistent with this hypothesis: the amount of dodecanoic acid remaining in the cell after 2 h of incubation in a fatty acid-free medium was never less than 60 % of that achieved during the loading period. Together these data indicate that, under our experimental conditions, dodecanoic acid rapidly permeates the cell membrane. Hence the receptor responsible for its detection could be located either at the cell surface or intracellularly.
Fatty acid metabolites are not responsible for the rise in [Ca2+]i
Fatty acids are rapidly metabolized inside the cell by mitochondrial β-oxidation. Therefore, it is possible that the fatty acid-induced [Ca2+]i rise is not primarily due to the fatty acid but rather to one of its metabolites. To address this possibility we examined the [Ca2+]i response in GLUTag and STC-1 cells exposed to the non-metabolizable fatty acid analogue 2-bromo-dodecanoic acid. Figure 10 demonstrates that 2-bromo-dodecanoic acid causes a rise in [Ca2+]i in both STC-1 (Fig. 10A) and GLUTag cells (Fig. 10B). Indeed, in both cell lines, 2-bromo-dodecanoic acid caused a larger, more prolonged increase in [Ca2+]i than normal dodecanoic acid. These data suggest that it is the dodecanoic acid itself, and not one of its metabolites, that is responsible for activation of the enterocyte signal transduction pathway.
Figure 10.
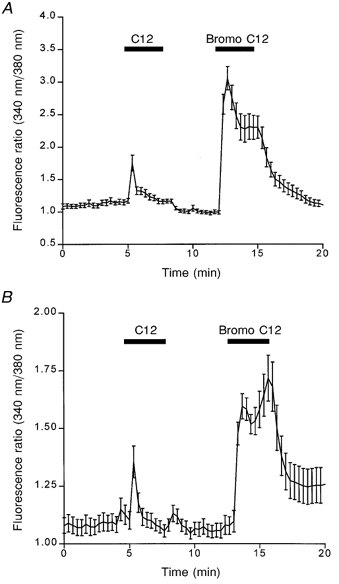
Metabolites of dodecanoic acid are not responsible for changes in [Ca2+]i
The effect of the non-metabolizable C12 fatty acid (2-bromo-dodecanoic acid; labelled ‘Bromo C12′) on [Ca2+]i in STC-1 cells (A) and GLUTag cells (B). Cells were exposed to dodecanoic acid (500 μm) and then 2-bromo-dodecanoic acid (500 μm) as indicated by the horizontal dose bars. The mean fluorescence ratio was acquired and calculated as described in Fig. 2. The data are the means ±s.e.m. of 21 and 26 cells for STC-1 and GLUTag cells, respectively, and are representative of 4 other experiments.
DISCUSSION
While the signal transduction pathways for many peptide, amide and steroid molecules have been determined, the actions of fatty acids on cells are still poorly understood. This is partly due to the difficulties of studying these molecules as they are poorly soluble in physiological solutions (Vorum et al. 1992).
In most studies, a carrier protein such as BSA is used in order to create a fatty acid aqueous solution. While such a system may be appropriate for the study of fatty acid interactions where the extracellular space is blood, it is not a good model for interaction within the lumen of the GI tract where fatty acids are solubilized by bile salts and our data clearly show that BSA eliminates any effect of fatty acids on enteroendocrine cells. Unfortunately, the use of bile salts to mimic the intestinal delivery of fatty acids to cultured cells is problematic because these agents act as detergents and so will tend to disrupt the integrity of the cell membrane.
Therefore, the method we have adopted involves the use of a fatty acid suspension which has been made homogeneous by sonication. This method is adequate for fatty acids with chain lengths up to C14. However, one potential difficulty with this method is the ease with which fatty acids are removed from solution by plastics, which can lead to anomalous results. So, for example, in our initial studies, it appeared that the rise in [Ca2+]i in STC-1 cells to a second fatty acid challenge was significantly less than the first. However, we subsequently discovered that this reflected a reduction in concentration of fatty acid as a result of binding to the plastic perfusion containers. The data presented in Fig. 2 were obtained by using fresh solutions for each stimulation.
The concentration of dodecanoic acid we used (500 μm) is greater than the solubility of the molecule in the presence of divalent cations. Filtering the solutions through filters of various pore sizes proved an unsuitable method for determining the size distribution of the insoluble particles because fatty acids associate with the filter membrane, even when completely in solution. Therefore, we used hydrodynamic particle sizing to determine the range of concentrations above which dodecanoic acid was becoming insoluble. We found that the particle size of dodecanoic acid increases rapidly above 50 μm, and at 100 μm the rate of sedimentation makes accurate hydrodynamic particle sizing impossible. This result suggests that the limit of solubility for dodecanoic acid is between 50 and 100 μm. We repeated this analysis with the other fatty acids and found, as expected, that the limit of solubility was inversely correlated to the chain length, with the longer chain fatty acids becoming insoluble at lower concentrations.
When these data were compared with the dodecanoic acid-induced Ca2+ and CCK responses in STC-1 and GLUTag cells, we found that only solutions above 100 μm were able to elicit an increase in [Ca2+]i. Likewise, only solutions above 200 μm were able to induce CCK secretion in both enteroendocrine cell lines. Furthermore, the correlation observed between CCK secretion, changes in [Ca2+]i and acyl chain length closely followed the limit of solubility for each fatty acid. Given that we observed no change in [Ca2+]i (Fig. 5) or significant CCK secretion (data not shown) when dodecanoic acid was presented in the presence of BSA, these data together suggest that enteroendocrine cells may not be responding to the monomeric form of fatty acids. Indeed, it is conceivable that enteroendocrine cells may be responding to fatty acid which is not in solution at all and that it is this insoluble component which is involved in the fatty acid signal transduction pathway. Two possible mechanisms by which the insoluble component could act are: (1) directly, by the cell sensing the presence of fatty acid particles of a certain size, (2) indirectly, by the insoluble component dissolving into the cell membrane (which is lipophilic) causing a change in membrane properties or stimulating a putative intracellular receptor.
An important question which needs to be addressed is whether fatty acids cause a rise in [Ca2+]i and CCK secretion through damage to the cell membrane. In our studies there is good evidence that fatty acids are not acting in this way. First, both trypan blue exclusion and lactate dehydrogenase release (McLaughlin et al. 1998) indicate that there is no gross cell damage at the dodecanoic acid concentrations used in this study. Second, there is no significant inhibition in the growth kinetics of STC-1 cells which have been exposed to dodecanoic acid (500 μm; authors’ unpublished observations). Third, the Ca2+ response to dodecanoic acid is both reversible and repeatable. Finally, the Ca2+ response is similar in two cell lines of different origin and the relative contribution of extracellular versus intracellular Ca2+ is conserved amongst fatty acids with chain lengths of 10–14 carbons. Together these data strongly implicate a specific signal transduction pathway for fatty acids.
It is still uncertain how fatty acids cross cell membranes (Abumrad et al. 1998; Hamilton, 1998). If fatty acid transport proteins are necessary for fatty acid transport into cells, and our cell models lack the necessary transport protein(s), we could eliminate the possiblity that detection of fatty acids by STC-1 and GLUTag cells begins intracellularly. Our data, however, indicate that dodecanoic acid rapidly and irreversibly enters the cell. Fluorescence microscopy indicated that even after a 3 s exposure to dodecanoic acid the fluorescent product could be seen throughout the cell (authors’ unpublished observations). Thus, these data do not allow us to eliminate the possibility that the signal transduction pathway for fatty acids begins intracellularly.
An interesting result from this study, clearly demonstrated by the confocal images, is the ability of dodecanoic acid to accumulate within the cell. While measurements of the intracellular space marker may underestimate the total intracellular space, the sheer magnitude of the dodecanoic acid concentration difference between the extracellular and intracellular space (a factor of ∼20) suggests that the fatty acid has been concentrated to a significant degree. The relative irreversibility of the loading also suggests this concentration difference may be due to binding and metabolism of dodecanoic acid within the cell.
It could be argued that the [Ca2+]i response is independent of fatty acid entry because the rise in [Ca2+]i is rapid and transient whereas fatty acid entry is rapid but irreversible. While this hypothesis is possible, it is equally plausible to envisage a pathway that is sensitive to transient changes in unbound dodecanoic acid. Such a model would predict that the application of dodecanoic acid would result in a transient change in the unbound intracellular dodecanoic acid pool which would quickly come to equilibrium as the free dodecanoic acid is bound and metabolized. While reapplication of dodecanoic acid a short time later would not lead to a significant change in total intracellular bound fatty acid, it could still cause another transient change in the free fatty acid pool and this change may invoke an elevation in [Ca2+]i and CCK secretion. The best way to address fully whether the fatty acid signal transduction pathway begins outside or inside the cell would be to construct a molecule which has a similar shape to carboxylic acids but which will not permeate the cell.
Because dodecanoic acid will be metabolized once it has entered the cell, the possibility exists that the cell is responding to a metabolite of dodecanoic acid rather than the fatty acid molecule itself. However, the chain length specificities of both the CCK and [Ca2+]i responses suggest that this is unlikely as metabolites of dodecanoic acid will have a shorter chain length. Furthermore, the ability of a non-metabolizable form of dodecanoic acid (2-bromo-dodecanoic acid) to evoke a Ca2+ response strongly supports the concept that dodecanoic acid itself and not a metabolite is being detected by the cell.
In conclusion, our studies demonstrate that the response of STC-1 and GLUTag cells to fatty acids is mediated by a signal transduction pathway which is sensitive to fatty acids of chain lengths greater than 9 carbon atoms. The fact that this pathway is also conserved in two cell lines derived from different locations within the GI tract indicates that it may be part of a general process for fatty acid responsiveness in enteroendocrine cells. The ensuing rise in [Ca2+]i is consistently mediated by the entry of extracellular Ca2+, with intracellular store release also playing a role. The fatty acid signalling pathway is not evoked by fatty acid metabolites but whether it begins at the cell surface or intracellularly remains to be determined.
Acknowledgments
We wish to thank Dr Christoph Elsing and Professor Wolfgang Stremmel (University of Heidelberg), Dr Tony Wade and Dr Grenham Ireland for their help with confocal microscopy, Dr Austin Elliott for advice on [Ca2+]i signalling and the use of his imaging system and Dr Malcolm Jones for his invaluable suggestions and assistance with particle sizing. This work was supported by a BBSRC grant (34/FO8146). Satjinder Sidhu is a MRC student.
References
- Abumrad N, Harmon C, Ibrahimi A. Membrane transport of long-chain fatty acids: evidence for a facilitated process. Journal of Lipid Research. 1998;39:2309–2318. [PubMed] [Google Scholar]
- Beardshall K, Frost G, Morarji Y, Domin J, Bloom SR, Calam J. Saturation of fat and cholecystokinin release. Lancet. 1989;ii:1008–1010. doi: 10.1016/s0140-6736(89)91017-9. [DOI] [PubMed] [Google Scholar]
- Benson RS, Heer S, Dive C, Watson AJ. Characterization of cell volume loss in CEM-C7A cells during dexamethasone-induced apoptosis. American Journal of Physiology. 1996;270:C1190–1203. doi: 10.1152/ajpcell.1996.270.4.C1190. [DOI] [PubMed] [Google Scholar]
- Bouras EP, Misukonis MA, Liddle RA. Role of calcium in monitor peptide-stimulated cholecystokinin release from perifused intestinal cells. American Journal of Physiology. 1992;262:G791–796. doi: 10.1152/ajpgi.1992.262.5.G791. [DOI] [PubMed] [Google Scholar]
- Drucker DJ, Jin T, Asa SL, Young TA, Brubaker PL. Activation of proglucagon gene transcription by protein kinase-A in a novel mouse enteroendocrine cell line. Molecular Endocrinology. 1994;8:1646–1655. doi: 10.1210/mend.8.12.7535893. [DOI] [PubMed] [Google Scholar]
- Elsing C, Winn-Börner U, Stremmel W. Confocal analysis of hepatocellular long-chain fatty acid uptake. American Journal of Physiology. 1995;269:G842–851. doi: 10.1152/ajpgi.1995.269.6.G842. [DOI] [PubMed] [Google Scholar]
- Grynkiewicz G, Poenie M, Tsien RY. A new generation of Ca2+ indicators with greatly improved fluorescence properties. Journal of Biological Chemistry. 1985;260:3440–3450. [PubMed] [Google Scholar]
- Guimbaud R, Moreau JA, Bouisson M, Durand S, Escourrou J, Vaysse N, Frexinos J. Intraduodenal free fatty acids rather than triglycerides are responsible for the release of CCK in humans. Pancreas. 1997;14:76–82. doi: 10.1097/00006676-199701000-00012. [DOI] [PubMed] [Google Scholar]
- Hamilton JA. Fatty acid transport: difficult or easy? Journal of Lipid Research. 1998;39:467–481. [PubMed] [Google Scholar]
- Higham A, Vaillant C, Yegen B, Thompson DG, Dockray GJ. Relation between cholecystokinin and antral innervation in the control of gastric emptying in the rat. Gut. 1997;41:24–32. doi: 10.1136/gut.41.1.24. [DOI] [PMC free article] [PubMed] [Google Scholar]
- Hopman WPM, Kerstens PJSM, Jansen JBMJ, Rosenbusch G, Lamers CBHW. Effect of graded physiologic doses of cholecystokinin on gallbladder contraction measured by ultrasonography. Gastroenterology. 1985;89:1242–1247. doi: 10.1016/0016-5085(85)90639-0. [DOI] [PubMed] [Google Scholar]
- Isaacs PF, Lardas S, Forgacs IC, Dowling RH, Ellam SL, Adrian TC, Bloom SR. Comparison of effects of ingested medium- and long-chain triglycerides on gallbladder volume and release of cholecystokinin and other gut peptides. Digestive Diseases and Sciences. 1987;32:451–480. doi: 10.1007/BF01296030. [DOI] [PubMed] [Google Scholar]
- Liddle RA. Cholecystokinin cells. Annual Review of Physiology. 1997;59:221–242. doi: 10.1146/annurev.physiol.59.1.221. [DOI] [PubMed] [Google Scholar]
- Liddle RA, Morita ET, Conrad CK, Williams JA. Regulation of gastric emptying in humans by cholecystokinin. Journal of Clinical Investigation. 1986;72:992–996. doi: 10.1172/JCI112401. [DOI] [PMC free article] [PubMed] [Google Scholar]
- McLaughlin J, Luca MG, Jones MN, Dockray GJ, Thompson DG. Fatty acid chain length determines CCK secretion and different effects on proximal and distal gastric motility. Gastroenterology. 1999;116:46–53. doi: 10.1016/s0016-5085(99)70227-1. [DOI] [PubMed] [Google Scholar]
- McLaughlin JT, Lomax RB, Hall L, Dockray GJ, Thompson DG, Warhurst G. Fatty acids stimulate cholecystokinin secretion via an acyl chain length-specific, Ca2+-dependent mechanism in the enteroendocrine cell line STC-1. The Journal of Physiology. 1998;513:11–18. doi: 10.1111/j.1469-7793.1998.011by.x. [DOI] [PMC free article] [PubMed] [Google Scholar]
- Sharara AI, Bouras EP, Misukonis MA, Liddle RA. Evidence for indirect dietary regulation of cholecystokinin release in rats. American Journal of Physiology. 1993;265:G107–112. doi: 10.1152/ajpgi.1993.265.1.G107. [DOI] [PubMed] [Google Scholar]
- Smith GP, Gibbs J. Satiating effect of cholecystokinin. Annals of the New York Academy of Sciences. 1994;713:236–241. doi: 10.1111/j.1749-6632.1994.tb44071.x. [DOI] [PubMed] [Google Scholar]
- Undenfriend S, Stein S, Bohlen P, Diarman W, Leimgruber W, Weigele M. Fluorescamine: A reagent for assay of amino acids, peptides, proteins and primary amines in the picomol range. Science. 1972;178:871–872. doi: 10.1126/science.178.4063.871. [DOI] [PubMed] [Google Scholar]
- Vorum H, Brodersen R, Kragh-Hansen U, Pedersen AO. Solubility of long-chain fatty acids in phosphate buffer at pH 7.4. Biochimica et Biophysica Acta. 1992;1126:135–142. doi: 10.1016/0005-2760(92)90283-2. [DOI] [PubMed] [Google Scholar]