Abstract
This is a validation study of 2 commercially available enzyme linked immunosorbent assays (ELISA) for the detection of antibodies against Neospora caninum in bovine serum. The results of the reference sera (n = 30) and field sera from an infected beef herd (n = 150) were tested by both ELISAs and the results were compared statistically. When the immunoblotting results of the reference bovine sera were compared to the ELISA results, the same identity score (96.67%) and kappa values (K) (0.93) were obtained for both ELISAs. The sensitivity and specificity values for the IDEXX test were 100% and 93.33% respectively. For the Biovet test 93.33% and 100% were obtained. The corresponding positive (PV+) and negative predictive (PV−) values for the 2 assays were 93.75% and 100% (IDEXX), and 100% and 93.75% (Biovet). In the 2nd study, competitive inhibition ELISA (c-ELISA) results on bovine sera from an infected herd were compared to the 2 sets of ELISA results. The identity scores of the 2 ELISAs were 98% (IDEXX) and 97.33% (Biovet). The K values calculated were 0.96 (IDEXX) and 0.95 (Biovet). For the IDEXX test the sensitivity and specificity were 97.56% and 98.53%, whereas for the Biovet assay 95.12% and 100% were recorded, respectively. The corresponding PV+ and PV− values were 98.77% and 97.1% (IDEXX), and 100% and 94.44% (Biovet). Our validation results showed that the 2 ELISAs worked equally well and there was no statistically significant difference between the performance of the 2 tests. Both tests showed high reproducibility, repeatability and substantial agreement with results from 2 other laboratories. A quality assurance based on the requirement of the ISO/IEC 17025 standards has been adopted throughout this project for test validation procedures.
Introduction
Neospora caninum is a protozoan parasite that was first isolated from the tissue of paralyzed dogs (1). Neosporosis is now one of the most important parasitic diseases found in many ruminant species world wide, and is a major cause of abortion in cattle (2). The parasites cause encephalomyelitis in congenitally infected calves (3). Vertical transmission of this parasite in dairy cattle has been shown to be highly efficient and is a major route of transmission (4). Neonatal mortality and morbidity in cattle have a huge economic impact on cattle producers (5). Seroprevalence rates of Neospora of about 50 to 60% have been reported in dairy herds in Quebec (6,7), whereas, seroprevalence values of 9.0 to 13.5% in beef cattle in northern Alberta were found in a recent study (8). Neospora caninum infection is an animal production limiting disease in cattle in Canada. There is a need to understand the prevalence of this parasitic disease in cattle and future epidemiology studies will require the use of an accurate and reliable laboratory test.
Generally, the diagnosis of N. caninum associated abortion has relied on the histological examination of infected fetuses (9). Other methods used to study Neospora include isolation of the parasites in cell culture (10), an indirect fluorescent antibody test on various body fluids (11), immunoblotting analysis (12), immunohistochemistry (13) and a variety of enzyme linked immunosorbent assays (ELISA) (14,15,16). A sero-epidemiological approach using ELISA to diagnose Neospora in cattle has been successful (17). By using ELISA, we have demonstrated long term stability of high antibody levels to the parasite in beef cattle (18). Serologic testing provides a competitive cost advantage over other tests. Of the different serologic assays, ELISA is the most suitable for high throughput screening of antibodies to this parasite.
This paper describes the validation of 2 commercially available ELISAs and compares their performance characteristics using 2 sets of sera. In this study, we used the serum validation protocols applied to another of our tests which has received ISO 17025 accreditation.
Materials and methods
ELISAs
Two commercially available ELISAs for the detection of bovine antibodies against N. caninum, Neospora caninum kit (Biovet Inc., St. Hyacinthe, Quebec, Canada) and Neospora caninum Antibody Test Kit (IDEXX Inc., Westbrook, Maine, USA), were purchased and assayed as indicated by the manufacturer's instructions. The names of these 2 different ELISAs are abbreviated in this paper as Biovet ELISA and IDEXX ELISA, respectively.
Both Biovet ELISA and IDEXX ELISA plates come in detachable 8 well strips for convenient usage. The positive and negative control sera from both ELISAs were in buffer with protein stabilizers and preserved with sodium azide. The wash solution and dilution buffer were included in both kits. Wash solutions required diluting prior to testing and double glass distilled water was used. Ready to use anti bovine IgG horseradish peroxidase conjugate solutions were supplied in both ELISA kits. The substrate solution consisted of hydrogen peroxide (H2O2) and the chromogen 2-2′ azino-di- (3 ethyl benzothiazolin sulfone-6) diammonium salt. It was diluted before using for the Biovet ELISA. In the IDEXX ELISA, H2O2 was used as the substrate along with the chromogen 3,3′, 5,5′ tetramethylbenzidine. No stop solution was used with the Biovet ELISA kit whereas dilute hydrofluoric acid, 0.125% was used in the IDEXX kit. The optical density (OD) values were measured using a spectrophotometer at 405 nm (Biovet ELISA) and 650 nm (IDEXX ELISA). With the Biovet ELISA, the mean OD values of the control (OD+) and test sample sera (ODs) were recorded. The ratios of ODs/OD+ were then calculated. With the IDEXX ELISA, the mean OD values of both the positive and negative controls and test sera were recorded. The sample to positive ratio (S/P) was calculated using the formula below:
 |
For quality assurance, during test validation of the 2 ELISAs, test-specific critical control points (CCPs) were established. They were similar for both tests unless stated otherwise:
CCP 1 — Test sera must be free from contamination and hemolysis. If suspended cells were apparent in the serum, the sample tube was centrifuged at 1500 rotations per minute (rpm) for 15 min to separate the serum from the cells. Badly hemolyzed and/or contaminated sera were discarded.
CCP 2 — Kits must perform according to manufacturer's specifications. No expired products were used. All controls and reagents had to be of good quality and sufficient quantity. No intermix components from different lot numbers were used.
CCP 3 — The Biovet ELISA, N. caninum antigen coated 96-well microplate was stored at −20°C to minimize the loss of antigenic activity whereas the IDEXX ELISA 96-well microplate coated with the N. caninum antigen was kept at 4 to 8°C to preserve its antigenicity.
CCP 4 — All ELISA steps were performed at 22 to 23°C and reagents were adjusted to room temperature before the test. This ensured that the optimal temperature of the 2 ELISAs was met.
CCP 5 — All reagents were prepared fresh before each test to avoid deterioration due to storage or precipitation.
CCP 6 — The antigen coated microplate was not allowed to dry up between wash steps and prior to addition of conjugate to ensure the integrity of the antigen-antibody complex.
CCP 7 — All reservoirs for holding dilution buffers and reagents were washed and autoclaved before use to avoid interference of the specific reactions between antigen-antibody-conjugate substrate.
CCP 8 — All pipettes were calibrated before the ELISAs to ensure correct volumes were used.
CCP 9 — The ELISA reader was calibrated before testing to ensure correct OD values were obtained. The plates were read with a Vmax ELISA reader (Molecular Device Corporation, Sunnyvale, California, USA) at a wavelength of 405 nm or 650 nm (Biovet and IDEXX, respectively).
CCP 10 — The proper number and conditions of the wash steps were used to eliminate non-specific reactions and facilitate proper binding of the complex.
CCP 11 — Test serum pre-dilution steps were performed in a non-protein binding microplate to ensure that there was no artificial removal of antibodies.
CCP 12 — For the Biovet ELISA, the OD of the positive control had to be above 0.5. The optimal ratio between the negative control serum (N) and the positive control serum (P); (OD−/OD+) was between 0.2 to 0.3. For the IDEXX ELISA, the OD of P must be 0.4 ± 2 SDmean and N had to be equal to 0.15 ± 2 SDmean. The optimal difference (P − N) was to be greater than or equal to 0.15.
Reference sera
The positive and negative reference sera (n = 30) were obtained from California Veterinary Diagnostic Laboratory System (CVDLS) (University of California, Davis, California, USA). They were prepared from Neospora positive and negative cows of similar age. For the 15 negative serum group, the cows had continuously given birth to Neospora negative calves. All of them had been confirmed negative by immunoblotting analysis. During pregnancy these high health animals were housed separately and prevented from possible infection by Neospora. For the 15 positive serum group, the cows were confirmed positive for Neospora by immunoblotting analysis. The animal either aborted a confirmed positive fetus or gave birth to a congenitally infected calf. The reference sera were tested by ELISA in CVDLS laboratory again to confirm their results before duplicate serum samples were sent to our laboratory. The sample identities were encrypted and were unknown to the laboratory diagnosticians throughout the project to avoid any testing bias.
Cut off values
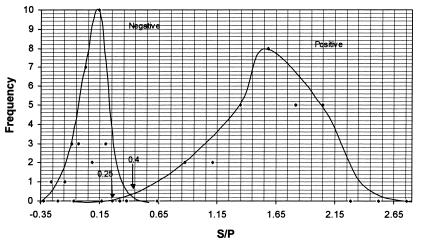
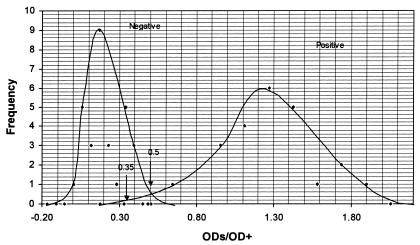
Frequency distribution curves of the positive sera (n = 15) and negative sera (n = 15) tested by the IDEXX and Biovet ELISA were constructed. The x-axis was scaled to include either the S/P ratios (IDEXX) or ODs/OD+ values (Biovet) of the positive and negative control sera pair of the respective ELISA. The y-axis was scaled to accommodate the frequency distribution number of the positive and negative control sera. Two sets of bell-shaped curves were drawn which included the mean, ± 1 SD, ± 2 SD and ± 3 SD regions. If the 2 curves did not overlap (a perfect test), then the point equidistant from the positions which represented + 3 SD from the negative serum control mean and − 3 SD from the positive serum control mean was taken as the cut-off value. If the 2 curves did overlap each other then their intercept point was taken as the cut-off value (Figures 1 and 2). On either side of the cut-off line were the regions of false negative (left-hand side) and false positive (right-hand side) results. Moving the cut-off line to either side would affect the diagnostic sensitivity and specificity of the 2 ELISAs. Increasing the diagnostic sensitivity will result in a decrease of the diagnostic specificity and vice versa.
Figure 1. Frequency distribution curve of the positive and negative reference sera tested with IDEXX ELISA.
S/P — sample to positive ratio.
Figure 2. Frequency distribution curve of positive and negative reference sera tested by the Biovet ELISA.
ODs — test sample sera
OD+ — optical density control
Repeatability
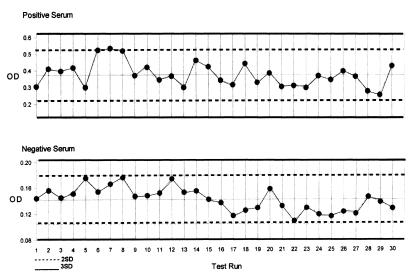
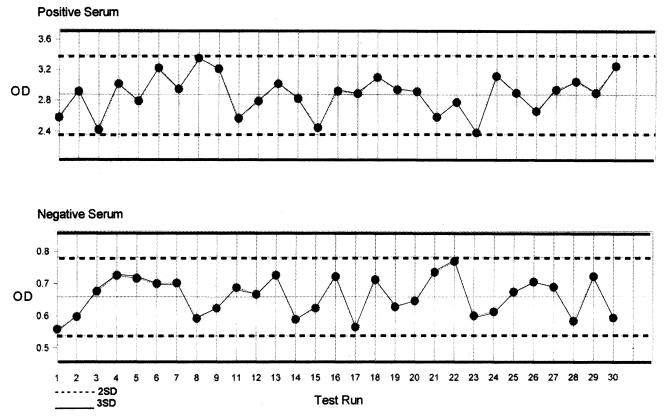
In order to determine the run-to-run variation of the 2 ELISAs, the commercial positive control serum from each kit of the 2 ELISAs was tested. A total of 30 pairs of control sera from each kit were tested over a period of 2 to 4 wk. The results were examined using a Levey-Jennings control chart. The mean and SD OD values of the control serum from 30 individual measurements were plotted. The chart was constructed by scaling the x-axis to accommodate the 30 runs' data, and scaling the y-axis to include a range from the mean + 3 SDmean to the mean − 3 SDmean. Lines representing the mean, mean ± 2 SDmean, and mean ± 3 SDmean were drawn on the chart. All 30 measurements were plotted directly on the chart. The same procedure was followed for the negative control serum from each ELISA. Using the 4 charts the agreement between replicates and the amount of between-run agreement for each control serum were analyzed. The ELISA was considered repeatable if the variation of each of the 30 positive and 30 negative control OD values was within ± 2 SD of the mean of the individual runs.
Reproducibility
To further validate the 2 ELISAs, an interlaboratory proficiency test was carried out. Randomly collected bovine sera (n = 150) from a Neospora infected beef herd in Alberta of approximately 250 animals were first tested by a competitive inhibition ELISA by the Animal Health Monitoring Laboratory (AHML), accredited by the Society of American Association of Veterinary Laboratory Diagnosticians. (AAVLD). The sera were then tested by the 2 ELISAs in our laboratory. The sample identities were encrypted and were unknown to the laboratory diagnosticians throughout the project to avoid any testing bias. The results were compared in a 2-by-2 table. The prevalence rate of positive serologic reactors of this herd was estimated to be approximately 10% (18). The minimum sample size from an infected herd required to achieve a mandatory precision of 95%, was calculated to be equal to 144 (19). The number of field sera actually sampled in the study was 150. In order to measure the agreement between the 2 ELISAs' to the other test, the K quotient calculation and identity score percentage were used. A 2-by-2 table was constructed to compare the data.
Assay performance characteristics
The results of the 2 ELISAs were compared to the immunoblotting analysis results of the reference sera and the c-ELISA results of the field sera using 2-by-2 tables. The immunoblotting analysis and c-ELISA were used as the standard tests and the 2 ELISAs were treated as new measurements (20). The numbers of true positive, false positive, false negative, and true negative were identified (Table I). The diagnostic sensitivity and specificity were determined accordingly. Using these tables, the positive and negative predictive values of the ELISAs were also calculated. The formulas used to calculate the sensitivity, specificity and predictive values have been published (20). The calculated results depended on the number of exact matches between the standard and new test measurements.
Table I.
Results
Using the frequency distribution curves the cut off values for both ELISAs were determined. For the IDEXX ELISA any serum with a S/P ratio greater than 0.4 was designated as a positive. If the S/P ratio was between 0.25 and 0.4, the serum was considered to be a suspect positive or false negative sample which had specific antibodies but not enough to be designated as positive (Figure 1). For the Biovet ELISA, an OD/OD+ result greater than or equal to 0.5 was considered positive and a result less than 0.35 was considered negative. Samples with results between 0.35 and 0.5 were considered to be suspect positive or false negative sera (Figure 2). For both tests, this equivocal result has to be confirmed by repeating the test. It would be classified as negative for Neospora antibodies if the repeated results were still less than the positive cut-off values.
Examining the Levey-Jennings control charts for the 2 ELISAs, we can study the repeatability of these assays. The commercial positive and negative controls from both ELISAs were shown to have little variance between 30 individual runs during a period of 2 to 4 wk. (Figures 3 and 4). The OD values of all the controls fell within ± 2 SD of the long term positive mean or negative mean respectively. This indicated that both ELISAs were able to be run with precision. Since the results came from testing 30 different sets of controls, the inter-plate or run variability was small and fell in an acceptable range.
Figure 3. Levey-Jennings control chart of the positive and negative control sera tested by the IDEXX ELISA.
OD — optical density
Figure 4. Levey-Jennings control charts of the positive and negative control sera tested by the Biovet ELISA.
OD — optical density
SD — standard deviation
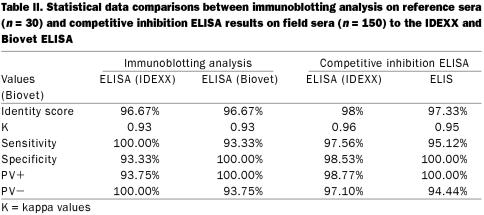
Using the data of the reference sera study and the field sera study, the 2 ELISAs were compared (Table I). In the comparison between the immunoblotting results and the IDEXX ELISA results of the 30 reference sera, 15 positive sera and 14 negative sera were a match; 1 false positive was detected. Upon comparing the Biovet ELISA and immunoblotting results for the reference sera, 14 positive sera and 15 negative sera matched, while 1 false negative was found. The statistical data comparisons between the immunoblotting results and the Edmonton ELISA results from both the IDEXX and Biovet kits were compiled. The same identity score of 96.67% and a K value of 0.93 was obtained for both ELISAs (Table II).
Table II.
Of the 150 field sera, there was 1 false positive and 2 false negative results when the IDEXX ELISA was compared to the c-ELISA results (Table I). Eighty positive sera and 67 negative sera matched exactly. When the Biovet ELISA was compared to the c-ELISA for the 150 field sera, there were 4 false negative results. Seventy-eight positive sera and 68 negative sera matched. The c-ELISA results and the results from Edmonton using both the IDEXX and Biovet kits were compared. For the IDEXX kit, the calculated identity score of 98% and a K value of 0.96 between the 2 tests was obtained, whereas, for the Biovet kit the calculated identity score was 97.33% and the K value was 0.95 comparing between the 2 tests (Table II).
In the reference sera study, the sensitivity (100%) and specificity (93.33%), and the PV+ (93.75%) and PV− (100%) of the IDEXX ELISA were recorded, whereas using the Biovet ELISA sensitivity (93.33%) and specificity (100%), PV+ (100%) and PV− (93.75%) were found (Table II). The efficacy of the 2 tests was comparable. They had the same identity score and K values. Both ELISAs had good sensitivity and specificity, with the IDEXX kit being more sensitive and the Biovet kit being more specific. The IDEXX kit had a higher PV− value whereas the Biovet kit had a higher PV+ value. Their performance characteristics were similar and their differences were statistically insignificant. The performance characteristics of the 2 ELISAs were also very similar statistically using field serra. In the field sera study for the IDEXX ELISA sensitivity (97.56%), specificity (98.53%), PV+ (98.77%) and PV− (97.1%) were calculated, whereas for the Biovet ELISA sensitivity (95.12%), specificity (100%) PV+ (100%) and PV− (94.44%) values were obtained. With the IDEXX ELISA, 80 positive reactors were identified out of a total of 150 animals, indicating the apparent prevalence of N. caninum in this herd was 53%. Based on 78 positive results using the Biovet ELISA, the apparent prevalence rate in the beef herd was 52% (Table I). The difference between the 2 estimations of the apparent prevalence value was small.
Discussion
The ability to purchase cattle free from N. caninum infection is economically beneficial to the cattle industry in Canada since this is a production limiting disease. Testing of cattle must be performed with valid assays or no assurance of infection status can be established (19). The first and foremost requirement for laboratory diagnosis of N. caninum infection is a properly validated assay. The 2 commercial ELISAs are licensed products. They have already met certain regulatory standards, but laboratory diagnosticians still have to thoroughly validate these tests themselves. In order for an assay to be recognized as repeatable, reproducible, precise, and even accurate a quality assurance system should be in place for monitoring the assays. Proper test validation is one major requirement for laboratory accreditation based on an internationally recognised standard, 1SO/IEC 17025 guidelines. On the other hand, although laboratory accreditation is one mechanism for addressing this issue, there is a need for the accredited laboratories to assure their clients that they have consistently included internal control measures such as monitoring the assay using Levey-Jennings charts when the test was being used.
In this study we have shown that both ELISAs are repeatable and reproducible. The ELISAs were also precise and accurate using the reference serum as comparison standard. However, accuracy is a term that is relative to the “standard of comparison” upon which the assay was based. If the standard is not valid, then the assay likewise is not valid. The reference sera we obtained from CVDLS were used as the “gold standard” in the test validation of the 2 ELISAs. These sera were prepared from cattle confirmed infected and non-infected with N. caninum and were be taken as “accurate” results.
Based on the reference sera comparison data, we have established cut-off values for the 2 ELISAs. Using these values we were able to provide a test result that identified animals as positive or negative, and by inference correctly predicted the Neospora infection status of positive and negative animals. However, ELISA validation is a complex process that does not end with experiments based on a few reference samples. The process also requires verification of application of the assay to a large number of reference animals that fully represent all variables in the population targeted by the assay. In our interlaboratory proficiency testing using field serum samples, there was a probable level of reactors to the parasite of over 50% from the infected herd. Since both the sensitivity and specificity values of the 2 ELISAs were all greater than 95%, the apparent infection prevalence would be similar to the the true infection prevalence according to the Rogan-Gladen estimator (21). However the probable level of reactors was higher than first anticipated, from an estimated level 10% to an actual level of 50%, a bigger sample size of approximately 400 samples should be tested. This could provide the interpretation of the data in a more statistically relevant context (19,20). This degree of statistical uncertainty could be a major limitation on a seroprevalence study. However since the field samples were collected from a herd of approximately 250 animals, the required sample size was calculated to be around 150 (20). For our purpose of establishing an interlaboratory proficiency test to compare ELISA results, the number of sera used was adequate.
Our data showed that both the Biovet and IDEXX ELISA kits produced results that correlated very well with the CVDLS immunoblotting results. Both also compared well in the field trial with the c-ELISA. This was demonstrated by the identity score test results and the K values obtained. The K quotient has taken into account the chance agreement and observed agreement values to ensure chance would not be a limiting factor for the test validation of the 2 ELISAs The sensitivity, specificity and predictive values of the 2 ELISA tests were above 90%. These performance characteristics make them useful for screening antibodies to Neospora caninum in bovine serum in Canada. Throughout this study in order to validate the 2 ELISAs, CCPs were established to ensure a quality assurance system.
Footnotes
Acknowledgments
The authors thank Dr. S. Hietala for giving us the reference sera. We also thank Mr. Lester SY Wong for helping the statistical analysis of the data in this study.
Address correspondence and reprint requests to J.T.Y. Wu, telephone: 780-427-8324, fax: 780-415-4527; e-mail: jwu@gov.ab.ca
Received February 13, 2002. Accepted June 12, 2002.
References
- 1.Dubey JP, Carpenter JL, Speer CA. Newly recognized fatal protozoan disease of dogs. J Am Vet Med Assoc 1988;192: 1269–1285. [PubMed]
- 2.Dubey JP, Lindsay DS. A review of Neospora caninum and neosporosis. Vet Parasitol 1996;67:1–59. [DOI] [PubMed]
- 3.Lindsay DS, Dubey JP, Cole RA, Nuehring LP, Blagburn BL. Neospora-induced protozoal abortions in cattle. Comp Cont Ed Pract Vet 1993;15:882–888.
- 4.Anderson ML, Reynolds JP, Rowe JD, et al. Evidence of vertical transmission of Neospora sp. infection in dairy cattle. J Am Vet Med Assoc 1997;210:1169–1172. [PubMed]
- 5.Pare J, Thurmond MC, Hietala SK. Congenital Neospora caninum infection in dairy cattle and associated calfhood mortality. Can J Vet Res 1996;60:133–139. [PMC free article] [PubMed]
- 6.Pare J, Fecteau G, Marsolais G, Fortin M. Sero-epidemiology of Neospora caninum in Quebec dairy herds. Proceedings CVMA/ACMV, Charlottetown 1996:464.
- 7.Bergeron N, Fecteau G, Pare J, Martineau, R, Villeneuve A. Vertical and horizontal transmission of Neospora caninum in dairy herds in Quebec. Can Vet J 2000;41:464–467. [PMC free article] [PubMed]
- 8.Waldner CL, Henderson J, Wu JTY, Coupland R, Chow EYW. Seroprevalence of Neospora caninum in beef cattle in northern Alberta. Can Vet J 2001;42:130–132. [PMC free article] [PubMed]
- 9.Schares G, Rauser M, Zimmer K, et al. Serological differences in Neospora caninum-associated epidemic and endemic abortions. J Parasitol 1999;85:688–694. [PubMed]
- 10.Lindsay DS, Speer CA, Toivio-Kinnucan MA, Dubey JP, Blagburn BL. Use of infected culture cells to compare ultrastructural features of Neospora caninum from dogs and Toxoplasma gondii. Am J Vet Res 1993;54:103–106. [PubMed]
- 11.Pare J, Hietala SK, Thurmond MC. Interpretation of an indirect fluorescent antibody test for diagnosis of Neospora sp. infection in cattle. J Vet Diag Invest 1995;7:273–275. [DOI] [PubMed]
- 12.Schares G, Peters M, Wurm R, Barwald A, Conraths FJ. The efficiency of vertical transmission of Neospora caninum in dairy cattle analysed by serological techniques. Vet Parasitol 1998;80: 87–98. [DOI] [PubMed]
- 13.Lindsay DS, Dubey JP. Immunohistochemical diagnosis of Neospora caninum in tissue sections. Am J Vet Res 1989;50: 1981–1983. [PubMed]
- 14.Pare J, Hietala SK, Thurmond MC. An enzyme-linked immunosorbent assay (ELISA) for serological diagnosis of Neospora sp. infection in cattle. J Vet Diag Invest 1995;7:352–359. [DOI] [PubMed]
- 15.Dubey JP, Jenkins MC, Adams DS, et al. Antibody responses of cows during an outbreak of Neosporosis evaluated by indirect fluoresecent antibody test and different enzyme-linked immunosorbent assays. J Parasitol 1997;83:1063–1069. [PubMed]
- 16.Williams DJL, Davison HC, Helmick B, et al. Evaluation of a commercial ELISA for detecting serum antibody to Neospora caninum in cattle. Vet Rec 1997;145:571–575. [DOI] [PubMed]
- 17.Reichel MP, Drake JM. The diagnosis of Neospora abortions in cattle. New Zealand Vet J 1996;44:151–154. [DOI] [PubMed]
- 18.Waldner CL, Henderson J, Wu JTY, Breker K, Chow EYW. Reproductive performance of a cow-calf herd following a Neospora caninum-associated abortion epidemic. Can Vet J 2001;42:355–360. [PMC free article] [PubMed]
- 19.Jacobson RH. Validation of serological assays for diagnosis of infectious diseases. Rev Sci Tech Off Int Epiz 1988;17:469–486. [DOI] [PubMed]
- 20.Martin SW, Meek AH, Willeberg P. Veterinary Epidemiology, Principles and Methods. Iowa State University Press/Ames 1987:pp.22–75.
- 21.Rogan WJ, Gladen B. Estimating prevalence from the results of a screening test. Am J Epidemiol 1978;107:71–76. [DOI] [PubMed]


