

Abstract
Ca2+ sparks were monitored by confocal laser-scanning microscopy of fluo-3 at video rates, in fast twitch muscle fibres, stimulated by exposure to caffeine and/or low [Mg2+]. Scanning was in two spatial dimensions (‘2D’) or 2D plus time, at 4 ms per image frame. Sparks were identified in 2D images of normalized fluorescence by an automatic procedure, which also evaluated the event’s location and morphometric parameters.
Most sparks were circular, but some were elongated, especially in caffeine. Separation of the spark from circular symmetry was quantified by its eccentricity (length/width – 1).
In an internal solution with 0·4 mM [Mg2+], sparks (989 events in 4 cells) had amplitude 0·73, width 1·94 μm, length 2·12 μm and eccentricity not significantly different from 0. Upon application of 1 mM caffeine, length (of 2578 events in the same cells) increased significantly (by 0·41 μm, or 19 %), width increased by 0·18 μm (9 %) and amplitude decreased slightly. The eccentricity became significantly different from 0, and the sparks’ long axis predominantly oriented parallel to the plane of the Z disks.
More than 10 % of the events in caffeine had length greater than 4 μm, a relatively flat top, and a sharp termination at both ends of the major axis. Additionally, there was only a weak correlation between eccentricity and amplitude. These properties suggest that the elongated events are produced by simultaneous opening of multiple channels within a junction, rather than anisotropic diffusion of Ca2+ or random overlap of round sparks.
Elongated events often increased in eccentricity early in their evolution. Then, most remained elongated during their rise and decay, while others spread spatially in the plane of the Z disks. In 1–2 % of the events, the centre of mass migrated in space, over time, at ≈0·1 μm ms−1.
These spatio-temporal features require the involvement of multiple release channels, at spatially resolvable locations. Because sources often spread over distances greater than 1 or 2 μm, and arrays of junctional elements (couplons) are at most 1·2 μm long, it must be possible for activation of release to propagate between neighbouring couplons, especially under the influence of caffeine and/or low [Mg2+].
The process of Ca2+ release for contractile activation in striated muscle requires that dihydropyridine receptors in the transverse tubules sense the action potential, and transduce it to opening of the sarcoplasmic reticulum Ca2+ channels (review by Leong & MacLennan, 1999). In amphibian skeletal muscle, Ca2+ sparks (Cheng et al. 1993; Tsugorka et al. 1995) constitute a distinctive, and apparently dominant form of Ca2+ release (Klein et al. 1996). Although sparks require Ca2+ as mediator (Klein et al. 1996; Shirokova & Ríos, 1997; González et al. 2000a), little else is known about their mechanism (e.g. Niggli, 1999; Shirokova et al. 1999; Schneider, 1999). Our recent work (González et al. 2000a,b) provided evidence that spark sources involve multiple channels, presumably some or all of the channels in a couplon (junctional array of release channels; Stern et al. 1997; Franzini-Armstrong et al. 1999). If this is the case, then spark sources must be extensive, rather than punctual, and sparks may be asymmetric, not spherically symmetric as they are often assumed to be (e.g. Ríos et al. 1999).
Until now, two-dimensional spatial properties of sparks have been explored by line scanning successively in two directions (Cheng et al. 1996), a method that does not yield two-dimensional information on individual events. (Such information is present, but not systematically analysed, in images of Tanaka et al. 1997.) We reported a sizable increase in spark width under caffeine, using line scanning parallel to the fibre axis (González et al. 2000a). This direction is roughly perpendicular to the long axis of the couplon, and hence especially unsuitable for exploring spatial aspects of the sources. To test the possible involvement of extended arrays of channels in spark generation it is necessary to simultaneously monitor the events in two spatial directions.
We now take advantage of the speed of a video-rate laser-scanning confocal system to study for the first time the properties of skeletal muscle Ca2+ sparks in two dimensions of space, and follow the evolution of such images in time. It becomes apparent that caffeine, which increases the sensitivity of release channels to stimulation by Ca2+ (e.g. Herrmann-Frank et al. 1999), causes sparks to grow in the direction of the junctional arrays of release channels.
METHODS
Experiments were carried out in cut skeletal muscle fibres from the semitendinosus muscle of Rana pipiens. Following a protocol approved by our Institutional Animal Care and Use Committee, adult frogs were anaesthetized in 15 % ethanol, then killed by pithing. Fibres were mounted on the stage of an inverted microscope with a video-rate confocal scanner (RCM8000, Nikon Inc., Melville, NY, USA; Tsien, 1990; Kawanishi et al. 1994; Lacampagne et al. 1999).
The experiments were carried out in permeabilized cells, using methods derived from those of Lacampagne et al. (1998), described in detail by Ríos et al. (1999). Cells were stretched to between 3·2 and 3·6 μm per sarcomere and immersed in a solution with low [Mg2+], which elicited sparks at a frequency of ∼15 per image. The solution, adjusted to pH 7 and 260 mosmol kg−1, contained (mM): 100 caesium glutamate, 1 EGTA, 5 glucose, 5 phosphocreatine, 10 Hepes, 5 Mg-ATP, 0·1 fluo-3 (Molecular Probes, Eugene, OR, USA), with added calcium for a nominal [Ca2+] of 100 nM, 0·25 mM MgCl2 (0·41 mM nominal [Mg2+]), plus 8 % (40000 kDa) dextran. Temperature was 17–19°C.
Excitation light of an argon-ion laser (Enterprise 621, Coherent, Santa Clara, CA, USA) was selected by a 505 nm dichroic mirror and emitted light by a 515 nm long pass filter. Imaging used a ×40, 1·15 NA water immersion objective (CF UV, Nikon). Scanning, in two dimensions, proceeded first along what we define as the y direction, presented vertically in the figures, at a rate of one line of 512 pixels (spaced 0·167 μm) every 64 μs; 481 lines stacked from left to right in the x direction constitute an image. As lines are scanned at distances of 0·138 μm, imaging in the x direction proceeds at ∼2·2 μm ms−1, so that the 15 μm horizontal calibration bar in every image corresponds also to about 7 ms. All images illustrated are presented at equal spacing (of 0·167 μm), by linear interpolation in the x direction.
Space- and time-resolved images (termed ‘3D’ for short) were obtained by scanning repeatedly a 5·3 μm × 85 μm band in the object, at 4 ms intervals.
Normalization to resting fluorescence
Images of fluorescence F(x, y) or F(x, y, t), and normalized fluorescence, F/F0, which provides a first estimate of increase in local [Ca2+] relative to its resting value, are shown.
Single 2D images do not contain resting fluorescence information in those locations where sparks occur. Therefore we developed a procedure, illustrated in Fig. 1, that uses signal averages. Figure 1A is a full individual 2D image. Up to 30 images could be obtained at the same location without deterioration or movement. In the example, 19 images were obtained, each containing several sparks. Figure 1B is their pixel-to-pixel sum divided by 19. This ‘rough’ average was used as divisor to obtain a rough normalized version of every individual image. On each the automatic locator identified spark areas (those exceeding the value 1 by a set amount), and excised them (zeroing the corresponding pixels) from the original non-normalized records. Figure 1C is the boxed part of individual image A after zeroing the spark regions (in red). These excised images were then added, to obtain the sum image D. To obtain resting fluorescence, the sum was divided by a (pixel-dependent) ‘counter’ E. The counter is an array, with the dimensions of the image, whose value at any pixel is the number of images not zeroed there, and therefore may range between 1 and 19. The ratio of the sum D and the counter E is the resting fluorescence, F0(x, y), illustrated in Fig. 1F. Normalized images were obtained dividing F(x, y) by F0(x, y), pixel to pixel. Figure 1G is the image in A normalized to resting fluorescence. Especially in the presence of caffeine, among many circular, symmetric sparks, there are some obviously elongated events. Shown at the bottom is the profile of normalized fluorescence as a function of coordinate ‘s’ along the axis of the large event. It made sense to determine the orientation of this axis relative to the plane of the Z disks.
Figure 1. Normalization of sparks in two dimensions.
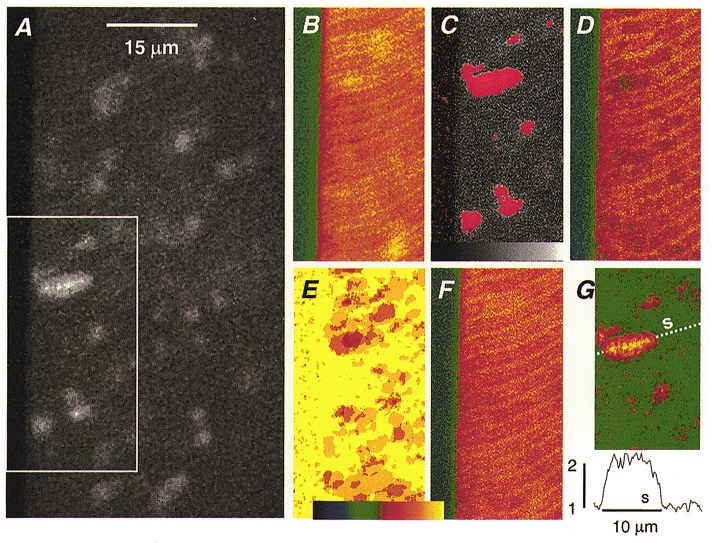
A, fluorescence image (after 9-point median filtering), in a cell exposed to 1 mM caffeine. The longitudinal axis of the fibre is represented vertically (y coordinate); scanning proceeds by vertical lines of pixels and the area is swept from left to right. The grey scale spans 0 to 255 units of fluorescence. B, rough reference image; average of A plus 18 other images from the same location (portion shown is boxed in A). The colour scale, in E, spans 0 to 63 units of fluorescence. Normalization of image A by reference B was followed by application of the automatic event detector, which identified spark areas above a threshold level (mean + 1·3 s.d.). C, the original image in A with spark areas excised (set to 0) and marked in red. D, sum of all 19 images with spark areas excised. The darker areas are those that had sparks in a greater number of individual images. E, a counter of sparks, which starts at 19 everywhere and is reduced by one in every pixel where a spark is excised. The colour table spans the range 0–19. F, the resting fluorescence image F0(x, y), the result of dividing D by E. Note the clear sarcomeric structure. G, image A divided by resting fluorescence F0(x, y). At bottom is the profile of normalized fluorescence (averaged for a 0·8 μm band of 5 pixels) along abscissa s. Identifier: 1203n2, image 69 and sum of images 65 to 83.
The direction of Z disks
2D scanning proceeded first in the longitudinal or y direction (parallel to fibre axis) and rastered transversely, in the x direction. While the x direction was generally parallel to the plane of the Z disks, these could be tilted as much as 30 deg, as shown in Fig. 1F. An automatic method was devised to find locally the direction of Z disks. The method, illustrated in Fig. 2, uses the clear striation visible in the averaged image of resting fluorescence (Fig. 2A). When the event locator described below finds a spark in an individual image, say, at the position marked by crossbars, it then analyses the surrounding sub-array of approximately 30 μm × 30 μm. This sub-array is rotated, relative to the cartesian axes, by 1 deg increments between −45 and 45 deg. Figure 2B shows the sub-array after rotation by −25 deg (i.e. clockwise). At every rotation the sub-array is then averaged along the x coordinate, yielding a function F(y) represented in Fig. 2B. (To avoid edge effects produced by rotation of a square array, only a central 15 μm × 15 μm box in the sub-array is averaged.) The root mean square (r.m.s.) value of the average is high at this particular rotation, because the sarcomeric striation becomes nearly perpendicular to the y axis. Figure 2C shows the dependence of the r.m.s. on the rotation angle. The position of its maximum (-28 deg) determines the angle of the Z disks relative to the y axis.
Figure 2. Determination of direction of the Z disks.

A, portion of the resting fluorescence image made as described in Fig. 1. The procedure determines the direction of Z disks at or near the location of a detected spark (marked by the crossbar). A sub-array of 30 μm × 30 μm around this point is rotated incrementally. B, the sub-array after rotation by −25 deg. Plotted on the right side is F(y), average over the x dimension of the rotated image (to avoid edge effects clearly visible at the corners of the sub-array, only the portion within the box is used). F(y) varies widely around its mean, because the structural striations are almost parallel to the x axis at this rotation angle. C, root mean square value of the function F(y)-mean, plotted as a function of the rotation angle. Note the sharp maximum at −28 deg, which is taken to be the local angle of the Z disks. D, resting fluorescence image with vectors marking the Z disk direction, placed by the spark detector at all locations where events were found in any of the 19 images. The array of vectors follows correctly the orientation of the Z disks.
Figure 2D shows as short segments the direction of the Z disks at every position where a spark was found in any of the 19 images from the same region, demonstrating good agreement between the method and the direction appraised by eye.
Morphometry of events
A computer procedure described earlier for line scans (Cheng et al. 1999), which locates events automatically, was modified to work on 2D images. Events were detected – on images normalized and filtered – by a relative criterion, fluorescence exceeding F0 by 2·5 standard deviations of the non-spark regions. Figure 3A is one individual image in the presence of caffeine, after normalization. At the bottom is the profile of normalized fluorescence along the slanted axis s. Figure 3B illustrates automatic measurements performed by the locator on the events detected. For each event a contour was traced (the border of the region where the detection threshold is exceeded; in blue). On this contour the program located the two pixels farthest apart from each other. These points determine the event’s major axis (central line in red). The spark’s length is the length of this segment, while its width is the distance between the two tangents to the contour parallel to the major axis (in red). These two parameters were used to define an absolute eccentricity, evaluating separation of the event from circular symmetry, as (length/width – 1). A relative eccentricity (with sign) is defined later.
Figure 3. 2D properties and analysis of sparks in caffeine.

A, normalized fluorescence image, in a cell exposed to 1 mM caffeine. The colour table spans the range 0–2·3. At the bottom is the profile of fluorescence along the abscissa s. B, automatic location and morphometry of events. The locator finds a contour (blue, see enlargement), a major axis, its length, event width (distance between tangents parallel to major axis) and orientation angle α between the local direction of the Z disks (black arrow) and that of the event’s axis (red). Identifier: 1203n2, image 78. C, D and E, example images of large sparks and profiles along their major axis. Identifiers: C, 1203n2.96; D, 0313d.104; E, 1203n2.74.
The orientation of the spark was quantified, relative to the plane of the Z disk, by an orientation angle. For this purpose, after locating a spark, the program reverted to the resting fluorescence image to determine the local direction of the Z disks as described above. For the environment of the boxed spark in Fig. 3B, this direction is represented by the black arrow in the enlargement. The orientation angle α is measured (counterclockwise) between the Z disk direction and the long axis of the spark (red arrow in the enlargement).
Statistics
Following every parameter average, in parentheses, is the standard error of the mean. Significance of differences between averages, X1 and X2, of samples of sizes N1 and N2, was established by ANOVA or by two-tailed tests of likelihood of the conventionally defined t variable:
where Sj2 are the sample variances.
RESULTS
Morphology of sparks in two dimensions
2D images of events obtained in the presence of 1 mM caffeine are illustrated in Figs 1 and 3, while images from the same fibre in the absence of caffeine (reference) are in Fig. 4. To the eye, most sparks in reference were symmetric, and approximately circular. This is confirmed by the contours drawn for every detected event by the locator program (right side panels on Fig. 4). By contrast, in caffeine there were many highly asymmetric, oval or elongated events. This asymmetry might reflect an actual feature of the local increase in [Ca2+], or trivially result from anisotropic dye distribution. The asymmetries introduced by an inhomogeneous distribution of dye were corrected to a first approximation normalizing F(x, y) by F0(x, y), the fluorescence at rest, as described in Methods. Figure 1F shows the resting fluorescence of the boxed portion of Fig. 1A, obtained using 19 images from the same location. Note that the periodic variation in F0, probably due to dye accumulation (Tsugorka et al. 1995; Klein et al. 1996), outlines the sarcomeric structure and demonstrates that the preparation was steady during imaging.
Figure 4. 2D properties of sparks in reference.

Left, normalized fluorescence in the fibre of Fig. 1, before exposure to caffeine. Portions represented are from different images, among 13 obtained in the same location. Right, the locator finds sparks that are generally circular – the ‘major axis’ is randomly oriented. Identifier: 1203n2, images 7–9, 11.
Normalized images in caffeine are shown in Figs 1G and 3A (the lower panels in Fig. 3 are example events from other images). The periodic pattern of fluorescence present in the raw images F(x, y) is removed in the normalized images, but the sparks that were oval originally maintain their shape upon normalization. Elongated sparks are therefore not a consequence of uneven dye distribution.
Four spark parameters, defined in Methods, were analysed. For 13 images in reference (four of which are illustrated in Fig. 4) and 19 images in caffeine (illustrated in Figs 1 and 3) the histogram of absolute eccentricity (length/width – 1) is plotted in Fig. 5A. In both reference and caffeine the frequency peaks at a small non-zero value (because of noise, sparks are seldom perfectly symmetric). There is an excess of events of large eccentricity in caffeine; the difference of averages is small but significant (see figure legend).
Figure 5. Distributions of eccentricity and orientation angle.

A, histograms of absolute eccentricity, defined as length/width – 1. In caffeine (continuous trace) the distribution is displaced to higher values. The average eccentricity went from 0·36 (s.e.m. = 0·019) in reference, to 0·43 (s.e.m. = 0·011) in caffeine. The difference is significant by ANOVA (P < 0·03). B, distribution of orientation angle, which is almost random in reference (dashed), but is concentrated around 0 in caffeine. C, distribution of relative eccentricity, with sign defined as positive when |α| < 45 deg, and negative otherwise. In caffeine there are many events with high positive values of eccentricity, resulting in a clear shift in the positive direction. There are 213 events in reference (detected in 13 images from the same location), and 409 in caffeine (19 images from the same location). Identifier 1203n2.
More impressive is the effect of caffeine on the orientation of sparks relative to the plane of the Z disks. The distribution of orientation angle α, in Fig. 5B, is nearly isotropic in reference (dashed line) but becomes concentrated near the value 0 in caffeine.
A working hypothesis is that the increase in frequency of elongated events is due to the increase in the number of channels involved in individual sparks. In this hypothesis, the increase in event length should occur along junctions, that is, in the direction of the Z planes. Therefore, the increase in eccentricity should be accompanied by an alignment – an increase in the frequency of small angles α. We combined the two predicted effects, increase in eccentricity and orientation, into a single indicator, (relative) eccentricity, with a sign defined as positive when the orientation is aligned with the Z plane (-45 deg < α < 45 deg) and negative otherwise. The distribution of this parameter is shown in Fig. 5C. In reference, it was roughly bell shaped and centred at 0 (mean 0·00, s.e.m. 0·03) as one would expect from roughly circular sparks with no preferred orientation. In caffeine the distribution, still bell shaped, moved positive (mean 0·22 ± 0·02).
In four experiments analysed, nearly 1000 events in reference and 2600 in caffeine were detected. The average parameter values are listed in Table 1. Caffeine caused a significant increase in length, of 16 %, and eccentricity, from an average value of −0·05 in reference, to 0·18. It increased width by 9 %, and it reduced the absolute value of the orientation angle by 25 %. The changes in length, eccentricity and angle were also significant when examined in every individual experiment.
Table 1.
Effects of caffeine on spark morphology
| Events | Amplitude | Width (μm) | Length (μm) | Eccentricity | Angle (deg) | ||||||||||||
|---|---|---|---|---|---|---|---|---|---|---|---|---|---|---|---|---|---|
| Ref. | Caff. | Ref. | Caff. | Δ | Ref. | Caff. | Δ | Ref. | Caff. | Δ | Ref. | Caff. | Δ | Ref. | Caff. | Δ | |
| 0312b | 289 | 1463 | 0.49 | 0.44 | −0.1 | 1.79 | 1.98 | 0.19 | 2.30 | 2.67 | 0.37 | −0.16 | −0.02 | 0.14 | 53.9 | 42.5 | −11.4 |
| 0313d | 206 | 320 | 0.59 | 0.64 | 0.05 | 1.83 | 2.19 | 0.36 | 2.31 | 3.05 | 0.74 | 0.00 | 0.19 | 0.19 | 43.0 | 32.8 | −10.2 |
| 1203n | 281 | 386 | 0.81 | 0.88 | 0.07 | 2.20 | 2.25 | 0.05 | 2.94 | 3.15 | 0.21 | −0.09 | 0.10 | 0.19 | 48.2 | 35.6 | −12.6 |
| 1203n2 | 213 | 409 | 1.01 | 0.82 | −0.19 | 1.92 | 2.05 | 0.13 | 2.59 | 2.92 | 0.33 | 0.04 | 0.22 | 0.18 | 40.6 | 29.9 | −10.7 |
| Total | 989 | 2578 | — | — | — | — | — | — | — | — | — | — | — | — | — | — | — |
| Mean | — | — | 0.73 | 0.70 | −0.03 | 1.94 | 2.12 | 0.18 | 2.54 | 2.95 | 0.41* | −0.05 | 0.12 | 0.18* | 46.43 | 35.20 | −11.2* |
| s.e.m. | — | — | 0.12 | 0.10 | 0.06 | 0.09 | 0.06 | 0.07 | 0.15 | 0.10 | 0.11 | 0.05 | 0.05 | 0.01 | 2.95 | 2.70 | 0.52 |
Under amplitude, width and length are listed averages of parameter values (determined as described in Methods). Ref. and Caff., respectively, list averages in reference condition and in the presence of 1 mm caffeine. Angle is the absolute value of the orientation angle α (see Methods). Δ is paired difference of averages (Caff.— Ref.). Means are averages over all experiments (average of paired differences in bold type).
Significantly different from 0 (see Methods). Among caffeine effects, the increase in length and eccentricity and the decrease in angle were statistically significant in every individual experiment.
Pondering other mechanisms for the production of elongated sparks, we studied the statistical distribution of other parameters, illustrated in Fig. 6. As shown in Fig. 6A, the distribution of amplitude was generally decreasing, after a mode at low values, which is likely to be determined by detection limitations rather than reflect an actual property of the distribution (cf. Cheng et al. 1999). In the example, 1 mM caffeine determined a shift of the distribution to lower amplitudes, by about 0·15 unit of resting fluorescence. A similar effect of caffeine was reported by González et al. (2000a) using conventional line scanning, and may be related to a slight increase in resting fluorescence induced by the drug, rather than a reduction in Ca2+ release.
Figure 6. Quantitative properties of sparks in two dimensions.
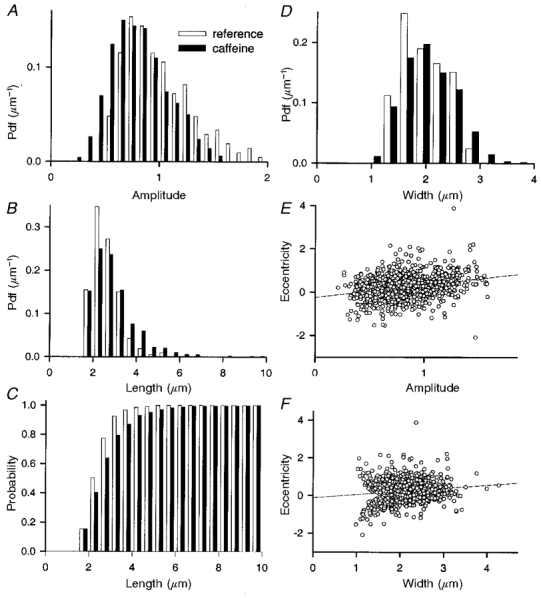
A, histogram of spark amplitude, in reference and caffeine. B, histogram, and C, cumulative histogram of event length. Note in C that the frequency of events longer than 4 or 6 μm was 13 and 2 %, respectively. D, histogram of event width. Note abrupt decay of density beyond 2·5 μm, both in reference and caffeine. E and F, plots of eccentricity vs. amplitude or width. The correlation coefficient of eccentricity and amplitude is 0·08, while that of eccentricity and width is 0·04. There are 213 events from 13 images in reference, 1136 events from 59 images in caffeine. Identifier: 1203n2.
The distribution of length (shown as probability density in Fig. 6B and as probability in C) was unremarkable, but for the fact that caffeine induced a very large increase in the frequency of long events. Many sparks in caffeine (13 % in the set illustrated) had a length of 4 μm or more. Two per cent of them had a length greater than 6 μm (several are shown in Fig. 3). Isolated examples were found of events of up to 15 μm.
The distribution of widths was interesting. In three of four fibres examined in reference and caffeine, it showed a noticeable drop in density at 2·5 to 3 μm, which could be taken to indicate a physical barrier to diffusion (the sarcomere length in all fibres was greater than 3 μm).
Such a restriction could provide a mechanism for the production of elongated sparks: Ca2+ coming from a point source first diffuses isotropically, then reaches an obstacle and starts to diffuse anisotropically, as water flowing in a channel or ‘gutter’. This and related mechanisms predict for elongated sparks a high correlation between eccentricity and amplitude, and, perhaps most characteristically, a spatial dependence of fluorescence that peaks at or near the centre and ‘spills’ to the sides according to the laws of diffusion. The profiles of fluorescence along the spark axis, shown in Figs 1 and 3, were not consistent with this hypothesis. Occasionally, long sparks showed a peak at their centre (Fig. 3A). Most long sparks, however, had a flat or slanted top (as in Figs 1G and 3C, D and E). Figure 6E plots eccentricity vs. amplitude for the sparks in caffeine. Against the prediction, the variables were not correlated (the correlation coefficient r2 was on average 0·09, s.e.m. = 0·08, n = 4 experiments in caffeine). Figure 6F shows that in the example there was no correlation between width and eccentricity either (r2 = 0·04, s.e.m. = 0·09, n = 4).
Elongated sparks could also result from random overlap of circular ones, but this should occur infrequently (as shown in Discussion). In conclusion, the elongated events correspond either to activation of an extended source – a group of channels in an extended area – or to non-random overlap of sparks from point sources. Both alternatives require that multiple channels contribute to the elongated events in caffeine.
Mobile sparks
The conclusion above is consistent with images, illustrated in Figs 7–9, obtained with the time series facility of the RCM8000 system. In this mode a narrow region in the object is sampled repeatedly at 4 ms intervals, yielding snapshots of the same spark at different times. These band images were processed in essentially the same way as full 2D images. Figure 7A illustratesa succession of normalized images from the same band in reference solution, and Fig. 7B the analysis by the locator program. The images feature the typical evolution of round sparks. As shown in Fig. 7B, the sparks at top and bottom remain roughly circular from beginning to end; their ‘major axis’, which is only slightly longer than other diameters, assumes variable orientations, indicative of basically symmetric events. The sparks remain in the same location (confirmed by the evolution of their centre of mass, not shown). Figure 7C, from the same fibre in reference, features an oval spark with typical evolution. It starts small and circular, then grows rapidly in length and remains elongated during most of its development and decay, with the long axis pointing steadily in the direction of the Z disk.
Figure 7. Sparks in three dimensions.

A, normalized fluorescence in reference, imaged at 4 ms intervals in a 5·3 μm-wide band. B, representative sparks characterized by the automatic locator are circular, and their position is steady. C, circular and oval sparks coexisting in the same image. D, oval sparks remain elongated during their evolution, although the earliest image is often more symmetric. For elongated sparks, the major axis is stably oriented, within Z planes. Identifiers: n1129, images 31 and 41.
Figure 9. Migrating sparks.

A, migrating sparks (green and black arrows), at both ends of a band. B, evolution of abscissa (x) of the centre of mass for the sparks at the ends of the band (black and green) and one other near the centre (red), which provides a landmark. The velocity reaches ≈0·1 μm ms−1. Identifier: n1129, image 50. C, a spark (black arrow) first grows towards the centre of the band as its intensity increases; later a local peak becomes visible and moves in the same direction. A second spark (red arrow) is relatively steady. D, evolution of abscissa of the spark’s centre of mass. Note that its movement accelerates (to 0·1 μm ms−1) when the peak separates from the edge of the band, probably because the centre of mass is better determined when the whole event is taken into account. E, three-dimensional representation of the evolution of the spark in D. The central five pixels of the spark are averaged at every x position and in every band, then plotted vs. x and time. The plot shows spatial growth first, then movement of the local peak of fluorescence. Identifier 0317b, image 143. Images are normalized to F0.
A different type of evolution of elongated sparks is illustrated in Fig. 8. The sparks marked with black arrows in Fig. 8A and D originate at the edge of the band, then invade it progressively. The movement is demonstrated by the evolution of the abscissa of the centre of mass, plotted in black in Fig. 8C and F. Propagation was real, not an artifact of preparation drift or errant sampling, as witnessed by ‘landmark’ events in the same band (red arrows), which were steady or moved slowly in the opposite direction. Because the spreading events were only partially imaged, whether they actually migrated or simply grew in length is unclear.
Figure 8. Propagating sparks.
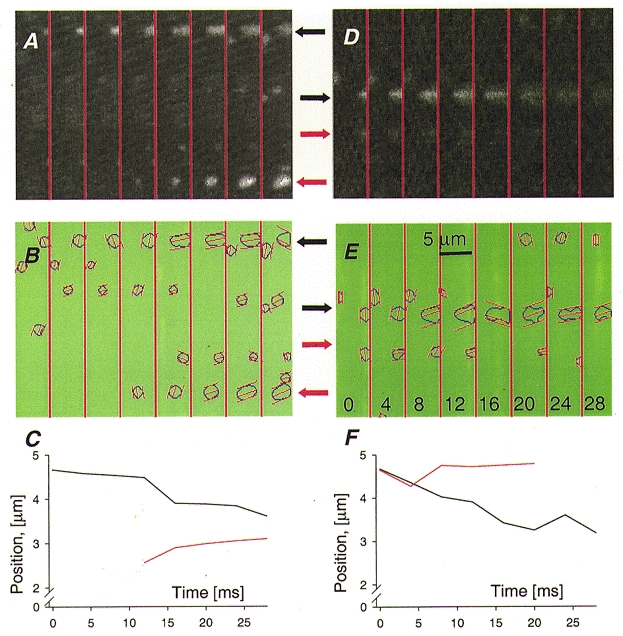
A and D, examples of sparks that invade an adjacent region as they grow (black arrows). B and E, the automatic locator confirms the expansion, and shows other events that do not move (red arrows), demonstrating a steady preparation. C and F, evolution of the abscissa of the centres of signal mass of two sparks in each frame (plots colour-coded to arrows). The event in A appears to grow by recruiting a discrete spark at time 16 ms, while the one in D grows more continuously. Images are normalized to F0. Identifiers: 0317b, image 130, and n1129, 52.
Examples in Fig. 9 demonstrate actual migration of sparks. The abscissa of the centre of mass of three events in Fig. 9A is plotted in Fig. 9B, colour-coded to the arrows. ‘Black’ and ‘green’ moved at ∼0·1 μm ms−1, while other sparks in the image remained steady. The migrating sparks became elongated transiently as they moved and grew. The spark marked by a black arrow in Fig. 9C first invaded the band from the right edge. Later the peak of the spark moved into the band as it grew. This evolution is represented three-dimensionally in the graph of Fig. 9E, plotting the average in the five central y pixels as a function of x (‘space’) and time.
Propagating sparks were relatively infrequent. In two experiments with caffeine, 500 frames with bands were recorded and 120 were kept for further examination. There were 410 sparks in the images kept. Twenty-one of those propagated and had a landmark in the same frame. Assuming that the records not kept had the same frequency of events but no propagating sparks, the ratio of propagating/steady sparks would be 1 %. This estimate increases to about 2 % if the requirement for a landmark in the same frame is waived. We did not attempt to quantify the frequency of mobile sparks in reference, but it appeared to be lower, which is consistent with the fact that mobile sparks tended to be elongated, and with the scarcity of elongated events in reference.
DISCUSSION
The combination of rapid confocal scanning in two spatial dimensions and time with automatic detection and morphometry of large numbers of sparks allowed us to characterize their spatio-temporal properties without the limitations imposed by traditional line scanning. Several new properties of sparks are documented.
In ‘reference’ conditions (which included a low [Mg2+]i, to elicit a workable frequency of events) sparks were generally circular in the image plane, reflecting presumably a spherical three-dimensional shape. This resulted in an essentially random distribution of the orientation angle, and a low average eccentricity (Figs 4 and 5, and Table 1). The average diameter in reference, 1·94 μm, is substantially greater than the full width at half-magnitude (FWHM) usually reported in line scan studies. This is because in the present work diameters were measured on suprathreshold contours (Fig. 3) rather than at half-magnitude. Moreover, in line scans FWHM is measured at the time of peak fluorescence, while in the present work sparks were caught at different times, most often after the peak, when spatial spread continues to increase.
In the presence of caffeine sparks grew in spatial extent (in agreement with previous observations with line scanning), but the growth occurred largely within the plane of the Z disks. Accordingly, the orientation angle concentrated sharply around the value 0, and the eccentricity increased and became ‘positive’ – reflecting the increased alignment of the major axis.
The significance of elongated sparks
Three explanations were considered for elongated sparks. One, first proposed by González et al. (2000a) in their study of caffeine effects, is that the increase in frequency of elongated events is due to a recruitment of multiple channels to participate together in individual sparks. This hypothesis justifies the effect of caffeine (as this drug sensitizes channels to activation by Ca2+, thus facilitating recruitment) and explains the alignment with the Z planes that accompanies the increase in eccentricity.
The second alternative is a mechanical constraint that retains Ca2+ in a ‘gutter’, or, more generally, any anisotropy, localized or distributed, in the diffusion or binding properties (as invoked by Cheng et al. 1996, to explain asymmetric sparks in cardiac muscle). A distributed anisotropy, however, is against the fact that most sparks are quite symmetric, even in the presence of caffeine, and that symmetric and elongated sparks occur some times at the same location in successive images.
In support of the existence of a discrete barrier to diffusion, we found an asymmetric distribution of widths, with a sudden reduction in density at about 2·8 μm. If this barrier was the main cause of the elongation of sparks, amplitude and width should be correlated with eccentricity. Indeed, eccentricity should increase only upon reaching this obstacle, which predicts a strong, albeit non-linear correlation with event width. Amplitude should also be correlated, because only sparks of a certain amplitude may reach the barriers. Finally, the profile of concentration (fluorescence) along the gutter should be characteristic of diffusion away from an open source.
These predictions were contradicted by the results. There was no correlation between amplitude and eccentricity (consistent with the modest decay of spark amplitude with caffeine), or between width and eccentricity. Perhaps most significantly, the spatial dependence of fluorescence along the spark axis was generally flat or slanted rather than symmetrically decaying from a central maximum.
The third explanation considered was random overlap of circular sparks, resulting in images with the appearance of elongated sparks. A first calculation of probability of such random overlap can be made assuming that all sparks are equal, so that the occurrence of sparks in contiguous locations will be sufficient to generate the impression of an elongated spark. Every image covers about 30 sarcomeres and 62 μm in the x direction. The overall frequency of events in caffeine, ∼20 per image in the example of Figs 1–4, corresponds to ∼1 per image per 100 μm of junction. The relative frequency of events longer than 4 μm (requiring overlap of at least two sparks in a 4 μm region) is less than the ratio: (conditional probability of one event occurring in the 4 μm region surrounding another)/(probability of one event). If events are independent, then this is equal to the (unconditional) probability of an event occurring within a 4 μm region, or 0·04 (1 × 4 μm/100 μm), while their actual frequency was 0·13. That of a 6 μm event (requiring overlap of at least three sparks) was 0·0016, while their actual frequency was 0·02.
The above calculation may be refined by recognizing that spark amplitudes and widths are distributed. For example, the long sparks in Figs 1 and 3 could occur by superposition of round sparks, of amplitudes between 0·8 and 1·3, and widths between 2 and 3 μm. These conditions are satisfied by about 15 % of the entire population (e.g. Fig. 6). Taking this condition into account reduces 7-fold the probability of superposition giving rise to 4 μm sparks, and 50-fold that of 6 μm sparks. Further reductions in probability are required if it is recognized that more than two sparks should overlap within 4 μm to really appear as a single 4 μm event.
When a spark was imaged at different times, radically different evolutions were found for elongated and circular ones. While the latter remained circular during their rise and ebb, the elongated ones had various possibilities. Some remained elongated, and when this happened, the long axis remained essentially fixed in the transverse direction. Of those that remained elongated, some kept growing in length, invading adjacent areas at ∼0·1 μm ms−1. Yet other events actually moved in space, displacing their peak at a similar rate.
Therefore, the possible mechanisms at play in the generation of elongated sparks must involve the activation of multiple sources (channels or their arrays). The transverse orientation of their axis suggests recruitment of channels along junctional arrays. Two chief modalities of recruitment appear to be at play: a continuum mechanism, whereby multiple channels are incorporated smoothly to the group that generates the event (see Figs 7A and 8C and E), and a discontinuous recruitment of individual channels, or their (small) groups, each contributing a discrete, more symmetric spark (see Fig. 8A).
The mechanism of propagation is likely to involve Ca2+-induced Ca2+ release (CICR) (Endo et al. 1970; Fabiato, 1984). Interestingly, an earlier stochastic model of propagation of release within couplons, in which a mobile ‘head’ of elevated Ca2+ provides the activation signal, yields velocities of about 0·1 μm ms−1, similar to those observed here (Stern et al. 1997).
The present observations are also relevant to the mechanism of termination of sparks. Some sparks migrate, implying that the regions that activate first are also the first to close (an inactivation, Sham et al. 1998). They, however, constitute a minority. Sparks that are elongated usually remain elongated during their decay phase (as in Fig. 7C and D), which suggests that, if the spark involves a group of channels, then the whole activated array must inactivate more or less simultaneously. This agrees with the conclusion that release in sparks terminates abruptly, as if coming from a single channel (Lacampagne et al. 1999). Such rapid closure of channels was not reproduced by the couplon model of Stern et al. (1997), in which release stopped by a Ca2+-mediated inactivation. Allosteric interactions like those reported by Marx et al. (1998) might provide a faster mechanism of channel closure.
The increase in length induced by caffeine, or the extent of observed propagation, should contain information regarding the spatial extent of the sources. On average, caffeine increases length of events by 0·41 μm, a value that is well within the length of most frog muscle couplons (Franzini-Armstrong et al. 1999), hence requiring no more than increased propagation within a couplon. In many cases, however, sparks propagate over a micrometre or more (Fig. 9), and events of several micrometres are easy to find (Figs 1 and 3). Because the length of frog couplons is at most 1·3 μm, these cases require propagation over multiple couplons.
The idea that propagation is restricted within one couplon stems from simulations (Stern et al. 1997), and has theoretical importance, as it explains why release activation, an intrinsically self-sustaining process, remains always under voltage control. The present observations, however, do not require radically changing this concept. Sparks of multi-couplon length are infrequent, and it would not be difficult, just by increasing Ca2+ sensitivity in the model, to simulate events that occasionally jump between couplons. In keeping with this idea, there is other evidence of transmission of activation over micrometre distances, especially in cardiac muscle (e.g. Parker et al. 1996; Blatter et al. 1997). By comparison, skeletal muscle appears much more ‘uptight’ as regards Ca2+ release. Interestingly, however, loss of control of Ca2+ release by voltage in the presence of caffeine was reported (Simon et al. 1989), reflecting perhaps uncontrollable contagion of CICR under special circumstances.
The effect of event frequency
In the present experiments, the so-called reference condition was actually non-physiological, altered to have a finite, albeit low, frequency of spontaneous sparks. This was done by lowering the free [Mg2+] to about 0·4 mM (Lacampagne et al. 1998). The mechanism of this effect is thought to be a relief from the inhibition exerted by Mg2+ on the release channels. Such relief renders the channels more susceptible to opening, which presumably occurs under the influence of local Ca2+. On the other hand, caffeine is believed to increase the sensitivity of channels to activation by Ca2+, hence their proclivity to open ‘spontaneously’, or be recruited into a spark. Therefore, both caffeine and low [Mg2+] should increase the length and eccentricity of sparks, as both should promote activation, and recruitment of additional channels.
The study that will test whether the effects of caffeine and low [Mg2+] are similar, a determination of spark morphology at different [Mg2+], has not been done. In support of this idea, however, it appeared that spark length, eccentricity and orientation grew in parallel with the overall frequency of events per image. This was seen best when the frequency of events varied substantially in the course of time. In one experiment that had eccentricity of 0·00 (0·01) in reference, while a series of 20 images was being recorded in the presence of caffeine, the frequency changed monotonically from 36 to 19 events per image. For the events in the first 10 images, when frequency averaged 32 events per image, eccentricity was 0·19 (0·02), while in the second half of the sequence (when the frequency was 23 per image) the eccentricity was 0·08 (0·02). When the set of events was divided into four groups, each gathered during five successive images, eccentricity correlated well with frequency (r2 was 0·85) but amplitude was essentially constant (r2 = 0·22).
In conclusion, the parallel evolution of eccentricity and frequency during uncontrolled changes suggests that the increase in eccentricity and event length associated with the presence of caffeine is not specific for this agonist, but a consequence of an increase in the channels’ propensity to open.
The nature of ‘standard’ sparks
Sparks that are elongated, or grow in length or move during their evolution, require the involvement of multiple channels, opening simultaneously or sequentially. While in some cases propagation of sparks appears to occur by discrete jumps, and could be explained by recruitment of a few channels (or their groups), in others (as in Fig. 9E) it is continuously graded, suggesting the involvement of tens of channels. That the sparks studied here were elicited by non-physiological stimulants of channel activity may suggest that the involvement of multiple channels requires such artificial enhancers, and is not a feature of normal or standard sparks. On the other hand, a previous study (González et al. 2000a) showed that caffeine modifies sparks quantitatively, increasing for instance the frequency of sparks of large width, rather than inducing qualitatively different events that do not occur in reference. This suggests that standard sparks (i.e. those induced by normal stimuli in physiological internal solutions) should also involve multiple channels. The same conclusion was reached by us, on entirely different grounds, in two other publications (Ríos et al. 1999;González et al. 2000b).
Because membrane depolarization also operates by increasing the propensity of release channels to open (an effect compared to the removal of Mg2+ inhibition; Lamb, 2000), a similar cooperative activation of channel arrays might be taking place when the membrane is depolarized, either experimentally or physiologically during an action potential. A study of the effect of membrane voltage on the spatio-temporal morphology of sparks is clearly called for, and is in progress.
Acknowledgments
We thank Dr Gonzalo Pizarro for stimulating discussions. This project was supported by grants from National Institutes of Health to E.R. (R01-AR32808) and N.S. (R01-AR45690).
References
- Blatter LA, Hüser J, Ríos E. Sarcoplasmic reticulum Ca2+ release flux underlying Ca2+ sparks in cardiac muscle. Proceedings of the National Academy of Sciences of the USA. 1997;94:4176–4181. doi: 10.1073/pnas.94.8.4176. [DOI] [PMC free article] [PubMed] [Google Scholar]
- Cheng H, Lederer WJ, Cannell MB. Calcium sparks: elementary events underlying excitation-contraction coupling in heart muscle. Science. 1993;262:740–744. doi: 10.1126/science.8235594. [DOI] [PubMed] [Google Scholar]
- Cheng H, Lederer MR, Xiao RP, Gomez AM, Zhou YY, Ziman B, Spurgeon H, Lakatta EG, Lederer WJ. Excitation-contraction coupling in heart: new insights from Ca2+ sparks. Cell Calcium. 1996;20:129–140. doi: 10.1016/s0143-4160(96)90102-5. [DOI] [PubMed] [Google Scholar]
- Cheng H, Song LS, Shirokova N, González A, Lakatta EG, Ríos E, Stern MD. Amplitude distribution of calcium sparks in confocal images. Theory and studies with an automatic detection method. Biophysical Journal. 1999;76:606–617. doi: 10.1016/S0006-3495(99)77229-2. [DOI] [PMC free article] [PubMed] [Google Scholar]
- Endo M, Tanaka M, Ogawa Y. Calcium induced release of calcium from the sarcoplasmic reticulum of skinned skeletal muscle fibres. Nature. 1970;228:34–36. doi: 10.1038/228034a0. [DOI] [PubMed] [Google Scholar]
- Fabiato A. Dependence of the calcium-induced release form the sarcoplasmic reticulum of skinned skeletal muscle fibres from the frog semitendinosus on the rate of change of free Ca2+ at the outer surface of the sarcoplasmic reticulum. The Journal of Physiology. 1984;353:56. P. [Google Scholar]
- Franzini-Armstrong C, Protasi F, Ramesh V. Shape, size, and distribution of Ca2+ release units and couplons in skeletal and cardiac muscles. Biophysical Journal. 1999;77:1528–1539. doi: 10.1016/S0006-3495(99)77000-1. [DOI] [PMC free article] [PubMed] [Google Scholar]
- González A, Kirsch WG, Shirokova N, Pizarro G, Stern MD, Ríos E. The spark and its ember. Separately gated local components of Ca2+ release in skeletal muscle. Journal of General Physiology. 2000a;115:139–158. doi: 10.1085/jgp.115.2.139. [DOI] [PMC free article] [PubMed] [Google Scholar]
- González A, Shirokova N, Kirsch WG, Pessah IN, Cheng H, Stern MD, Pizarro G, Brum G, Ríos E. Involvement of multiple channels in calcium sparks of skeletal muscle. Proceedings of the National Academy of Sciences of the USA. 2000b;97:4380–4385. doi: 10.1073/pnas.070056497. [DOI] [PMC free article] [PubMed] [Google Scholar]
- Herrmann-Frank A, Lüttgau H-C, Stephenson DG. Caffeine and excitation-contraction coupling in skeletal muscle: a stimulating story. Journal of Muscle Research and Cell Motility. 1999;20:223–237. doi: 10.1023/a:1005496708505. [DOI] [PubMed] [Google Scholar]
- Kawanishi T, Asou H, Kato T, Uneyama C, Toyoda K, Ohata H, Momose K, Takahashi M. Ratio-imaging of calcium waves in cultured hepatocytes using rapid scanning confocal microscope and indo-1. Bioimages. 1994;2:7–14. [Google Scholar]
- Klein MG, Cheng H, Santana LF, Jiang YH, Lederer WJ, Schneider MF. Two mechanisms of quantized calcium release in skeletal muscle. Nature. 1996;379:455–458. doi: 10.1038/379455a0. [DOI] [PubMed] [Google Scholar]
- Lacampagne A, Klein MG, Schneider MF. Modulation of the frequency of spontaneous sarcoplasmic reticulum Ca2+ release events (Ca2+ sparks) by myoplasmic [Mg2+] in frog skeletal muscle. Journal of General Physiology. 1998;111:207–224. doi: 10.1085/jgp.111.2.207. [DOI] [PMC free article] [PubMed] [Google Scholar]
- Lacampagne A, Ward CW, Klein MG, Schneider MF. Time course of individual voltage-activated Ca2+ sparks recorded at ultra-high time resolution in frog skeletal muscle. Journal of General Physiology. 1999;113:187–198. doi: 10.1085/jgp.113.2.187. [DOI] [PMC free article] [PubMed] [Google Scholar]
- Lamb G. Excitation-contraction coupling in skeletal muscle. Comparison with cardiac muscle. Clinical and Experimental Pharmacology and Physiology. 2000;27:216–224. doi: 10.1046/j.1440-1681.2000.03224.x. [DOI] [PubMed] [Google Scholar]
- Leong P, Maclennan DH. Complex interactions between skeletal muscle ryanodine receptor and dihydropyridine receptor proteins. Journal of Biochemistry and Cell Biology. 1998;76:681–694. doi: 10.1139/bcb-76-5-681. [DOI] [PubMed] [Google Scholar]
- Marx SO, Ondrias K, Marks AR. Coupled gating between individual skeletal muscle Ca release channels (ryanodine receptors) Science. 1998;281:818–821. doi: 10.1126/science.281.5378.818. [DOI] [PubMed] [Google Scholar]
- Niggli E. Localized intracellular calcium signaling in muscle: calcium sparks and calcium quarks. Annual Review of Physiology. 1999;61:311–335. doi: 10.1146/annurev.physiol.61.1.311. [DOI] [PubMed] [Google Scholar]
- Parker I, Zang WJ, Wier WG. Ca2+ sparks involving multiple Ca2+ release sites along Z-lines in rat heart cells. The Journal of Physiology. 1996;497:31–38. doi: 10.1113/jphysiol.1996.sp021747. [DOI] [PMC free article] [PubMed] [Google Scholar]
- Ríos E, Stern MD, González A, Pizarro G, Shirokova N. Calcium release flux underlying Ca2+ sparks of frog skeletal muscle. Journal of General Physiology. 1999;114:31–48. doi: 10.1085/jgp.114.1.31. [DOI] [PMC free article] [PubMed] [Google Scholar]
- Schneider MF. Perspective: Ca2+ sparks in frog skeletal muscle: generation by one, some, or many SR Ca2+ release channels? Journal of General Physiology. 1999;113:365–372. doi: 10.1085/jgp.113.3.365. [DOI] [PMC free article] [PubMed] [Google Scholar]
- Sham JS, Song LS, Chen Y, Deng LH, Stern MD, Lakatta EG, Cheng H. Termination of Ca2+ release by a local inactivation of ryanodine receptors in cardiac myocytes. Proceedings of the National Academy of Sciences of the USA. 1998;95:15096–15101. doi: 10.1073/pnas.95.25.15096. [DOI] [PMC free article] [PubMed] [Google Scholar]
- Shirokova N, Gonzalez A, Kirsch WG, Rios E, Pizarro G, Stern MD, Cheng H. Calcium sparks: release packets of uncertain origin and fundamental role. Journal of General Physiology. 1999;113:377–384. doi: 10.1085/jgp.113.3.377. [DOI] [PMC free article] [PubMed] [Google Scholar]
- Shirokova N, Ríos E. Small event Ca2+ release: a probable precursor of Ca2+ sparks in frog skeletal muscle. The Journal of Physiology. 1997;502:3–11. doi: 10.1111/j.1469-7793.1997.003bl.x. [DOI] [PMC free article] [PubMed] [Google Scholar]
- Simon BJ, Klein MG, Schneider MF. Caffeine slows turn-off of calcium release in voltage clamped skeletal muscle fibers. Biophysical Journal. 1989;55:793–797. doi: 10.1016/S0006-3495(89)82878-4. [DOI] [PMC free article] [PubMed] [Google Scholar]
- Stern MD, Pizarro G, Ríos E. Local control model of excitation-contraction coupling in skeletal muscle. Journal of General Physiology. 1997;110:415–440. doi: 10.1085/jgp.110.4.415. [DOI] [PMC free article] [PubMed] [Google Scholar]
- Tanaka H, Nishimaru K, Sekine T, Kawanishi T, Nakamura R, Yamagaki K, Shigenobu K. Two-dimensional millisecond analysis of intracellular Ca2+ sparks in cardiac myocytes by rapid scanning confocal microscopy: increase in amplitude by isoproterenol. Biochemical and Biophysical Research Communications. 1997;233:413–418. doi: 10.1006/bbrc.1997.6470. [DOI] [PubMed] [Google Scholar]
- Tsien RY. Laser scanning confocal fluorescence microscopy at video rate (30 frames/sec) with dual-wavelength emission rationing for quantitative imaging of intracellular messages. Proceedings of the Royal Microscopical Society. 1990;25:S53. [Google Scholar]
- Tsugorka A, Ríos E, Blatter LA. Imaging elementary events of calcium release in skeletal muscle cells. Science. 1995;269:1723–1726. doi: 10.1126/science.7569901. [DOI] [PubMed] [Google Scholar]