

Abstract
We have developed a mathematical model of the L-type Ca2+ current, which is based on data from whole-cell voltage clamp experiments on rat ventricular myocytes. Ion substitution methods were employed to investigate the ionic selectivity of the channel. Experiments were configured with Na+, Ca2+ or Ba2+ as the majority current carrier.
The amplitude of current through the channel is attenuated in the presence of extracellular Ca2+ or Ba2+. Our model accounts for channel selectivity by using a modified Goldman-Hodgkin-Katz (GHK) configuration that employs voltage-dependent channel binding functions for external divalent ions. Stronger binding functions were used for Ca2+ than for Ba2+.
Decay of the ionic current during maintained depolarization was characterized by means of voltage- and Ca2+-dependent inactivation pathways embedded in a five-state dynamic channel model. Particularly, Ca2+ first binds to calmodulin and the Ca2+-calmodulin complex is the mediator of Ca2+ inactivation. Ba2+-dependent inactivation was characterized using the same scheme, but with a decreased binding to calmodulin.
A reduced amount of steady-state inactivation, as evidenced by a U-shaped curve at higher depolarization levels (>40 mV) in the presence of [Ca2+]o, was observed in double-pulse protocols used to study channel inactivation. To characterize this phenomenon, a mechanism was incorporated into the model whereby Ca2+ or Ba2+ also inhibits the voltage-dependent inactivation pathway.
The five-state dynamic channel model was also used to simulate single channel activity. Calculations of the open probability of the channel model are generally consistent with experimental data. A sixth state can be used to simulate modal activity by way of introducing long silent intervals.
Our model has been tested extensively using experimental data from a wide variety of voltage clamp protocols and bathing solution manipulations. It provides: (a) biophysically based explanations of putative mechanisms underlying Ca2+- and voltage-dependent channel inactivation, and (b) close fits to voltage clamp data. We conclude that the model can serve as a predictive tool in generating testable hypotheses for further investigation of this complex ion channel.
Although several types of ions carry transarcolemmal currents that contribute importantly to electrical activity in different types of cardiac myocytes, it is generally accepted that the flow of ions through Ca2+ channels plays an especially critical and unique role as a signalling agent. In the heart, gated Ca2+-channel current is essential to normal cardiac function since: (a) it helps to generate the prolonged depolarization characteristic of the cardiac action potential plateau, which promotes the influx of Ca2+ ions into the myoplasm; and (b) it is directly responsible for the initiation of the excitation-contraction (E-C) coupling cycle (i.e. it serves as the trigger current for the E-C process; Bers, 1991). Thus, a better understanding of the mechanisms regulating the influx current through sarcolemmal Ca2+ channels is of fundamental importance to our knowledge of the normal heart and the management of certain pathological states.
It has been proposed that L-type Ca2+ channels inactivate via two major mechanisms: a Ca2+-dependent process as well as a voltage-dependent one (Lee et al. 1985). Early mathematical models for L-type Ca2+ channels emphasized either type of inactivation mechanism individually, but not together. For example, Standen & Stanfield (1982) described a model for exclusively Ca2+-dependent inactivation, whereas Sanguinetti et al. (1986) proposed an inactivation model where the inactivation rate constants are strictly voltage dependent.
Modal models
Investigators using patch clamp techniques to measure single channel currents from L-type channels discovered early on that channel activity varied considerably as a function of time. This led Hess et al. (1984) to suggest a ‘modal’ scheme of channel behaviour, wherein the channel is allowed to shift among three different and distinct gating ‘modes’. These modes are characterized by: (a) brief openings and bursts (mode 1); (b) much longer openings interrupted by brief closures (mode 2); and (c) no openings at all (mode 0). Imredy & Yue (1994) developed a more explicit model of L-type channel modal behaviour, and used it to fit their experimental data. In their model, Imredy & Yue suggested that Ca2+-dependent inactivation could be simulated by a Ca2+-induced shift from the normal mode to a low open probability mode (mode Ca), characterized by a more than 100-fold reduction of entry rate to the open state. Jafri et al. (1998) and Stern et al. (1999) expanded upon this basic model by including additional ‘modes’. A basic drawback to such models is that there are so many states and parameters to be adjusted that almost any kinetic behaviour could be fitted. Alternatively, it has been suggested that modal behaviour in other channels can be simulated using much simpler Markovian models (Zahradnikova & Palade, 1993).
Hodgkin-Huxley-type models
Hodgkin-Huxley (H-H)-type models have also been applied to L-type Ca2+ channels. Difrancesco & Noble (1985) originally described L-type channel kinetics in terms of a voltage-dependent activation variable, d, a voltage-dependent inactivation variable, f, and a Ca2+-dependent inactivation function, f2. Rasmusson et al. (1990) modelled inactivation in terms of a U-shaped solely voltage-dependent inactivation, whereas Luo & Rudy (1994) subsequently added a Ca2+-dependent inactivation term to this channel model. In general, H-H models can be reconciled with multiple state models as has been done for the original Hodgkin-Huxley squid axon model (e.g. Johnston & Wu, 1997). These models have similar kinetic form, but the H-H model is generally a lower order approximation to the actual kinetic process. The complex channel kinetics revealed in modern whole-cell voltage clamp recordings obtained in ion substitution experiments (e.g. Hess et al. 1986) require descriptions that employ a more complex structure. A multiple state model formalism can better accommodate this need.
Model objectives
Both modal and Hodgkin-Huxley-type models can simulate the behaviour of cardiac L-type channels. Modal models can easily explain not only the normal gating mechanism, but also the effects of large depolarizations, blockage by dihydropyridines and β-adrenergic stimulation by simply shifting to other modes. However, modal models are of high order and contain a very large number of parameters. In contrast, Hodgkin-Huxley-type models that have been developed are lower-order, more compact approximations that may not be able to adequately characterize the complex dynamics of L-type channel behaviour, particularly with respect to inactivation. In the current study, we present a multiple-state model of intermediate complexity to better characterize the inactivation process.
MODEL DEVELOPMENT
Figure 1 shows a lumped fluid compartment model consisting of a sarcolemma/t-tubule containing one type of embedded channel (a DHP-sensitive Ca2+ channel), which separates the extracellular bathing medium from the intracellular medium. The intracellular junctional sarcoplasmic reticulum (JSR) interfaces with a small cleft space volume which is imposed between the portion of the sarcolemma/t-tubule containing the Ca2+ channel and the JSR. We introduce the small cleft space to accommodate recent evidence (Sun et al. 1995) which suggests that there exists a small restricted subsarcolemmal domain associated with the L-type Ca2+ channels, where Ca2+ concentration may transiently reach much higher levels than in the cytosol as a whole. The extracellular, intracellular and cleft space volumes are denoted as Ve, Vi, and Vc, respectively.
Figure 1. Sarcolemmal/junctional SR model.
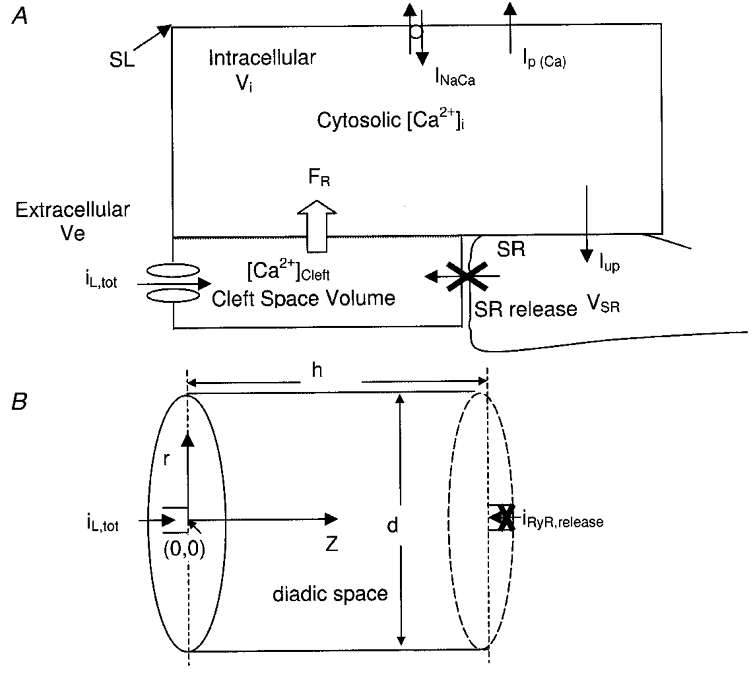
A, illustration of lumped L-type channel embedded in the sarcolemma (SL). B, sketch of cleft space geometry. Cytosolic compartment volume Vi is large by comparison and the bounding sarcolemmal membrane contains a lumped Na+-Ca2+ exchanger (INaCa) and a Ca2+-ATPase pump (Ip,Ca). Cytosolic Ca2+ is taken up into the sarcoplasmic reticulum (SR) by a Ca2+ pump. The uptake current is denoted Iup.
The cleft space is further modelled as a narrow cylindrical space formed by circular portions of the SR membrane and sarcolemmal/t-tubule membrane (see Fig. 1B). The feet structures that span this ‘diadic gap’ (h) are ∼15 nm tall, as determined from three-dimensional reconstruction. The width of the t-tubule is highly variable, with diameters (d) between 60 and 200 nm. In our model, we used h = 18 nm and d = 120 nm. The diffusion coefficient for free Ca2+ (DCa) used in previous models ranges from 100 to 600 μm2 s−1. We used a free Ca2+ diffusion coefficient of 250 μm2 s−1 as our standard parameter value for DCa. The boundary condition at r =d/2 for local [Ca2+] is cytosolic [Ca2+]. Polar coordinates were used in the computations, with origin right at the ‘mouth’ of the dihydropyridine receptor (DHPR) L-type Ca2+ channel. Thus, local Ca2+ concentration at point (0, 0) (or [Ca2+]DHPR) is responsible for L-type Ca2+ current inactivation, while local Ca2+ concentration at point (0, h) (the ‘mouth’ of the ryanodine receptor (RyR) Ca2+ release channel; [Ca2+]RyR) is involved in RyR activation and inactivation.
The current study is focused on the characterization of the DHP-sensitive Ca2+ channel, and therefore we have taken care to eliminate any contribution of Ca2+ transients due to SR release, by administering a relatively high dose of ryanodine (20 μM) in those experiments in which 1.0 mM Ca2+ was present extracellularly. The calcium concentrations in the much larger extracellular compartments are assumed to be constant, and Ca2+ ions diffuse ‘passively’ in cylindrical cleft space upon ICa,L entry. Thus, our focus in the present study is only on the amplitude and kinetics of the DHP-sensitive Ca2+ current associated with the sarcolemma.
Channel permeability
L-type channels have complex permeation properties, and exhibit various selectivities for divalent and monovalent cations (Hess et al. 1986). Experimental studies on L-type ionic membrane currents in isolated cardiac myocytes have found that extracellular Ca2+ is both an effective permeator and a potent blocker (Lansman et al. 1986). This is assumed to be due to the fact that Ca2+ dehydrates rapidly and binds to the pore with appropriate affinity.
To account for L-type channel permeability, some cardiac models (Difrancesco & Noble, 1985; Luo & Rudy, 1994) make use of the conventional Goldman-Hodgin-Katz (GHK) formalism with large permeability for Ca2+ coupled to smaller permeabilities for Na+ (e.g. PCa/PNa > 1000). However, GHK assumes that ions cross the membrane independently without interacting (Hille, 1992), whereas data indicate that even a trace amount of extracellular Ca2+ (1 μM) excludes Na+ and K+, even though the latter two ions are physiologically present at one hundred thousand times higher concentrations (McCleskey et al. 1986). The Ba2+ ion also has a high potency for blocking Na+ current through L-type channels, although it is less effective than Ca2+.
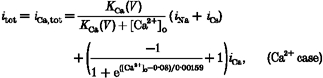
Microscopically, we view the L-type Ca2+ channel as a multi-ion, single-file channel containing at least two ion binding sites (Hess & Tsien, 1984). Micromolar concentrations of extracellular divalent ions (Ca2+ or Ba2+) would bind to the allosteric high-affinity regulatory site in a voltage-dependent fashion and convert the channel into its monovalent-impermeant state, thereby chopping the current and giving the appearance of block (Hess & Tsien, 1984; Yue & Marban, 1990). This scheme is macroscopically implemented as voltage-dependent blockade functions in front of single channel Na+ and Cs+ component currents (iNa and iCs) as in eqns (1) and (2). In the multi-ion scheme, divalents bind avidly to deep free energy wells when present in low extracellular concentrations; they even produce a little current of their own in addition to impeding monovalent flux. The low apparent affinity of the sites for permeating Ca2+ is attributed to electrostatic repulsion or some other strong ion-ion interaction that opposes multiple occupancy of the pore by Ca2+. This mechanism boosts Ca2+ inward currents at higher [Ca2+]o. Such U-shaped [Ca2+]o dependence of inward current through Ca2+ channels is simulated macroscopically by introducing a Ca2+-dependent repulsion function which is placed in front of the Ca2+ component current (iCa). Thus, the expressions for the Ca2+ and Ba2+ currents are given below:
 |
(1) |
 |
(2) |
where KBa(V) and KCa(V) are defined as voltage-dependent binding functions of divalent ions, and iNa and iCs denote the maximum Na+ and Cs+ component currents through a single open channel, respectively. The terms iBa,tot and iCa,tot represent maximum total currents through a single open L-type channel, when Ba2+ or Ca2+, respectively, is present in the bathing medium. We do not consider experiments using mixtures of Ba2+ and Ca2+. Expressions for these component currents are given in Table 3 (Appendix B).
Table 3.
Maximum currents through the L-type channel (Goldman-Hodgkin-Katz equations)
| Case 1 (control); external: Na+, Cs+; internal: CS+ |
| itot =iNa+iCs |
| iNa and iCs are from eqns (A5) and (A6) |
| Case 2 (Ba2+): external: Ba2+, Na+, Cs+; internal: Cs+ |
| Refer to eqns (1),(A5),(A6) and (A8)(A6) and (A8) |
| KBa(V)=0.00132e(V-21.73)/21.24 |
| Case 3(Ca2+): external: Ca2+, Na+, Cs+; internal: Cs+ |
| Refer to eqns (2),(A5),(A6) and (A7)(A6) and (A7) |
| KCa(V)=0.001056e(V-21.73)/21.24 |
| Whole-cell current: |
| ICa,L =Nitot(Po2+ Po3), N = 10 000 (total number of channels in a myocyte) |
Channel dynamics
We consider the L-type Ca2+ channel to operate in a number of different conformations, or states, which are open or closed to the flow of ions. That is, at any moment the channel is in only one of a finite number of discrete states. Transitions are assumed to be Markovian, which makes the problem amenable to theoretical analysis. The rates of these transitions are determined only by the initial states and by external variables such as membrane potential and [Ca2+].
Activation and inactivation mechanisms
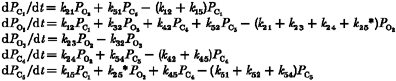
The lumped L-type Ca2+ channel is described by a five-state gating scheme as illustrated in Fig. 2. Channel activation proceeds as a transition from the resting (closed) state C1 to the open configuration O2 upon depolarization. Compared with the activation process, the gating associated with ICa,L inactivation is much more complicated in that it displays both voltage-dependent and calcium-dependent components (Kass & Sanguinetti, 1984).
Figure 2. Schematic diagram of L-type channel (DHPR) model.
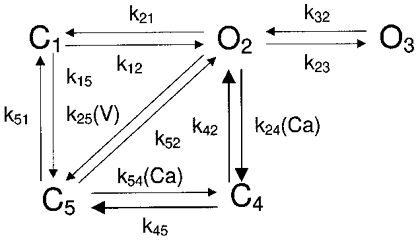
k24 and k54 are calcium-calmodulin dependent; see text for details.
Several experimental investigations have attempted to separate the Ca2+- and voltage-dependent aspects of inactivation. Specifically, with regard to experimental aspects: (1) Lee et al. (1985) suggested that Ca2+-dependent modulation of the inherent voltage-dependent component could account for the Ca2+-dependent component of L-type channel inactivation, although Shirokov et al. (1993) found voltage-dependent inactivation reduced the putative gating currents associated with L-type channels while Ca2+-dependent inactivation did not. (2) In guinea-pig ventricular cell experiments under normal conditions where Ca2+ is the charge carrier, it is clear that ICa,L declines with a two-component exponential time course (Hess et al. 1986). (3) In our own rat ventricular cell experiments, when Na+ is used as the charge carrier through the DHP-sensitive channel, the Ca2+-dependent component of inactivation is abolished. Only the voltage-dependent inactivation component is operational. Under these conditions, the whole-cell sodium current (INa,L) decays much more slowly than the whole-cell Ca2+ current (ICa,L) and the INa,L trace can be fitted quite well with a single exponential, which is consistent with the slower component of normal decay. In our hands, the fast component of decay appears to be Ca2+ dependent, whereas the slow component is voltage dependent.
In most models, two separate and distinct decay processes are a fundamental assumption regarding the inactivation mechanism (Imredy & Yue, 1994; Jafri et al. 1998).
Our experimental data reveal complicated dynamics when Na+, Ba2+ or Ca2+ acts as the charge carrier, particularly when observing the inactivation time constants of outward total currents in response to depolarization levels above the reversal potential. Specifically, experimental results (discussed later in Table 2 and Fig. 4) show that INa,L decays faster than IBa,L (whole-cell Ba2+ current) at high depolarizations, which is in opposition to the generally held concept that INa,L should be less inactivated than IBa,L, since the latter experiences Ba2+-dependent inactivation in addition to pure voltage-dependent inactivation. This finding has also been reported by Hess et al. (1986). We suggest that another mechanism may account for this phenomenon.
Table 2.
Comparison of inactivation time constants (ms) with Na+, Ba2+ and Ca2+ as charge carriers
| Depolarization level (mV) | 0[Ca2+]o, 0[Ba2+]o | 1.0[Ca2+]o, 0[Ba2+]o | 0.3[Ca2+]o, 0[Ba2+]o | 0[Ca+]o, 1.0[Ba2+]o | 0[Ca2+]o, 0.3[Ba2+]o |
|---|---|---|---|---|---|
| 10 | 71.87 | 39.18 | 43.95 | 68.75 | 69.00 |
| 20 | 70.59 | 44.23 | 46.17 | 70.56 | 65.68 |
| 30 | 68.37 | 47.63 | 48.93 | 66.67 | 70.76 |
| 40 | — | 46.40 | 49.85 | 67.68 | — |
| 50 | 36.07 | 46.66 | — | — | 60.43 |
| 60 | 39.95 | 52.82 | — | 46.84 | 57.45 |
| 70 | 41.87 | — | 78.91 | 43.41 | 55.30 |
| 80 | 41.66 | — | 84.10 | 41.76 | 54.68 |
Concentration of Ca2+ and Ba2+ given in millimolar. 140 mM [Na+]o in all cases.—, the region of the reversal potential (ICa,L is close to zero), where it is quite difficult to determine the current’s decay rate.
Figure 4. Experimental recordings of L-type channel currents.
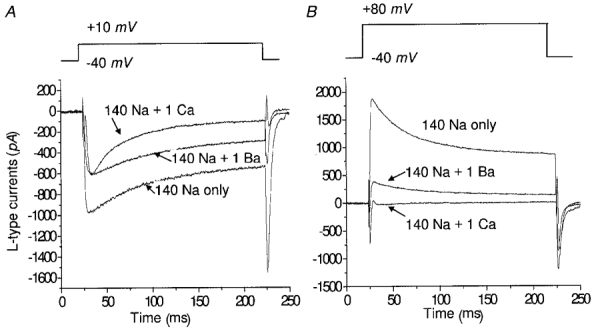
A, step to +10 mV. B, step to +80 mV. In all cases the holding potenital is -40 mV. Labels are extracellular ionic concentrations (mM).
In our model, the voltage- and calcium-dependent inactivation processes are implemented in terms of separate pathways. Specifically, the pathway 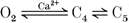 with Ca2+ binding to channel state C4 only in Fig. 2 is chosen to account for both fast and slow phases of Ca2+-mediated inactivation, consistent with comments (2) and (3) above. Pathway
  accounts for voltage-dependent inactivation. Our model differs from others in that the voltage-dependent pathway is not solely dependent on voltage, but is also inhibited by intracellular Ba2+ or Ca2+. This is in agreement with our experimental findings using Ba2+ (discussed in greater detail below), as well as those of other investigators using Ba2+ and Ca2+ (Hess et al. 1986).
In Fig. 2, the final pathway connecting C5 and C1 characterizes the so-called ‘ultra-slow’ inactivation process (Boyett et al. 1994), which occurs with the physiological charge carrier, although normally it is masked by Ca2+-dependent inactivation. The ultra-slow inactivation is also masked by normal voltage-dependent inactivation, and only manifests itself if the duration of the conditioning pulse is made very long (e.g. 20 s).
Tail current considerations
To account for the increased tail current occurring as the result of large depolarizations (V > 40 mV), we include a long-lasting open channel state (O3, Fig. 2) analogous to that described by Pietrobon & Hess (1990) by lumping together of two distinct gating patterns into one additional state. The rate function k23 associated with the O2⇌ O3 transition becomes much more significant at larger and longer depolarizations, which results in more channels assuming the O3 configuration. The resulting inward current is exhibited as a tail current before deactivation occurs. In the model we assume that the single channel conductance due to open state O3 is the same as that of O2.
Determination of transition rates
Modelling voltage-dependent activation
The rate transition functions engaged in channel activation, k12 and k21, are considered to be voltage dependent. Since the time constants of L-type channel activation kinetics are much faster (≥100 times) than those of inactivation kinetics, we can reasonably approximate that channel activation is isolated from channel inactivation. Thus voltage-dependent k12 and k21 can be obtained from the simple open and closed channel gating scheme,
| (3) |
with the following equations:
| (4) |
where dPC1 and PO2 represent the probability of the channel staying in state C1 or O2, respectively; they are subject to the conservation equation PC1+PO2 = 1 at any time. Equation (4) can alternatively be written as a function of steady-state activation and the activation time constant:
| (5) |
where PO2(V) is the steady-state activation of the channel and τPO2(V) is the time constant. Hence:
| (6) |
k12(V) and k21(V) can be determined by:
| (7) |
Experimental data for activation variables (P¯O2(V) and τPO2(V)) were obtained and processed by considering voltage-dependent channel conductance as suggested in our modified GHK model.
A Boltzmann function is used to describe steady-state activation variableP¯O2(V) based on voltage-clamp data in rat ventricular cells from our laboratory, which is consistent with general recognition that cardiac L-type channels activate very rapidly and with sigmoid kinetics in response to membrane depolarization (Hess, 1990). Figure 3A shows the model-generatedP¯O2(V) and τPO2(V) curves compared with measured data. The voltage-dependent relationship for the activation time constant τPO2(V) is well described by the sum of two Gaussian functions (Fig. 3B). The transformation given by eqn (7) provides appropriate expressions for k12(V) and k21(V).
Figure 3.
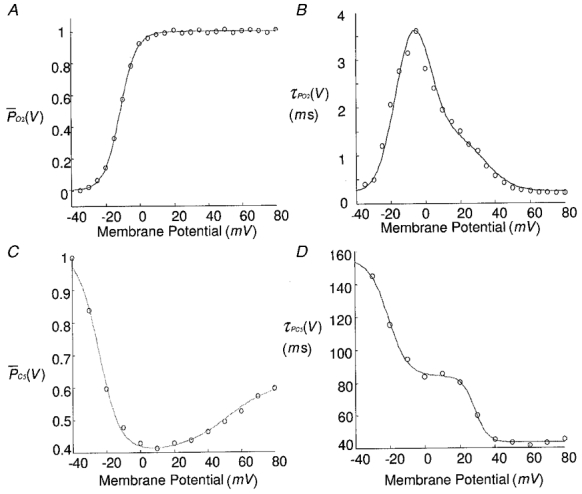
A, steady-state activationP¯O2(V) (1.0 mM [Ca2+]o). B, activation time constant τPO2(V). C, steady-state inactivationP¯C5(V). D, inactivation time constant τPC5(V). No Ca2+ or Ba2+ was in the extracellular solution.
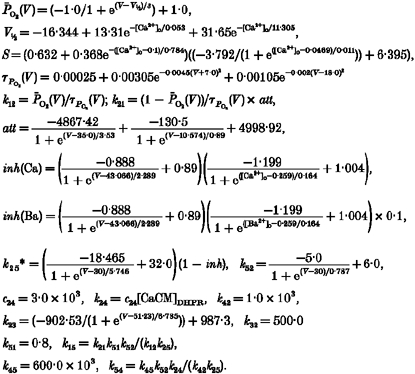
It is well known that divalent ions can alter ion channel gating by screening of and/or binding to negative charges located on membrane surfaces in the vicinity of channel pores. Previous investigations have demonstrated that external Ca2+ can cause changes in L-type channel gating in such a manner that the current-voltage (i–V) relations for peak ICa,L currents are shifted along the voltage axis in the positive direction (Krafte & Kass, 1988). These voltage shifts in the i–V curves can be modelled in terms of a [Ca2+]o-dependent half-activation voltage (V½, given in Table 5 of Appendix B) and the slope S of the steady-state activation curve evaluated at V½.
Table 5.
Parameters in the model
| GHK formulations: | |||
| Five-state Markovian model: | |||
|
| Parameter | Definition | Value |
|---|---|---|
| F | Faraday’s constant | 96.5 C mmol−1 |
| R | Ideal gas constant | 8.314 J mol−1 K−1 |
| T | Absolute temperature | 290 K |
| I¯up | Maximum sarcolemmal Ca2+ uptake current | 4.0 mM s−1 |
| Km,up | Half-saturation constant for SR Ca2+-ATPase pump | 9.2 × 10⁻⁴ mM |
| Txfer | Time constant for transfer from subspace to myoplasm | 3.125 × 10⁻³s |
| I¯p(Ca) | Maximum sarcolemmal Ca2+ pump current | 1.15 μA μF−1 |
| Km,p(Ca) | Ca2+ half-saturation constant for SL Ca2+ pump | 5.0 × 10⁻⁴ mM |
| Km,Na | Na+ half-saturation constant for Na+-Ca2+ exchange | 87.5 mM |
| Km,Ca | Ca2+ half-saturation constant for Na+-Ca2+ exchange | 1.38 mM |
| kNaCa | Scaling factor of Na+-Ca2+ exchange | 2000 μA μF−1 |
| [CM]tot | Total concentration of calmodulin | 24.0 μM |
| k+CM | Association rate for Ca2+ binding to calmodulin | 2.4 × 10⁴ mM−1 s−1 |
| k−CM | Dissociation rate of Ca2+ from ligand | 38.0 s−1 |
| Vmyo | Myoplasmic volume | 7.884 × 10⁻³ nl |
| volcleft | Restricted cleft space volume around DHPR | πΔr2Δz |
| Δr | Grid radius | 2.0 × 10⁻²μm |
| Δz | Grid length | 3.0 × 10⁻³μm |
| zNa, zCs | Valence of Na+ and Cs+ ions. | 1.0 |
| zCa, zBa | Valence of Ca2+ and Ba2+ ions | 2.0 |
| GNa,b | maximum background Na+ current conductance | 0.00141 |
In our experiments, small increases in [Ca2+]o over the range 0 ≤[Ca2+]o≤ 1.0 mM produced depolarizing shifts of V½ from -28.6 to -11.4 mV. Further increases in [Ca2+]o cause progressively more positive shifts in the voltage-dependent steady-state activation curve as noted in Kwan & Kass (1993). This shifting effect saturates at approximately 40 mM (Kwan & Kass, 1993). Therefore, the effect of surface potential due to the presence of Ca2+ ions has a significant influence on the steady-state activation of the L-type channel at lower values of [Ca2+]o, and in the range of our experiments. To characterize this activation shift quantitatively, we combined our own steady-state activation data in the range 0 ≤[Ca2+]o≤ 1.0 mM, with that of Kwan & Kass (1993), which were taken over a much wider range of [Ca2+]o values in guinea-pig ventricular cells. We used the mathematical expression for V½ given in Table 5 (Appendix B) to characterize the [Ca2+]o dependence of V½, and subsequently obtained a good least-squares fit to the combined [Ca2+]o-V½ data. The analytical representation for S relating to the inverse slope of the activation curve at V½ was also studied. The expression used for S is also given in Table 5. The functions V½ and S are part of the expression used to describe the steady-state activation functionP¯O2(V).
Modelling voltage-dependent inactivation
Due to the parallel nature of the two inactivation pathways proposed in the model, it is necessary to utilize data from different experiments which attempt to separate the pathways chemically. Ionic substitution experiments that remove Ca2+ and promote the flux of Na+ and Cs+ ions through the L-type channel can help elucidate the voltage-dependent aspects of channel inactivation. Based upon experiments with 140 mM [Na+]o (no Ca2+o and no Ba2+o) and 140 mM [Cs+]i, we were able to determine the rate functions pertaining to the voltage-dependent inactivation pathway in the five-state model.
Likewise, the voltage-dependent inactivation rate constants k25(V) and k52(V) can be approximately obtained from a simple open and inactivated channel gating scheme:
| (8) |
We will neglect the derivation process of the relationships between k25(V) and k52(V) and between steady-state inactivationP¯C5(V) and inactivation time constant τPC5(V), which is similar to eqns (4)–(7). A combination of two Boltzmann functions was adopted to simulateP¯C5(V), whereas τPC5(V) was described by two additional Boltzmann functions. Figure 3C and D shows model-generated and experimentally obtained data for these two functions, respectively. In this case, no Ca2+ was present and the voltage-dependent component of inactivation was maximized (see later discussion of Ca2+-dependent inhibition of the voltage-dependent pathway); Fig. 3C was obtained using a two-pulse protocol with a 100 ms interval in between.
It should be noted that k25(V) and k52(V) obtained from the above scheme are not accurate, since voltage-dependent inactivation () is not completely independent of voltage-dependent activation (C1⇌ O2), and there is some effect from transitions to the additional open state (O2⇌ O3). However, the k25(V) and k52(V) here can be adopted as initial values of the Marquardt iteration method to obtain final parameter estimates. To simulate the experimental observation that Ca2+ channel open probability is around ∼0.3-0.7 at ∼+10 to +60 mV depolarizations (Cachelin et al. 1983), we introduce an attenuation factor att to the k21 formulation (Table 5).
Formulation of whole-cell current
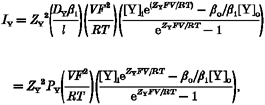
The whole-cell macroscopic current ICa,L is represented according to the equation:
| (9) |
where Po is the probability that a functionally available channel will be open, N is the total number of channels in a myocyte, and itot is the microscopic unitary total current going through each open L-type Ca2+ channel. Specifically, itot, composed of mixtures of iNa, iCs, iCa and iBa, represents the maximum current going through the channel during its opening period. In our model Po is characterized by the sum of two open states: Po =PO2+PO3; and itot is determined by a voltage-dependent constant field type formulation for the individual ion transfer process, i.e. Goldman-Hodgkin-Katz (GHK) equations.
EXPERIMENTAL METHODS
Experiments were carried out according to procedures submitted to and approved by the Animal Care and Use Committee of the University of Texas Medical Branch. Rats were administered with i.p. heparin 30 min prior to anaesthesia with i.p. 30-35 mg pentobarbital sodium per animal. After all reflex activity had ceased, the animal was killed by opening the chest and rapidly removing the heart.
Rat ventricular myocytes were prepared from 200-300 g male Sprague-Dawley rats by dissociation with collagenase (Yakult Pharmaceuticals, Tokyo, Japan) as previously described (Fan & Palade, 1998). Myocytes were stored at 4°C in a low sodium, high potassium solution (Zahradnik & Palade, 1993) until use.
Whole-cell patch clamp (List EPC-7) measurements were performed with a perforated patch version of the whole-cell recording configuration with the use of 50 μM β-escin in the pipette solution (Fan & Palade, 1998) to circumvent Ca2+ channel run-down. Capacitative currents were normally minimized by analog compensation but in most cases were additionally subtracted by recording current traces in the presence of 3-4 mM cobalt, which blocks L-type ionic current but not associated gating currents or capacitative currents (Fan & Palade, 1999). All experiments were performed at room temperature. Data acquisition and subtraction utilized pCLAMP (Axon Instruments, Burlingame, CA, USA).
Normal Tyrode solution contained 1 mM Ca2+, with Cs+ substituted for K+ for purposes of blocking inward rectifier currents in most experiments: 140 mM NaCl, 1 mM CaCl2, 0.5 mM MgCl2, 3 mM CsCl, 5.6 mM glucose, 10 mM Hepes, pH 7.3. In some experiments, 1 mM BaCl2 was substituted for CaCl2 (so that Ba2+ would be the carrier of inward current), and in other cases 140 mM NaCl, 0.05 mM MgCl2 and 0.33 mM EGTA were substituted for 140 mM NaCl, 1 mM CaCl2 and 0.5 mM MgCl2 (so that Na+ would be the inward current carrier). Certain other experiments also employed solutions of 0.01-0.1 mM CaCl2 and 0.05 mM MgCl2 or 0.03-0.3 mM BaCl2 and 0.05 mM MgCl2 instead of 1 mM CaCl2 and 0.5 mM MgCl2. Holding potential was -40 or -50 mV in most experiments, but in experiments with more negative holding potentials, Na+ in the external solution was replaced by TEA+ to limit Na+ current contributions to the recordings. The internal (pipette) solution for all experiments consisted of 120 mM caesium aspartate supplemented with 20 mM CsCl, 3 mM Na2ATP, 3.5 mM MgCl2 and 5 mM Hepes, pH 7.3, together with 50 μM β-escin. Pipette resistances were 2-5 MΩ.
Computational aspects of the model
All simulations and analyses were performed on a 233 MHz Intel Pentium II-based PC workstation using the Microsoft Windows NT 4.0 operating system. To find the parameters involved in the GHK equations, a non-linear least-squares method (Marquardt, 1963) was used to obtain the solution of the system of non-linear ordinary differential equations. Table 1 provides specifications of parameters relating to corresponding experimental values. Specifically, we have employed an algorithm given by Lau (1995, pp. 354-358). The numerical integration scheme used to solve the full set of nine 1st-order differential equations describing the dynamic model was the Merson-modified Runge-Kutta 4th-order adaptive step algorithm (Kubicek & Marek, 1983). The error from all variables was normalized to ensure that all variables contributed equally to the global error calculation. The explicit finite difference scheme was used to numerically solve the Laplacian equations of Ca2+ diffusion in the cleft space. Detailed numerical methods are similar to those presented by Smith et al. (1998). The results were visualized using Matlab by Mathworks and Origin by Microcal Software.
Table 1.
Specification of parameter estimation and related experimental values
| Parameters in the model | Experimental data for determination |
|---|---|
| Parameters estimation in modified GHK formulations | |
| PNa, PCs[Na+]DHPR, [Cs+]DHPR (initial conditions) | Peak currents of ‘control’ solution: External: 140.0 mM [Na+]0, 3.0 mM [Cs+]o; internal: 140.0 [Cs+]i |
| PCa, [Ca2+]DHPR (initial conditions), KCa(V) | Peak currents of ‘Ca2+’ solution: Add 1.0 mM [Ca2+]o, 0.3 mM [Ca2+]o and 0.1 mM [Ca2+]o to ‘control’ solution |
| PBa, [Ba2+]DHPR (initial condition), KBa(V) | Peak currents of ‘Ba2+’ solution Add 1.0 mM [Ba2+]o, 0.3 mM [Ba2+]o and 0.1 mM [Ba2+]o to ‘control’ solution |
| Parameters in five-state dynamic model | |
| k12, k21 | Steady-state activation and activation time constants |
| k25, k52, k23, k32, k51, k15 | Steady-state inactivation and inactivation time constant; dynamic inactivation of data from ‘control’ solution; tail currents of ‘control’ solution |
| k24, k42, k45, k54 | Dynamic inactivation of data from ‘Ca2+’ solution and ‘Ba2+’ solution |
RESULTS
Our L-type Ca2+ current model was tested extensively using a variety of whole-cell voltage clamp stimulation protocols and experimental manipulations of the ionic composition of the external bathing medium of the cell. In all cases considered, the model predictions agree very well with the experimental data obtained in our laboratory.
L-type currents evoked by depolarizing pulses
Whole-cell voltage clamp recordings obtained at room temperature and with Cs+ in the pipette to block outward K+ currents provided good isolation of the L-type Ca2+ currents elicited by depolarizing voltage clamp pulses. In isolating the dihydropyridine (DHP)-sensitive current for voltage clamp study, precautions were taken to eliminate SR Ca2+ release (ryanodine), which could affect the cytosolic concentration ([Ca2+]i) and Ca2+-dependent inactivation mechanisms associated with the iCa current. However, the current flowing through the L-type channel is not a pure Ca2+ current. Rather, several different types of ions can permeate the channel, including Na+, K+, Cs+, Ba2+ and Ca2+. Total channel current is therefore the sum of these component currents, whose strength is dictated by the ionic compositions of the bathing medium and the pipette solution as well as the voltage-dependent ion binding characteristics within the channel.
Since Cs+ is always present at a high concentration in the cytosol and almost absent in the extracellular medium, the outward Cs+ current, iCs, provides a background current in all testing protocols. The experiments involving bathing medium substitutions were designed to test the response of the L-type channel to different permeant ions that could provide inward current. In each of these tests, the composition of the bathing solution was such that a single ion acted as the majority charge carrier (Na+, Ba2+, Ca2+). In 140 mM Na+, Na+ is the majority inward charge carrier (iNa); in 140 mM Na+-1.0 mM Ba2+, Ba2+ is the majority carrier (iBa) and the flux of Na+ is partially blocked; and in 140 mM Na+-1.0 mM Ca2+, Ca2+ is the majority carrier (iCa) and Na+ flux is blocked to the greatest extent (discussed later).
Typical recordings of ICa,L (with Na+, Ba2+ and Ca2+ as charge carrier) are shown in Fig. 4. To characterize the dynamics of different ionic currents, two important issues must be considered: (a) the peak amplitude of current with depolarization, which accounts for the ionic flux through the L-type channel upon opening, and (b) the time course of current decay throughout the duration of depolarization. The latter is related to inactivation mechanisms involved in the five-state Markovian model describing the kinetics of the channel.
For the simplest case (only 140 mM [Na+]o present extracellularly), the observed current is the aggregate sum of time-averaged <iNa> and <iCs> (i.e. iNaNPo and iCsNPo) contributed by all the channels in the cell. This case is important in that the resultant current inactivates, but by an inactivation mechanism that is only voltage dependent (Kass & Sanguinetti, 1984). These data provide a convenient way to estimate the corresponding rate constants (k25 and k52) in the five-state kinetic model.
The attenuation of total current amplitude by Ca2+ is more obvious at higher depolarizations (Fig. 4B), wherein the Ca2+ component current is small and the reduced current amplitude can be attributed to the inhibition of iNa and iCs. In addition to the attenuation in amplitude brought on by increased [Ca2+]o, there is a pronounced change in inactivation dynamics in the presence of calcium (see Fig. 4A).
The external solution containing 140 mM Na+ and 1 mM Ba2+ stands between the two previous cases and represents an intermediate case with regard to current amplitude. In addition, it has been reported that Ba2+ binds less well within the Ca2+ channel. Consequently, we assume that Ba2+ blocks Na+ and Cs+ flux less effectively than Ca2+ (Kostyuk et al. 1983). We treat the amplitude and inactivation dynamics issues mentioned above separately and in detail below.
Ion transfer characteristics modelled by modified GHK equations
It can be seen clearly from Fig. 3B and D that the activation time constants of the L-type channel are much faster than those of inactivation. Therefore, upon depolarization, the channel open probabilities will become maximal very quickly (<10 ms). In Fig. 5 we concentrate on data recorded at positive potentials, where the channel has been fully activated (also shown in Fig. 3A). Consequently, we consider the peak value of L-type current from experimental data to represent the aggregate maximum current flowing through the channel, i.e. itotNPo in eqn (9).
Figure 5. Aggregate itot (itotN) obtained from GHK formulation and peak current amplitudes from experiment.
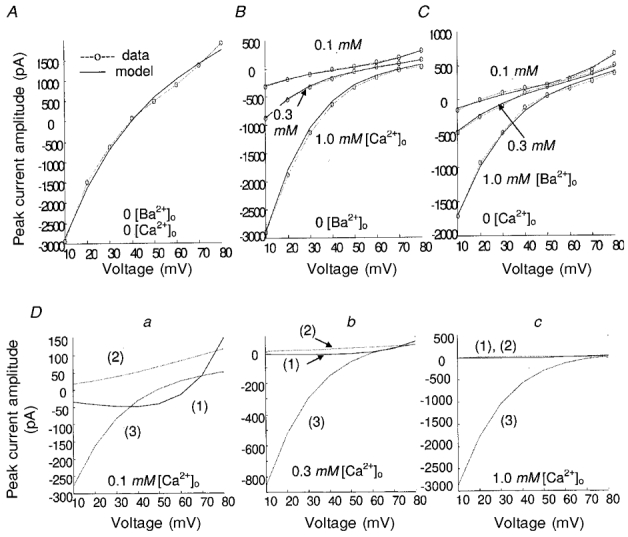
A, extracellular Na+ only. B, extracellular Ca2+ and N+. C, extracellular Ba+ and Na+. D, component currents: 1, iNaN; 2, iCsN; 3, iCaN in 0.1 mM (a), 0.3 mM (b) or 1 mM [Ca2+]o (c). In all cases 140.0 mM [Na+]o, 140.0 mM [Cs+]i and 3.0 mM [Cs+]o.
Our modified GHK formulation with parameters describing individual ion movements in the L-type channel is given in Tables 3 and 5 (Appendix B). The extracellular ion concentrations ([Na+]o, [Cs+]o, [Ba2+]o, [Ca2+]o) are considered to be constant, since the extracellular volume is much larger than the internal cell volume. The intracellular and cleft space ion concentrations ([Na+]i, [Ca2+]i, [Ba2+]i, [Ca2+]cleft, [Ba2+]cleft) are treated as state variables (differential equations describing [Ba2+]i and [Ba2+]cleft are similar to those describing [Ca2+]i and [Ca2+]cleft). The voltage-dependent functions KCa(V) and KBa(V) provided in Appendix B (Table 3) characterize the blocking effects of L-type channel by extracellular divalent ions.
Figure 5A shows the GHK model-generated aggregate whole-cell maximum current (itotN) from the unitary combined flux itot and the recorded peak L-type channel current values at various depolarizations, under the experimental condition that Na+ and Cs+ are the charge carriers. It should be noted here that the peak current values are divided by Po (i.e. ICa,L/Po =itotN). In Fig. 5B, the model results are compared with data for the case where Ca2+ is the charge carrier. We note the incremental suppression of outward Na+/Cs+ current in the voltage range V > 40 mV as a function of increasing extracellular Ca2+ concentration. Figure 5C shows the model results and data with Ba2+ as the charge carrier; the blockade of the channel to outward Na+/Cs+ current at high voltages (V > 40 mV) is much less effective than with Ca2+ as the carrier (compare Fig. 5B and C at comparable concentrations of extracellular Ba2+ and Ca2+). The relative strength of each component current in the model is shown in Fig. 5D. When extracellular Ca2+ is small (0.1 mM, Fig. 5Da), the combined itot is mainly composed of Na+ and Cs+ flux (iNa and iCs), which is quite strong and outward for V > 50 mV. With increasing [Ca2+]o (>0.1 mM, Fig. 5Db and c), the currents iNa and iCs are suppressed, and the Ca2+ flux component becomes more and more dominant, which represents the influence of the equation for KCa(V) in Table 3. When [Ca2+]o = 1.0 mM, itot is almost completely carried by Ca2+ due to the nearly complete blockage of Na+ and Cs+ flux by [Ca2+]o (Fig. 5Dc). Blockade of the component currents iNa and iCs by extracellular Ba2+ or Ca2+ is accomplished in the model via eqns (1) and (2), respectively. Extracellular Ba2+ is much less effective in blocking these currents than extracellular Ca2+ at comparable concentration. The coefficients used for Ca2+ and Ba2+ blockade of iNa and iCs are different in our model, where Ca2+ block is stronger at higher depolarizations (see equations in Table 3). Parameters relating to the GHK expressions are provided in Table 5.
Simulation of L-type channel inactivation by five-state dynamic model
Na+ as the charge carrier
An initial test is to verify that the model-generated L-type channel current is consistent in shape and amplitude with experimentally recorded values. The model is driven by depolarization steps (Fig. 6A), which are a series of pulses from -40 mV to +10 mV, +20 mV, …+80 mV. Model-generated current amplitude calculated by the GHK equations for the fully open channel are used to obtain the ion transfer characteristics of the membrane.
Figure 6. L-type current simulation (Na+ as the charge carrier).
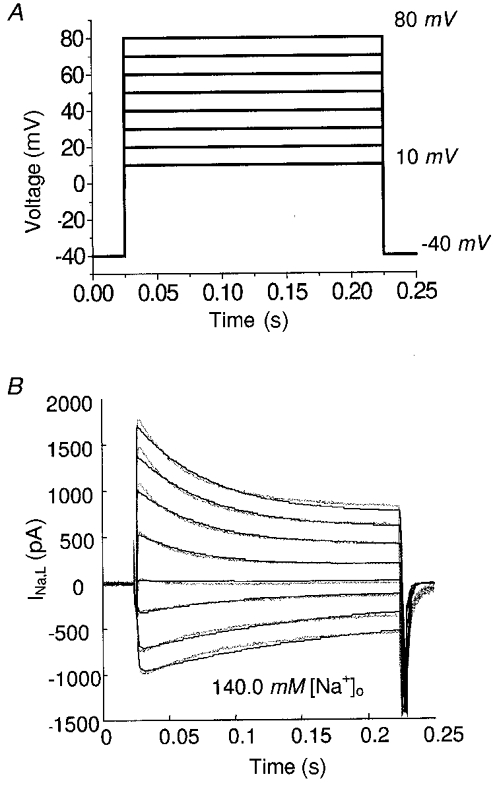
A, experimental protocol. B, dotted line, recorded current; continuous line, model-generated current.
When Na+ is the only significant cation present in the extracellular medium, the L-type channel does not experience divalent flux such as Ca2+ or Ba2+, and only reflects inactivation characteristics of the voltage-dependent pathway () in the model. In this situation, the model is implemented with k24≡ 0. Figure 6B shows the recorded (dotted line) and model-generated (continuous line) L-type currents from the same protocol, which agree quite well. With increasing depolarization, the combined current changes from inward to outward, due to reduction in the driving force for Na+ and an increased driving force for Cs+.
Ca2+ as the charge carrier
In the presence of extracellular Ca2+, there is Ca2+ influx through the L-type channel, which brings about calcium-dependent inactivation. In our experiments, inactivation was increased by raising [Ca2+]o. The simplest interpretation is that the rate of inactivation can be increased or decreased at a given test potential by grading the amount of Ca2+ entry through individual channels.
An analysis of inactivation time constants from experimental data is provided in Table 2. In the control case when there is no Ca2+ or Ba2+ in the extracellular medium the time constants of the recorded inward currents (generally depolarization level <40 mV) are larger than other cases. Particularly, among these experimental conditions, time constants of inward currents are the smallest in the situation of [Ca2+]o = 1.0 mM, which indicates greater inactivation when more Ca2+ is present extracellularly.
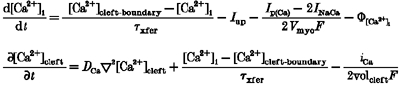
To characterize inactivation produced by dynamic changes of local Ca2+ concentration in the cleft subspace around DHPR ([Ca2+]DHPR), the full set of model equations given in Table 4 was used. It has recently been reported (Zühlke et al. 1999) that calmodulin (CM) is the Ca2+ sensor for Ca2+-dependent inactivation of L-type calcium channels, utilizing local intracellular free [Ca2+] around the DHPR as the trigger. Consequently, we formulate the Ca2+-mediated inactivation rate constant k24 in our model as:
| (10) |
where c24 is a constant and [CaCM]DHPR is the Ca-calmodulin complex which is characterized by the endogenous Ca2+ buffer equation:
| (11) |
Table 4.
Differential equations and current expressions of the whole model
| Five-state Markovian model: | |
| |
| Intracellular Na+ concentration: | |
| | |
| Intracellular Ca2+ concentration: | |
| |
| Intracellular Ca2+ buffering: Calmodulin (bulk myoplasm): | |
| | |
| Troponin | |
| | |
| Rate of flux of Ca2+ onto intracellular troponin buffers: | |
|
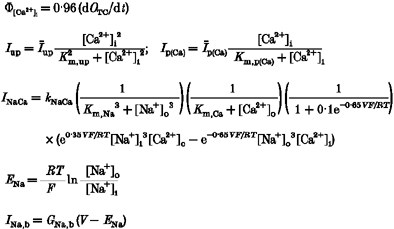
Equation (11) suggests that calmodulin binding to α1C depends on the local concentration of Ca2+. A Hill coefficient of 3 is adopted in accordance with experimental observations (Qin et al. 1999). Total concentration of calmodulin ([CM]tot) and calmodulin association and dissociation rate constants k+CM and k−CM are from Smith et al. (1998).
Figure 7 shows model-generated predictions to measured ICa,L currents evoked at various test potentials from a holding potential of -40 mV. The brief inward and outward currents seen at the beginning and end of each pulse in Fig. 7A and B are remnants due to the analog subtraction of capacitative current. With Ca2+ as the majority carrier, inactivation of the channel is achieved through functioning of both the ‘voltage-dependent’ () and ‘calcium-dependent’ () pathways. The inward current inactivation is dependent on two major experimental conditions: depolarization level and extracellular Ca2+ concentration. At a fixed [Ca2+]o, increasing depolarization slowed inward current inactivation (Table 2, 1.0 mM [Ca2+]o, 0 [Ba2+]o and 0.3 mM [Ca2+]o, 0 [Ba2+]o, depolarization levels 10 to 80 mV; Fig. 7A); at the same depolarization level, increasing [Ca2+]o increased the rate of inactivation. At low values of [Ca2+]o (e.g. 0.3 mM, Fig. 7B), inactivation at higher depolarization is much like those traces obtained with Ca2+-free solution (refer to Table 2, 0 [Ca2+]o, 0 [Ba2+]o and 0.3 [Ca2+]o, 0 [Ba2+]o, inactivation time constants are around 40.0 ms), wherein inactivation is primarily carried by the voltage-dependent pathway due to the much smaller [Ca2+]DHPR in this case.
Figure 7. L-type current elicited by depolarization steps.
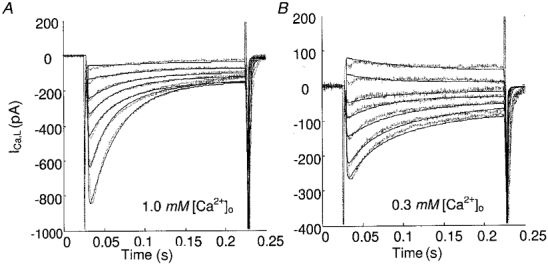
Continuous lines, model results; dotted lines, data. Same protocol as used in Fig. 6A.
Stern (1992) formulated the ‘local control’ theory, which stipulates that ‘local events’ (local [Ca2+]i, and unitary L-type currents) actually determine the course of E-C coupling and the voltage dependence of macroscopically observable macroscopic [Ca2+]i transients, with regenerative behaviour prevented by not allowing adjacent release sites to activate one another. To investigate the validity of our model to local control theory, we have compared simulations at negative and positive depolarizations, which elicit a similar amplitude of whole-cell calcium currents. Comparing data traces at -15 and +35 mV, it is clear that the Ca2+-dependent inactivation time constant corresponding to the initial fast decay is smaller at the negative potential than at the positive potential (Fig. 8). The model simulations produce similar results in that the current inactivates more rapidly at the negative potentials. This is due to the fact that the Ca2+ flux through each conducting channel is greater at negative depolarizations than at positive potentials, although the number of conducting channels in the whole cell is much smaller at negative potentials. The bigger ‘unitary’ currents at negative depolarizations are much more likely to inactivate the L-type channel to a greater extent. Therefore, the model agrees with the hypothesis of local control theory.
Figure 8. Simulations at -15 and +35 mV.
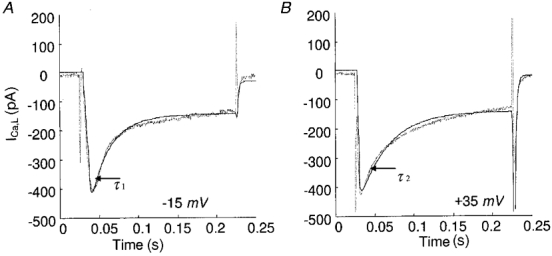
Time constants of early decay are: A: τ1, 16.08 ms (experimental) and 17.63 ms (model); B: τ2, 32.67 ms (experimental) and 35.19 ms (model). Unitary currents at -15 and +35 mV are -0.759 and -0.067 pA, respectively.
Ba2+ as the charge carrier
In the past, it has been suggested that inactivation of Ba2+ current through cardiac L-type channels is purely voltage dependent (Lee et al. 1985; Boyett et al. 1994). Recent findings, however, call this hypothesis into question by suggesting that Ba2+ causes inactivation by binding to the Ca2+-inactivation site (Ferreira et al. 1997). Their evidence strongly favours a mechanism whereby the fast phase of L-type current decay is caused by Ba2+ binding to the channel’s Ca2+-inactivation site, although the affinity of the inactivation site is reckoned to be ∼100 times lower for Ba2+ than Ca2+.
Our experimental data regarding inward Ba2+ current decay (Fig. 9) indicate that the time constants of decay are longer than those of inward Ca2+ current decay. To characterize this kind of Ba2+-dependent inactivation, we have retained the model configuration of Ca2+ as the charge carrier, but decreased the Ba2+ association constant to 10 % that of Ca2+. Other model parameters remain fixed. Compared to Ferreira et al. (1997), our model suggests a smaller reduction in Ba2+ affinity, perhaps because their Ca2+ data were obtained in the presence of Ca2+ release from RyRs, which would greatly enhance the observed Ca2+-dependent inactivation. These channels were blocked in our experiments.
Figure 9. L-type currents elicited by depolarization steps.
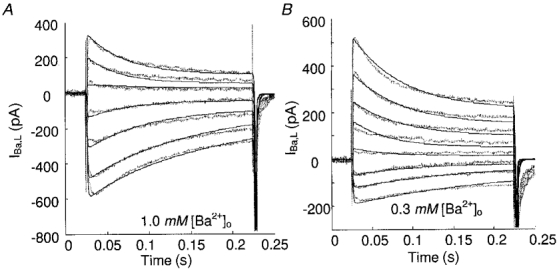
Continuous lines, model results; dotted lines, data. Same protocol as used in Fig. 6A.
The model-generated Ba2+ current waveforms (Fig. 9) are similar to IBa,L data measured in the typical adult rat ventricular myocyte. Some discrepancies are found at high depolarization steps in the presence of low extracellular Ba2+ concentration (0.3 mM, Fig. 9B), where the data indicate even slower inactivation than that observed in the Ba2+-free experiment (Table 2). Such a phenomenon also occurs in lower [Ca2+]o (Fig. 7B). To explain it, one must adopt a Ca2+- or Ba2+-dependent inhibition effect in the voltage-dependent inactivation pathway, which attenuates the rate coefficient k25 in the control case (where only Na+ and Cs+ are the charge carriers). The new coefficient (denoted k25*) can be formulated as the product of a conventional rate coefficient and an inhibition factor,
| (12) |
Here the Ca2+- or Ba2+-dependent inhibition function, inh, rises in value from 0.2 at 40 mV to 0.9 at 80 mV (corresponding to a larger inhibition effect) when [Ca2+]o = 1.0 mM.
Further studies on L-type channel inactivation
Steady-state inactivation of the L-type channel can be measured using a conventional double-pulse protocol (Hadley & Hume, 1987). Membrane potential is first stepped from -80 mV to various potentials for 400 ms and then to 0 mV for 100 ms (test pulse) and finally clamped back to the holding potential of -80 mV (Fig. 10C). The conventional double-pulse protocol maximizes any voltage-dependent effect by eliminating the interval separating the pulses to avoid time-dependent recovery from inactivation. It also avoids Ca2+ tail currents during the interval that could lead to additional inactivation.
Figure 10. Steady-state inactivation of L-type channels.
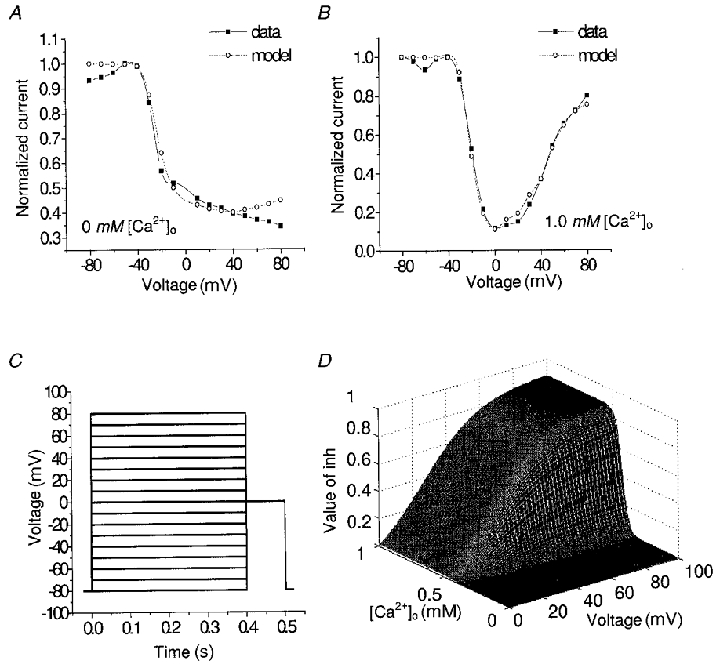
A, inactivation curve without Ca2+o. B, inactivation curve in the presence of 1 mM [Ca2+]o. C, inactivation protocol. D, function to explain decreased voltage-dependent inactivation in the presence of Ca2+o.
The kinetics of steady-state inactivation of L-type current from experimental recordings on the same cell are shown in Fig. 10A and B, corresponding to data with and without extracellular Ca2+. Specifically, the following two aspects of the steady-state inactivation (f∞) need to be considered.
(a) In the depolarization range of -30 mV ≤V≤ 30 mV, under conditions where Na+ acts as the charge carrier, inactivation is believed to be significantly voltage dependent. The monotonically decreasing inactivation curve reveals more inactivation at higher depolarization steps. When Ca2+ is the charge carrier, in addition to the voltage-dependent inactivation, there is Ca2+-mediated inactivation. This results in a combined inactivation, which is much more effective (i.e. f∞,Ca < 0.1 in Fig. 10B, in contrast to f∞,Na > 0.4 in the Na+ case). All of these observations are consistent with the general concept discussed in previous sections.
(b) At higher depolarization (V > 40 mV), there is a pronounced removal of inactivation in the presence of 1.0 mM [Ca2+]o. The f∞,Ca curve is U-shaped and returns to 0.8 at V = 80 mV. At this high voltage, there is relatively little contribution from Ca2+-dependent inactivation, and therefore a question arises as to why there is much less inactivation observed in f∞,Ca, compared with that in f∞,Na. Our explanation is that there must be another mechanism involved. We suggest that there is a mechanism producing inhibition of the voltage-dependent inactivation pathway (). Specifically we consider the rate function k25* to be a function of both voltage and calcium concentration, which mediates a Ca2+o-dependent inhibition of the voltage-dependent pathway. Thus, when [Ca2+]o is sufficiently high, this inhibition process is activated, but it is manifest only at potentials greater than +40 mV, when Ca2+-dependent inactivation is not masking it.
Figure 10D shows inh as a function of two parameters, [Ca2+]o and V. Note that the inhibition function increases sharply with increasing [Ca2+]o (e.g. inh≡ 0.1 when [Ca2+]o < 0.1 mM; inh≡ 0.9 when [Ca2+]o = 1.0 mM). It also increases with voltages above +20 mV, but more slowly than with increases in [Ca2+]o.
Using the expression for k25* inhibition given in Table 5, the model produces good fits to inactivation data (i.e. the curves f∞,Na and f∞,Ca shown in Fig. 10A and B).
Single channel activity simulations
Another important issue of the verification of the model is to examine whether it can reproduce ionic current at the single channel activity level. With our five-state model and parameters derived exclusively from fits to macroscopic whole-cell current data, we simulated single channel recording by using our model embedded in the QuB program package (Qin et al. 1996).
We have estimated the average duration of a channel opening (mean open time) by the equation:
| (13) |
where Po is the fraction of the time a channel spends open (open probability) and r is the average opening rate obtained by counting the number of opening transitions n during the period Tpover which the time-averaged current was calculated (r = n/Tp). For the model results shown in Fig. 11A, the mean open time increases from 0.84 ms at a pulse potential of 0 mV to 1.7 ms for a pulse to 20 mV. These results are similar to those reported for Ca2+ channels (0.65 ms and 1.4 ms respectively, Fenwick et al. 1982). Summed currents in Fig. 11B display inactivation.
Figure 11. Simulation of single channel activity at different clamp voltages.
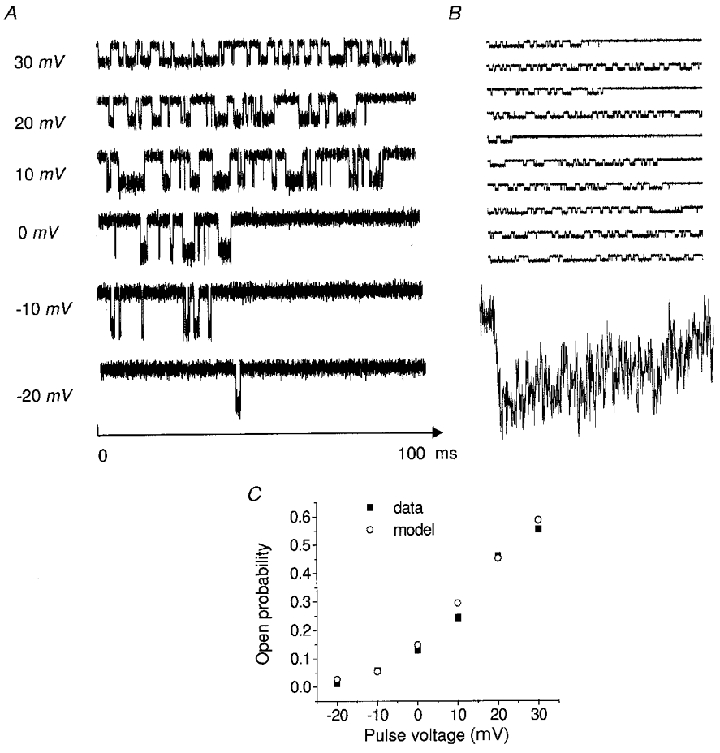
Openings are downwards. A, V = -20 to +30 mV, [Ca2+]o = 1.0 mM, resting potential = -60 mV. B, simulation of 10 individual 90 ms sweeps at a fixed depolarization V to 20 mV. The corresponding summed current is shown below the sweeps. C, model-generated voltage dependence of the single channel using Ba2+ as charge carrier ([Ba2+]o = 100 mM) compared with experimental data from Reuter et al. (1982).
Our model predictions also yield results (Fig. 11C) that are similar to the analysis of single calcium channel data from cultured rat ventricular cells (Reuter et al. 1982). These data show that the open probability of a single channel increased from nearly zero at a membrane potential of -30 mV to 0.6 at around +30 mV. The simulations were run with the same bathing solutions and voltage protocol as used by Reuter et al. These simulations are not equivalent to fittings of open and closed time histograms, but merely an indication that the model is at least roughly consistent with published single channel behaviour.
Although the open channel probability simulation is consistent with experimental observations, it is important to be aware that the current five-state model, as presently configured, cannot produce so-called ‘modal behaviour’ (specifically, the occurrence of blank records on some sweeps, even with strong depolarization). A possible way to address this shortcoming is to re-configure the model to include an additional closed state (C6, in front of C1) and to utilize slow rate constants for the C6⇌ C1 transitions. Such simulations have yielded blank traces interspersed with traces of normal activity (not shown), as reported for modal behaviour by various investigators.
DISCUSSION
Mathematical modelling constitutes an important complement to experimental work in that it attempts to elucidate the ionic basis underlying electrophysiological phenomena. Our study focuses on several important mechanisms including: (1) the mechanism of ion selectivity in calcium channels, as judged by the block of Na+ and Cs+ currents through channels by external Ca2+ and Ba2+; (2) the characterization of combined voltage- and Ca2+- (or Ba2+)- dependent inactivation (as divalent ions binding to calmodulin); and (3) a new insight into the nature of Ca2+ channel inactivation, in that Ca2+ and Ba2+ cannot only induce inactivation, but also inhibit the voltage-dependent pathway. Our simulations of whole-cell Ca2+ currents are made both below and above the equilibrium potential, compared with previous studies which have considered only inward currents. Moreover, the five-state dynamic model has been used to simulate single channel activity, and successful predictions of channel open probability have been made that are consistent with experimental data from rat ventricular cells. Overall, the model has been tested in a variety of ways, including the application of a variety of depolarization steps and bathing solution manipulations. The model provides remarkable fits to a wide range of data. We conclude that it has a very wide predictive range.
L-type channel selectivity
Experimental observations have indicated that reversal of current direction through the L-type channel was not as obvious with Ca2+ as with Ba2+ as the permeant divalent cation in the external medium (Lee & Tsien, 1984). From our data (Figs 7 and 9), it also can be seen that the magnitude of outward current in the presence of extracellular Ca2+ is smaller at increasingly strong pulses (>50 mV), compared with larger outward currents in the presence of external Ba2+. We employed smaller voltage-dependent binding functions (eqns (1) and (2)) for Ba2+ than for Ca2+. This configuration results in the smaller attenuation by Ba2+ of combined outward Na+ and Cs+ currents (see Figs 7 and 9 for comparison).
The similar exponential function form of the voltage-dependent binding functions KCa(V) and KBa(V) (Table 3), implies similar binding properties or affinities as these divalent ions bind to a specific site within the L-type channel. That is, the binding sites for Ca2+ and Ba2+ ions are the same, resulting, for Ca2+ compared with Ba2+, in a little different depth of the energy well that controls the diffusional access and departure of ions to and from the pore. The prediction of the relative permeabilities for Na+, Ba2+ and Ca2+ ions by our model is 1:51:84, which is in good agreement with single channel recordings (Yue & Marban, 1990).
Genesis of voltage- and Ca2+-dependent inactivation
Some studies of L-type channels have adopted complicated modal models that consist of two or more parallel gating pathways, each of which contains several closed states that lead to one final open state. These different pathways can account for the gating of a specific type of channel inactivation by voltage, calcium or other mechanisms (e.g. mode Normal and mode Ca pathways of Jafri et al. 1998; Stern et al. 1999). The process of voltage- and Ca2+-sensitive inactivation was modelled by voltage and/or calcium dependence of intermodal transition rates. Some studies assumed the rate functions governing the transitions between each of the corresponding closed states were identical constants (Richard et al. 1993), whereas others assumed those rates were characterized by identical voltage functions (Jafri et al. 1998). Since the identical forward and backward transition rates between closed states are used in the parallel gating pathways, these models could be collapsed into a single lumped closed state, with an appropriate transition rate. Unlike the model proposed by Shirokov et al. (1993), which specifies one four-state kinetic scheme describing voltage-dependent inactivation and a second four-state kinetic scheme for describing Ca2+-dependent inactivation, our model has a more compact form. Our model, however, agrees with their contention that IBa,L inactivation is not exclusively voltage dependent, but rather Ba2+ dependent as well.
Gating current studies in guinea-pig ventricular myocytes (Shirokov et al. 1993) indicate that Ca2+ does not affect the voltage-dependent component of inactivation. In contrast, our experimental results suggest that Ca2+ does have an inhibitory effect on voltage-dependent inactivation of ionic current in rat ventricular myocytes. This mechanism provides a plausible explanation of the data shown in Fig. 10, where with extracellular Ca2+ there is a distinct U-shaped steady-state inactivation curve, whereas without Ca2+ there is a monotonically decreasing inactivation function, which results in greater inactivation at V > 40 mV in the absence of Ca2+ than in its presence.
Limitations of the model and future studies
All models have limitations and some of the more important encountered in our model are discussed below.
(1) The strong steady-state inactivation of INa,L might alternatively be explained by a block of Na+ currents by intracellular [Mg2+], rather than voltage-dependent inactivation. McHugh & Beech (1996) reported that increasing intracellular Mg2+ induced a leftward shift of the Ca2+ channel current-voltage relationship and consequently a leftward shift of Ca2+ channel activation curve. Therefore, Mg2+ can affect the amplitude of INa,L current in a voltage- and concentration-dependent manner. By blocking the relative amplitude of Na+ current responding to the test pulse in a two-pulse experiment, Mg2+ binding would result in apparent voltage-dependent inactivation of the channel. To address the blockage effect of Na+ currents by [Mg2+]i, our model scheme in Fig. 2 should be modified so that [Mg2+]i combines with state O2 to produce state C5, which would be equivalent to making k25 a function of [Mg2+]i (and indirectly also of voltage) rather than being just a function of voltage.
(2) The results from the present study suggest that voltage-dependent inactivation underlies the slow phase of current decay, whereas fast decay is due to Ca2+-dependent inactivation. Our simulations suggest that Na+ currents carried through L-type Ca2+ channels inactivate only by a voltage-dependent mechanism similar to that described for other voltage-dependent channels. Although our model often fails to adequately fit slow tails seen in data in Figs 6-9, the slow tails may be due to a combination of poor clamp control of large inward currents together with some Na-Ca2+ exchange current. The slow tails associated with the data obtained in 60 mM [Na+]o plus 80 mM [TEA+]o were much less conspicuous; however, we found that TEA+ also appeared to have separate small kinetic effects on inactivation, which we wished to avoid.
(3) In its current form, the model cannot be used to predict single channel behaviour. Incorporation of modal gating into the channel model will require refitting the remaining parameters to compensate for the decreased channel activity during ‘mode 0’ silent activity. Such refitting has not been attempted here due to the paucity of quantitative information regarding modal activity.
Despite these limitations, our model is based solidly on experimental data and it provides the most extensive description available to date for ionic selectivity and activation and inactivation mechanisms underlying the L-type Ca2+-channel current in a rat ventricular cell. This model, with its strong ability to reflect L-type current behaviour, can be adopted to characterize the ICa,L subsystem in other types of cardiac cells in rat. Moreover it may be easily modified to include substates to account for channel bursts, modal behaviour, and drug-bound states in future studies.
APPENDIX A
Derivation of the Goldman-Hodgkin-Katz equations
A simple approach to account for L-type channel permeation properties is the Goldman-Hodgkin-Katz (GHK) formalism. The classical derivation for GHK equations can be found from many sources.
The conventional GHK formulation of ionic current (for any ion Y) is:
 |
(A1) |
where the permeability PY =DYβi/l, DY and DY(x) represent single-ion diffusion coefficients, l is membrane thickness, and βo and βi are the partition coefficients.
In our model, the partition coefficients are defined as (Pitzer & Mayorga, 1973; Lee & Tsien, 1984):
| (A2) |
| (A3) |
DY is constant in Na+, Ca2+ and Ba2+ cases.
Particularly, in the Cs+ ion case, DYis not constant but is a function:
| (A4) |
In summary, the GHK expressions in our model are the following:
| (A5) |
| (A6) |
| (A7) |
| (A8) |
APPENDIX B
Tables 3-6 present a complete set of equations, parameter values, and initial conditions used in the model. Unless otherwise specified, model parameters are given in standard units: potential in millivolts, concentration in millimolar, current in picoamperes, capacitance in nanofarads, volume in nanoliters, and temperature in degrees kelvin.
Table 6.
Initial conditions
| State variable | Definition | Initial value |
|---|---|---|
| PC1 | Probability of resting state of L-type channel | 0.9972 |
| Po2 | Probability of first open state of L-type channel | 2.439 × 10⁻³ |
| Po3 | Probability of second open state of L-type channel | 4.6687 × 10⁻⁴ |
| PC4 | Probability of C2+-dependent inactivated state | 4.1726 × 10⁻² |
| PC5 | Probability of voltage-dependent inactivated state | 4.0178 × 10⁻² |
| [Ca2+]i | Ca2+ concentration in intracellular medium | 6.0189 × 10⁻⁵ mM |
| [Ca2+]cleft | Ca2+ concentration in cleft subspace adjacent to L-type channel | 6.0189 × 10⁻⁵ mM |
| [CaCM] | Ca2+-calmodulin concentration | 5.0 × 10⁻⁵ mM |
| OTC | Fractional occupancy of troponin-Ca2+ complex by Ca2+ | 0.01186 |
| [Na+]i | Na+ concentration in intracellular medium [Na+]i =−5.8452 + 16.358e[B2+]o/3.0977 mM, where B2+ stands for Ca2+ or Ba2+ |
References
- Bers DM. Excitation-Contraction Coupling and Cardiac Contractile Force. Dordrecht, The Netherlands: Kluwer Academic Publishers; 1991. [Google Scholar]
- Boyett MR, Honjo H, Harrison SM, Zang W-J, Kirby MS. Ultra-slow voltage-dependent inactivation of the calcium current in guinea-pig and ferret ventricular myocytes. Pflügers Archiv. 1994;428:39–50. doi: 10.1007/BF00374750. [DOI] [PubMed] [Google Scholar]
- Cachelin AB, De Peyer JE, Kokubun S, Reuter H. Ca2+ channel modulation by 8-bromocyclic AMP in cultured heart cells. Nature. 1983;304:462–464. doi: 10.1038/304462a0. [DOI] [PubMed] [Google Scholar]
- Difrancesco D, Noble D. A model of cardiac electrical activity incorporating ionic pumps and concentration changes. Philosophical Transactions of the Royal Society. 1985;307:353–398. doi: 10.1098/rstb.1985.0001. [DOI] [PubMed] [Google Scholar]
- Fan J-S, Palade P. Perforated patch recording with β-escin. Pflügers Archiv. 1998;436:1021–1023. doi: 10.1007/pl00008086. [DOI] [PubMed] [Google Scholar]
- Fan J-S, Palade P. One calcium ion may suffice to open the tetrameric cardiac ryanodine receptor in rat ventricular myocytes. The Journal of Physiology. 1999;516:769–780. doi: 10.1111/j.1469-7793.1999.0769u.x. [DOI] [PMC free article] [PubMed] [Google Scholar]
- Fenwick EM, Marty A, Neher EJ. Sodium and calcium channels in bovine chromaffin cells. The Journal of Physiology. 1982;331:599–635. doi: 10.1113/jphysiol.1982.sp014394. [DOI] [PMC free article] [PubMed] [Google Scholar]
- Ferreira G, Yi J, Rios E, Shirokov R. Ion-dependent inactivation of barium current through L-type calcium channels. Journal of General Physiology. 1997;109:449–461. doi: 10.1085/jgp.109.4.449. [DOI] [PMC free article] [PubMed] [Google Scholar]
- Frankenhaeuser B. Sodium permeability in toad nerve and in squid nerve. The Journal of Physiology. 1960;169:424–430. doi: 10.1113/jphysiol.1960.sp006477. [DOI] [PMC free article] [PubMed] [Google Scholar]
- Hadley RW, Hume JR. An intrinsic potential-dependent inactivation mechanism associated with calcium channels in guinea-pig myocytes. The Journal of Physiology. 1987;389:205–222. doi: 10.1113/jphysiol.1987.sp016654. [DOI] [PMC free article] [PubMed] [Google Scholar]
- Hess P. Cardiac calcium channels. In: Zipes D, Jalife J, editors. Cardiac Electrophysiology: From Cell to Bedside. Philadelphia: W. B. Saunders; 1990. pp. 10–17. [Google Scholar]
- Hess P, Lansman JB, Tsien RW. Different modes of Ca channel gating favored by dihydropyridine Ca agonists and antagonists. Nature. 1984;311:538–544. doi: 10.1038/311538a0. [DOI] [PubMed] [Google Scholar]
- Hess P, Lansman JB, Tsien RW. Calcium channel selectivity for divalent and monovalent cations. Journal of General Physiology. 1986;88:293–319. doi: 10.1085/jgp.88.3.293. [DOI] [PMC free article] [PubMed] [Google Scholar]
- Hess P, Tsien RW. Mechanism of ion permeation through calcium channels. Nature. 1984;309:453–456. doi: 10.1038/309453a0. [DOI] [PubMed] [Google Scholar]
- Hille B. Ionic Channels of Excitable Membranes. 2. Sunderland, MA, USA: Sinauer Associates; 1992. [Google Scholar]
- Imredy JP, Yue DT. Mechanism of Ca2+-sensitive inactivation of L-type Ca2+ channels. Neuron. 1994;12:1301–1318. doi: 10.1016/0896-6273(94)90446-4. [DOI] [PubMed] [Google Scholar]
- Jafri MS, Rice JJ, Winslow RL. Cardiac Ca2+ dynamics: the roles of ryanodine receptor adaptation and sarcoplasmic reticulum load. Biophysical Journal. 1998;74:1149–1168. doi: 10.1016/S0006-3495(98)77832-4. [DOI] [PMC free article] [PubMed] [Google Scholar]
- Johnston D, Wu SM-S. Foundation of Cellular Neurophysiology. Cambridge, MA, USA: MIT Press; 1997. chap. 10. [Google Scholar]
- Kass RS, Krafte DS. Negative surface charge density near heart calcium channels. Journal of General Physiology. 1987;89:629–644. doi: 10.1085/jgp.89.4.629. [DOI] [PMC free article] [PubMed] [Google Scholar]
- Kass RS, Sanguinetti MC. Inactivation of calcium channel current in the calf Purkinje fiber. Evidence for voltage- and calcium-mediated mechanisms. Journal of General Physiology. 1984;84:705–726. doi: 10.1085/jgp.84.5.705. [DOI] [PMC free article] [PubMed] [Google Scholar]
- Kostyuk PG, Mironov SL, Shuba YA M. Two ion-selecting filters in the calcium channel of the somatic membrane of mollusc neurons. Journal of Membrane Biology. 1983;76:83–93. [Google Scholar]
- Krafte DS, Kass RS. Hydrogen ion modulation of Ca channel current in cardiac ventricular cells: evidence for multiple mechanisms. Journal of General Physiology. 1988;91:641–657. doi: 10.1085/jgp.91.5.641. [DOI] [PMC free article] [PubMed] [Google Scholar]
- Kubicek M, Marek M. Computational Methods in Bifurcation Theory and Dissipative Structures. New York: Springer-Verlag; 1983. [Google Scholar]
- Kwan YW, Kass RS. Interactions between H+ and Ca2+ near cardiac L-type calcium channels: evidence for independent channel-associated binding sites. Biophysical Journal. 1993;65:1188–1195. doi: 10.1016/S0006-3495(93)81152-4. [DOI] [PMC free article] [PubMed] [Google Scholar]
- Lansman JB, Hess P, Tsien RW. Blockade of current through single calcium channels by Cd2+, Mg2+, and Ca2+ Journal of General Physiology. 1986;88:321–347. doi: 10.1085/jgp.88.3.321. [DOI] [PMC free article] [PubMed] [Google Scholar]
- Lau HT. A Numerical Library in C for Scientists and Engineers. Boca Raton, FL, USA: CRC Press, Inc.; 1995. [Google Scholar]
- Lee KS, Marban E, Tsien RW. Inactivation of calcium channels in mammalian heart cells: joint dependence on membrane potential and intracellular calcium. The Journal of Physiology. 1985;364:395–411. doi: 10.1113/jphysiol.1985.sp015752. [DOI] [PMC free article] [PubMed] [Google Scholar]
- Lee KS, Tsien RW. High selectivity of calcium channels in single dialysed heart cells of the guinea-pig. The Journal of Physiology. 1984;354:253–272. doi: 10.1113/jphysiol.1984.sp015374. [DOI] [PMC free article] [PubMed] [Google Scholar]
- Lew WYW, Hryshko LV, Bers DM. Dihydropyridine receptors are primarily functional L-type calcium channels in rabbit ventricular myocytes. Circulation Research. 1991;69:1139–1145. doi: 10.1161/01.res.69.4.1139. [DOI] [PubMed] [Google Scholar]
- Luo CH, Rudy Y. A dynamic model of the cardiac ventricular action potential: I. Simulations of ionic currents and concentration changes. Circulation Research. 1994;74:1071–1096. doi: 10.1161/01.res.74.6.1071. [DOI] [PubMed] [Google Scholar]
- McCleskey EW, Palade PT, Almers W. The mechanism of ion selectivity in calcium channels of skeletal muscle. Neurology and Neurobiology. 1986;20:193–204. [Google Scholar]
- McHugh D, Beech DJ. Modulation of Ca2+ channel activity by ATP metabolism and internal Mg2+ in guinea-pig basilar artery smooth muscle cells. The Journal of Physiology. 1996;492:359–376. doi: 10.1113/jphysiol.1996.sp021314. [DOI] [PMC free article] [PubMed] [Google Scholar]
- Marquardt DW. An algorithm for least-squares estimation of nonlinear parameters. Journal of SIAM. 1963;11:431–441. [Google Scholar]
- Pietrobon D, Hess P. Novel mechanism of voltage-dependent gating in L-type calcium channels. Nature. 1990;346:651–655. doi: 10.1038/346651a0. [DOI] [PubMed] [Google Scholar]
- Pitzer KS, Mayorga G. Thermodynamics of electrolytes. II. Activity and osmotic coefficients for strong electrolytes with one or both ions univalent. Journal of Physical Chemistry. 1973;77:2300–2308. [Google Scholar]
- Qin F, Auerbach A, Sachs F. Estimating single-channel kinetic parameters from idealized patch clamp data containing missed events. Biophysical Journal. 1996;70:264–280. doi: 10.1016/S0006-3495(96)79568-1. [DOI] [PMC free article] [PubMed] [Google Scholar]
- Qin N, Olcese R, Bransby M, Lin T, Birnbaumer L. Ca2+-induced inhibition of the cardiac Ca2+ channel depends on calmodulin. Proceedings of the National Academy of Sciences of the USA. 1999;96:2435–2438. doi: 10.1073/pnas.96.5.2435. [DOI] [PMC free article] [PubMed] [Google Scholar]
- Rasmusson RL, Clark JW, Giles WR, Shibata EF, Campbell DL. A mathematical model of a bullfrog cardiac pacemaker cell. American Journal of Physiology. 1990;259:H352–369. doi: 10.1152/ajpheart.1990.259.2.H352. [DOI] [PubMed] [Google Scholar]
- Reuter H, Stevens CF, Tsien RW, Yellen G. Properties of single calcium channels in cardiac cell culture. Nature. 1982;297:501–504. doi: 10.1038/297501a0. [DOI] [PubMed] [Google Scholar]
- Richard S, Charnet P, Nerbonne J. Interconversion between distinct gating pathways of the high threshold calcium channel in rat ventricular myocytes. The Journal of Physiology. 1993;462:197–228. doi: 10.1113/jphysiol.1993.sp019551. [DOI] [PMC free article] [PubMed] [Google Scholar]
- Sanguinetti MC, Krafte DS, Kass RS. Voltage-dependent modulation of Ca channel current in heart cells by Bay K8644. Journal of General Physiology. 1986;88:369–392. doi: 10.1085/jgp.88.3.369. [DOI] [PMC free article] [PubMed] [Google Scholar]
- Shirokov R, Levis R, Shirokova N, Rios E. Ca2+-dependent inactivation of cardiac L-type Ca2+ channels does not affect their voltage sensor. Journal of General Physiology. 1993;102:1005–1030. doi: 10.1085/jgp.102.6.1005. [DOI] [PMC free article] [PubMed] [Google Scholar]
- Smith GD, Keizer JE, Stern MD, Lederer WJ, Cheng H. A simple numerical model of calcium spark formation and detection in cardiac myocytes. Biophysical Journal. 1998;75:15–32. doi: 10.1016/S0006-3495(98)77491-0. [DOI] [PMC free article] [PubMed] [Google Scholar]
- Standen NB, Stanfield PR. A binding-site model for calcium channel inactivation that depends on calcium entry. Proceedings of the Royal Society. 1982;B217:101–110. doi: 10.1098/rspb.1982.0097. [DOI] [PubMed] [Google Scholar]
- Stern MD. Theory of excitation-contraction coupling in cardiac muscle. Biophysical Journal. 1992;63:497–517. doi: 10.1016/S0006-3495(92)81615-6. [DOI] [PMC free article] [PubMed] [Google Scholar]
- Stern MD, Song L, Cheng H, Sham JSK, Yang HT, Boheler KR, Rios E. Local control models of cardiac excitation-contraction coupling: A possible role for allosteric interactions between ryanodine receptors. Journal of General Physiology. 1999;113:469–489. doi: 10.1085/jgp.113.3.469. [DOI] [PMC free article] [PubMed] [Google Scholar]
- Sun XH, Protasi F, Takahashi M, Takeshima H, Ferguson DG, Franzini-Armstrong C. Molecular architecture of membrane involved in excitation-contraction coupling of cardiac muscle. Journal of Cellular Biology. 1995;129:659–671. doi: 10.1083/jcb.129.3.659. [DOI] [PMC free article] [PubMed] [Google Scholar]
- Yue D, Marban E. Permeation in the dihydropyridine-sensitive calcium channel. Journal General Physiology. 1990;95:911–939. doi: 10.1085/jgp.95.5.911. [DOI] [PMC free article] [PubMed] [Google Scholar]
- Zahradnikova A, Palade P. Procaine effects on single sarcoplasmic reticulum Ca2+ release channels. Biophysical Journal. 1993;64:991–1003. doi: 10.1016/S0006-3495(93)81465-6. [DOI] [PMC free article] [PubMed] [Google Scholar]
- Zühlke RD, Pitt GS, Deisseroth K, Tsien RW, Reuter H. Calmodulin supports both inactivation and facilitation of L-type calcium channels. Nature. 1999;399:159–162. doi: 10.1038/20200. [DOI] [PubMed] [Google Scholar]