

Abstract
The mechanisms underlying electro-mechanical alternans caused by faster heart rates were investigated in perfused guinea-pig hearts stained with RH237 and Rhod-2 AM to simultaneously map optical action potentials (APs) and intracellular free Ca2+ (Ca2+i).
Fluorescence images of the heart were focused on two 16 × 16 photodiode arrays to map Ca2+i (emission wavelength (λem) = 585 ± 20 nm) and APs (λem > 715 nm) from 252 sites. Spatial resolution was 0·8 mm × 0·8 mm per diode and temporal resolution 4000 frames s−1.
The mean time-to-peak for APs and [Ca2+]i was spatially homogeneous (8·8 ± 0·5 and 25·6 ± 5·0 ms, respectively; n = 6). The durations of APs (APDs) and Ca2+i transients were shorter at the apex and progressively longer towards the base, indicating a gradient of ventricular relaxation.
Restitution kinetics revealed increasingly longer delays between AP and Ca2+i upstrokes (9·5 ± 0·4 to 11·3 ± 0·4 ms) with increasingly shorter S1-S2 intervals, particularly at the base, despite nearly normal peak [Ca2+]i.
Alternans of APs and Ca2+i transients were induced by a decrease in cycle length (CL), if the shorter CL captured at the pacing site and was shorter than refractory periods (RPs) near the base, creating heterogeneities of conduction velocity.
Rate-induced alternans in normoxic hearts were concordant (long APD with large [Ca2+]i) across the epicardium, with a magnitude (difference between odd-even signals) that varied with the local RP. Alternans were initiated by gradients of RP, producing alternans of conduction that terminated spontaneously without progressing to fibrillation.
In heart muscle, the action potential (AP) elicits an influx of Ca2+ in cardiac cells through L-type voltage-gated Ca2+ channels, which triggers a further release of Ca2+ from intracellular Ca2+ stores called the sarcoplasmic reticulum (SR), resulting in a contraction (Bers, 1991). Ca2+ release from the SR occurs via Ca2+ release channels or ryanodine receptors (RyRs), which are activated by a local elevation of [Ca2+]i, a process called Ca2+-induced Ca2+ release (CICR) (Fabiato & Fabiato, 1979). In CICR, a rise in [Ca2+]i triggers a further rise in [Ca2+]i, indicative of a positive feedback mechanism with a high degree of amplification, which would produce self-sustaining ‘all-or-none’ responses with a tendency towards unstable Ca2+ oscillations (Bers, 1991). Studies in single myocytes reveal that intracellular free Ca2+ (Ca2+i) transients elicited by an AP are composed of subcellular Ca2+ signals, called Ca2+ sparks, which represent openings of Ca2+ release units (a single or a cluster of RyRs), each locally controlled by the Ca2+ current (ICa) of an L-type Ca2+ channel (Niggli, 1999). Ca2+ sparks have helped in explaining a basic paradox of how Ca2+ release can be a graded function of depolarization despite the all-or-none [Ca2+]i elevation predicted by CICR (Niggli, 1999). Ca2+ sparks predict a graded release of Ca2+ in the entire myocyte under tight control by ICa, if [Ca2+]i depends on the recruitment of a greater or fewer number of Ca2+ release units, where each Ca2+ release unit behaves in an all-or-none fashion (Stern, 1992; Santana et al. 1996; Niggli, 1999).
Normally, depolarization triggers Ca2+i transients, but in pathological conditions, abnormalities in Ca2+i handling may activate Ca2+-dependent currents that influence the time course of the AP and trigger a membrane depolarization (Lakatta & Guarnieri, 1993; Laflamme & Becker, 1996; Tweedie et al. 2000).
Abnormalities in Ca2+i handling have been implicated as the underlying mechanism in a number of pathological conditions that promote arrhythmias. Ca2+i overload may play an important role in ischaemia and reperfusion-induced arrhythmias (Pierce & Czubryt, 1995; Cross et al. 1998), in the generation of early and delayed after-depolarization (Patterson et al. 1990) and Torsade de Pointes in the long QT syndrome (Shimizu & Antzelevitch, 1999). Ca2+i overload may also initiate electrical and mechanical alternans, which are predictors of ventricular fibrillation (Verrier & Nearing, 1994). Experimental and theoretical studies have proposed that the propensity to fibrillation is determined by the steepness of the AP restitution kinetics curve (Watanabe et al. 1995; Qu et al. 1999). In turn, the slope of the restitution curves for APs and contractions are modulated by agents that alter Ca2+i handling (Kobayashi et al. 1992; Prabhu, 1998).
In contrast, less is known regarding the spatial and temporal heterogeneities of voltage and [Ca2+]i in the intact heart because of the technical difficulty of simultaneously recording APs and [Ca2+]i from multiple sites with sufficient spatial resolution and speed. Voltage-sensitive dyes and imaging techniques using photodiode arrays (Salama et al. 1987), CCD cameras (Witkowski et al. 1998; Gray et al. 1998) and laser scan techniques (Dillon & Morad, 1981) provide the spatial and kinetic resolution to map potential changes on the heart (see Salama 1988; Salama & Choi, 2000). Optical mapping has shown that action potential durations (APDs) are heterogeneous, being short at the apex and progressively longer towards the base (Salama et al. 1987; Efimov et al. 1994; Laurita et al. 1996). Electrode studies further demonstrate heterogeneities in AP characteristics and pharmacological responses in cells from the endocardium, midwall and epicardium (Antzelevitch et al. 1991), indicating that ionic channels and their associated currents differ in different regions of the ventricular wall.
Thus, in order to address fundamental questions regarding the spatio-temporal relationship of voltage and Ca2+i in the intact heart, one cannot overstate the importance of simultaneous measurements of membrane potential and [Ca2+]i. For these reasons, we have developed a method to simultaneously map membrane potential and [Ca2+]i in the epicardium of perfused hearts by staining cells with a voltage-sensitive dye and loading the cytosol with a Ca2+ indicator. The present study describes the apparatus used to simultaneously map APs and [Ca2+]i and its application to the investigation of the spatio-temporal relationship of APs and Ca2+i, their restitution kinetics and the mechanisms underlying alternans induced by an increase in heart rate. Preliminary reports of these data have appeared in abstract form (Choi & Salama, 1999a,b,c,d).
METHODS
Isolated perfused heart preparation
In accordance with national guidelines, guinea-pigs (female, 350-450 g) were anaesthetized with sodium pentobarbital (35 mg kg−1), the chest opened and heparin (200 U kg−1) injected into the inferior vena cava. Hearts were excised, and the aortas were cannulated to allow retrograde perfusion of the coronary vessels with a modified Tyrode solution containing (mm): 130 NaCl, 25 NaHCO3, 1.20 MgSO4, 4.0 KCl, 20 dextrose, 1.25 CaCl2; at pH 7.4, bubbled with 95 % O2-5 % CO2. The temperature of the perfusate was maintained at 37.0 ± 0.5°C using a water bath and a custom-made feedback temperature controller. The hearts were perfused at constant flow rate (12-16 ml min−1) with a pump; perfusion pressure was set at 70 mmHg by adjusting the flow of perfusate.
The heart was placed in a custom-made chamber to reduce movement artifact, to control the temperature in the surrounding bath and to hold the stimulating and recording electrodes at selected sites on the heart (Salama et al. 1987). The heart was stained with a voltage-sensitive dye (RH237 (Molecular Probes), 10-20 μl of a 1 mg ml−1 solution in dimethyl sulfoxide, DMSO) and was loaded with a Ca2+ indicator, Rhod-2 AM (Molecular Probes; 0.2 mg in 0.2 ml DMSO). The dyes were delivered to the heart in the coronary perfusate following their addition via a port in the bubble trap (∼5 ml), which was located just above the aortic cannula and served as a compliance chamber. Heart rate, ECGs and perfusion pressure were measured during the staining process to monitor possible pharmacological effects of the dyes. At the concentrations used here, neither dye produced lasting changes in rate, ECG recordings or perfusion pressure. Rhod-2 reduced the intrinsic heart rate from 300 to 340 ms cycle length (CL) and caused a slight decrease in perfusion pressure (< 6 mmHg) during staining. These effects were transient and the hearts recovered within 5 min after dye injection (n = 9). As previously reported for perfused rabbit hearts (Del Nido et al. 1998), the developed pressure of guinea-pig hearts declined (∼30 %) during the administration of Rhod-2; the amplitude and kinetics of the developed pressure then recovered fully, within 5 min of dye-free perfusion. Higher concentrations of Rhod-2 AM (0.6-0.8 mg in 0.5 ml DMSO) were avoided because they resulted in a 10-15 % decline in developed pressure.
Optical apparatus
The optical apparatus is shown in Fig. 1A. Light from two 100 W custom-built, tungsten-halogen lamps (not shown) was collimated, passed through 520 ± 20 nm interference filters, and focused on the surface of the heart. Fluorescence emitted from the stained heart was collected with a camera lens (85 mm, f1:1.4, Nikon) and passed through a 45 deg dichroic mirror with a cut-off of 630 nm (Omega Optical, Brattleboro, VT, USA). Fluorescence images of the heart were then focused on two 16 × 16 element photodiode arrays (C675-103; Hamamatsu Corp., Bridgewater, NJ, USA; 10 MΩ feedback resistor). The fluorescence image below 630 nm was focused on the ‘Ca2+ array’ after being passed through a 585 ± 20 nm interference filter and the fluorescence image above 630 nm was refocused on the ‘voltage array’ after being passed through a 715 nm cut-off filter. Each diode had a sensing area of 0.95 mm × 0.95 mm with a pitch of 1.1 mm (the distance from centre to centre of neighbouring diodes). Diodes at each corner of the arrays were unused, such that optical signals were monitored from 252 out of 256 diodes. The image of the anterior region of the heart was focused on the array at ×1.2 magnification and each diode detected light from a 0.8 mm × 0.8 mm area of epicardium.
Figure 1. Optical apparatus and emission spectra of Rhod-2 and RH237.
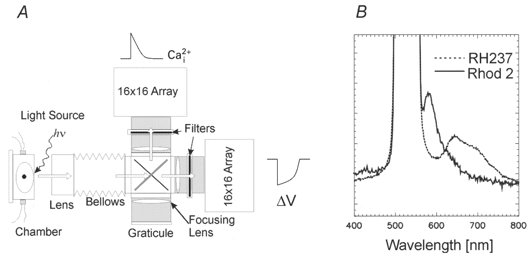
A, schematic diagram of optical apparatus. Light from two 100 W tungsten-halogen lamps was collimated, passed through 520 ± 20 nm interference filters, and focused on the heart. Fluorescence from the stained heart was collected by a camera lens and passed through a dichroic mirror to split the emission wavelength below and above 630 nm. Wavelengths below 645 nm were passed through a 585 ± 20 nm interference filter and those above through a 715 nm cut-off filter, and the two images of the heart were focused on two 16 × 16 photodiode arrays. hv, excitation light. B, emission spectra of Rhod-2 and RH237 from the stained heart. The Rhod-2 emission spectrum has a peak at 585 nm and returns to baseline at 660 nm. The RH237 emission spectrum is broad but the voltage-dependent spectral change during APs (i.e. the action spectrum) was a decrease in fluorescence from 670 to 760 nm, a longer wavelength range than that of most potentiometric dyes. Based on these spectra, filter sets were chosen to eliminate cross-talk between the two dyes without compromising the signal-to-noise ratio of the fluorescence signals.
Alignment of arrays
The precise focus and alignment of the arrays was achieved by focusing the image of the heart on a reticule with the exact dimensions of the array (Graticules Ltd., Tonbridge, UK), placed on a plane parafocal to the planes of the arrays. The arrays were precisely aligned such that a diode on the voltage array was in exact register with a diode on the Ca2+i array, using the following stepwise procedure. (1) A light-emitting diode (LED) that emits at two wavelengths close to the emissions of the two dyes was placed behind a pinhole (0.5 mm diameter). The LED was mounted on a micromanipulator and placed in the object plane (i.e. the plane of the heart’s surface). (2) Pulsed light from the LED was focused first on the Ca2+i array by displacing the LED along the optical axis (z-axis) of the apparatus until a single diode on the Ca2+i array detected a maximum signal. (3) The amount of optical cross-talk in two dimensions was tested and found to be negligible because the diode detecting light from the LED measured 5 V and the other 251 diodes on the same array detected background noise (5 mV). (4) Light from the LED was then focused on a diode located at a matched position on the voltage array by aligning the voltage array on the x-y plane to maximize the signal from that diode. (5) The z-axis position of the voltage array was then adjusted (∼2 mm) to maximize the red LED pulses, a necessary step because the emission wavelength for Rhod-2 (orange) is shorter than that for RH237 (red). This produces a chromatic shift of the Ca2+ image in relation to the voltage image. (6) An image of the pinhole was focused on both arrays at ×1 magnification. The LED was then displaced vertically and horizontally in 1.1 mm steps in the object plane along the x-y axis to verify that each ‘Ca2+i diode’ was in exact register with a ‘voltage diode’ and that columns and rows of diodes were also aligned.
The amplitude of the LED signals was highly uniform with ≤ 2 % variation across all diodes on the two arrays, indicating that the energy transfer function of the collecting lenses did not produce spatial heterogeneities of the light transferred from the object to the image plane.
Data acquisition
Outputs from the photodiode arrays (C4675-103, 10 MΩ feedback resistor) were amplified (1, 50, 200 or 1000 times) (LBC-2; Argo Transdata Corp.), digitized (12 bits, DAP 3400/a; Microstar Laboratories Inc., Bellevue, WA, USA) and stored in the memory of a (266 MHz) Pentium II computer running Windows NT 4.0. The analog-to-digital converter consisted of four flash converters, which sampled four diodes simultaneously, first from the voltage array then four spatially matched diodes on the Ca2+i array. As a result, the sampling delay between voltage and Ca2+i signals from the same site on the heart was 3.9 and 1.9 μs for sampling rates of 2000 and 4000 frames s−1, respectively. The digitization sequence alternated between the two arrays until all 252 diodes plus eight instrumentation channels were sampled. In practice, a sampling rate of 2000 frames s−1 was sufficient because it did not distort the kinetics of the signals. A ‘scan file’ consisted typically of 512 signals sampled at 2 kHz (252 voltage and 252 Ca2+i optical signals plus 8 instrumentation channels) for 8 s. The eight instrumentation channels were used to simultaneously record surface electrograms, stimulation logic and temperature, along with the two optical maps.
In experiments designed to measure the time delay between voltage and Ca2+i upstrokes, maps were measured at 4000 frames s−1 (Figs 2B, 6 and 7) to maximize the accuracy of the data. An important feature of the optical apparatus is its particularly fast kinetic resolution (4000 frames s−1 for both arrays), which is sufficiently fast (sampling each diode every 250 μs) to accurately determine the temporal relationship between voltage and Ca2+i.
Figure 2. Symbolic maps of APs and Ca2+i recorded from the anterior epicardium.
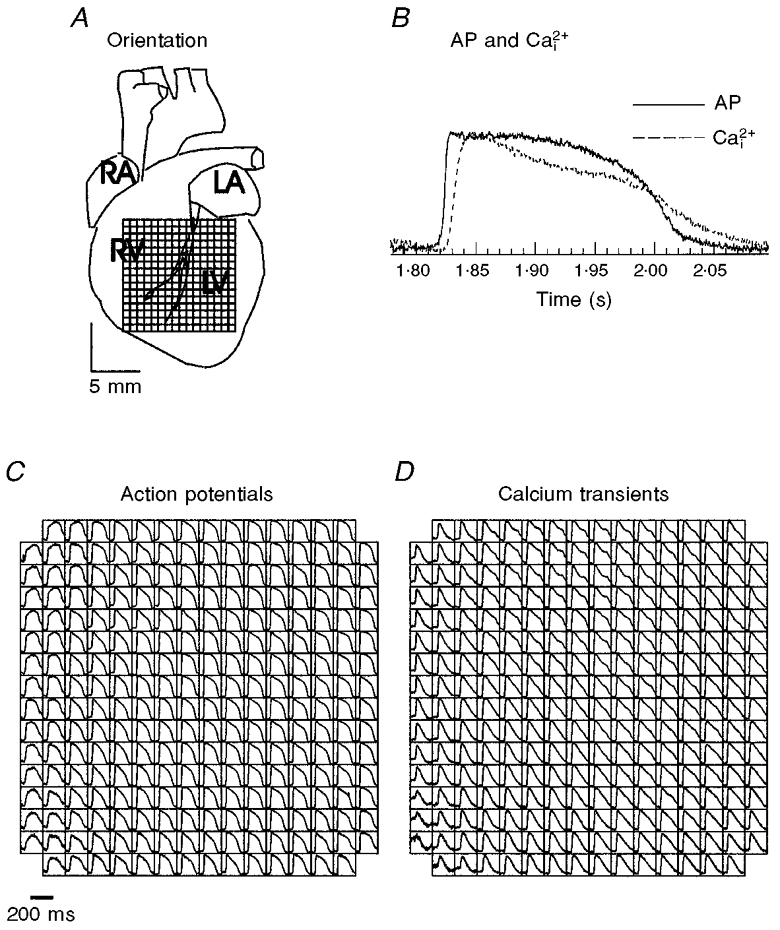
A, diagram showing the anterior surface of the guinea-pig heart and the field-of-view of the array used throughout the study. The top edge of the array is aligned with the base of the heart and the bottom edge with the apex. RA, right atrium; RV, right ventricle; LA, left atrium; LV, left ventricle. B, superposition of AP and Ca2+i traces recorded at 300 ms CL from a voltage and a Ca2+i diode located at the centre of the two arrays. For each voltage diode, there is an equivalent Ca2+i diode and fewer than 5 % of the sites detected contraction artifacts too large to permit a quantitative analysis of APDs and [Ca2+]i,75. C and D, symbolic maps of two photodiode arrays. Each square box represents a diode on the array and with APs and Ca2+i transients drawn in their respective location on the voltage and Ca2+i arrays. These APs and Ca2+i transients were measured simultaneously from 252 sites and are shown as they appear on the computer monitor.
Figure 6. Response characteristics of APs and Ca2+i transients during a premature impulse.
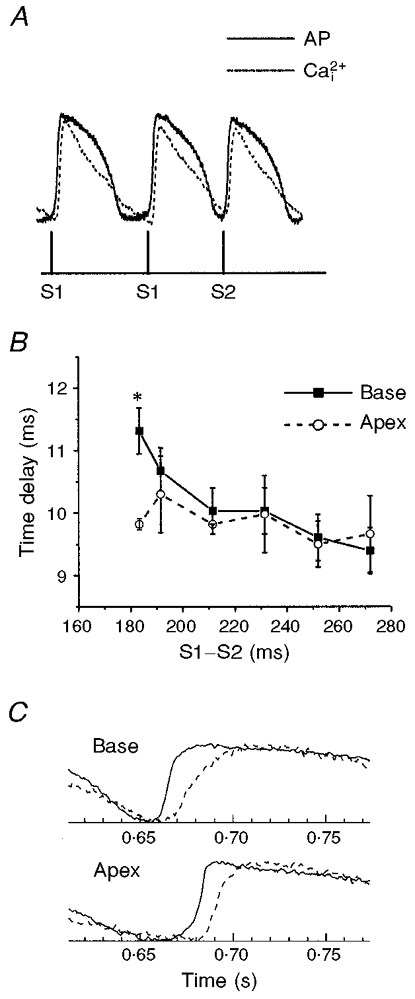
A, simultaneous recordings of APs and Ca2+i transients from two diodes in register to measure voltage and Ca2+i from the same site on the heart. The heart was paced for 20 beats at a basic CL, with S1-S1 = 300 ms, followed by a single premature impulse at variable S1-S2 intervals. B, time delay between APs and Ca2+i as a function of the S1-S2 interval. The spatio-temporal delays between the AP upstroke and the rise in Ca2+i were analysed by plotting the delay between (dF/dt)max of the voltage and Ca2+i traces as a function of the S1-S2 interval for 6 sites at the apex and 6 sites at the base. There were no significant differences in AP to Ca2+i delays at different sites on the heart, except for the shortest S1-S2 intervals that could capture an AP that spread on the heart. However, at the shortest S1-S2 intervals (182 ms), delays between APs and Ca2+i were significantly longer at the base than at the apex (P < 0.01), perhaps because the premature pulse impinges more on the refractory period of the tissue at the base than at the apex. Each data point represents the mean delay from 6 sites (or diodes) ±s.d.; the plot was reproduced in 4 separate hearts. ANOVA analysis and Student’s t test with Bonferroni’s correction yielded statistically significant values (*P < 0.01). C, comparison of AP and Ca2+i at the base and apex at the shortest S1-S2 interval. AP upstroke (continuous lines) and Ca2+i rise (dashed lines) are shown for a site at the base (top traces) and at the apex (bottom traces) elicited by the shortest S1-S2 interval in the plot shown in B. Note the marked slowing down of the rise in Ca2+i at the base compared with the apex.
Figure 7. Restitution kinetics of APs and Ca2+i at the base and apex of the heart.
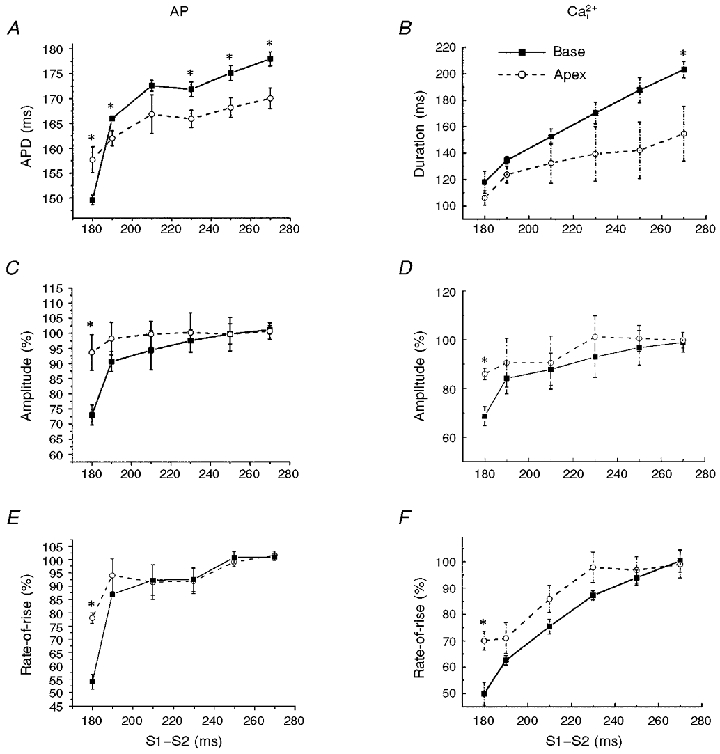
A and B, duration of APs (A) and Ca2+i transients (B) plotted as a function of the S1-S2 interval for sites at the base and the apex of the heart. The durations of the voltage and Ca2+i traces decreased with decreasing S1-S2 intervals and were longer at the base than at the apex, except for the shortest S1-S2 interval, because of the longer refractory period at the base than the apex. C-F, similarly, the amplitudes and rates-of-rise of APs (C and E) and Ca2+i transients (D and F) decreased with decreasing S1-S2 intervals but the effects were more pronounced at the base than at the apex. Each point represents the mean value derived from 6 diodes at the base and 6 diodes at the apex; error bars represent s.d. ANOVA analysis and Student’s t test with Bonferroni’s correction yielded statistically significant values; *P < 0.01.
Spectral analysis
A linear array spectrophotometer was used to record spectra from 330 to 900 nm (40 ms per spectrum and integration time) from guinea-pig hearts stained with RH237 and/or Rhod-2 to select the best combination of filters. Figure 1B shows Rhod-2 and RH237 fluorescence spectra from the surface of the heart measured at an excitation wavelength of 520 nm. The filter combination was selected from the emission spectra to eliminate optical cross-talk (< 2 %) and to maximize the AP and Ca2+i signals.
Calibration of Rhod-2
[Ca2+]i was calibrated from hearts loaded with Rhod-2 AM, using the equation:
where Kd is 710 nM, Fmin is the Rhod-2 fluorescence for the free dye in zero Ca2+ and Fmax is the Rhod-2 fluorescence for the dye-Ca2+ complex in saturated Ca2+ conditions, as previously described (Del Nido et al. 1998). Fmax was measured after perfusion of the heart with the Ca2+ ionophore A23187 (10 μm) plus 2,2′-dithiodipyridine (100 μm), diacetyl monoxime (DAM; 15 mm) and 3 mm free Ca2+. A23187 facilitates Ca2+ entry in heart cells and 2,2′-dithiodipyridine elicits SR Ca2+ release by activating RyRs (Prabhu & Salama, 1990). The combination of these two agents produced a particularly rapid saturation of intracellular Rhod-2 with Ca2+ (2-5 min) before significant changes in intrinsic tissue absorption and fluorescence occurred. The elevation in [Ca2+]i during the calibration caused a massive contraction of the heart, and tissue shrinkage, which was prevented by adding DAM. Fmin was approximately equal to the background fluorescence of the heart before being loaded with Rhod-2. This approximation is valid because Rhod-2 has a very low fluorescence quantum yield and the formation of the Rhod-2-Ca2+ complex results in a > 100-fold increase in fluorescence quantum yield. We have shown previously that Rhod-2 is primarily trapped in the cytosol of guinea-pig myocytes and is rather stable once loaded in the heart (∼10 % loss of dye in 30 min), without the use of probenicid to inhibit cellular exocytosis (Del Nido et al. 1998). After the heart was loaded with Rhod-2, Ca2+i transients could be recorded for more than 2 h with excellent signal-to-noise ratio and stable kinetics.
Rhod-2 fluorescence was measured in DC mode to track the loss of dye through decreases in Rhod-2 fluorescence (∼10 % in 30 min, n = 4). In one experimental group, hearts (n = 4) were loaded with Rhod-2 to calibrate Ca2+i transients, after a fixed 30 min equilibration period (see Fig. 4). However, in most experiments, [Ca2+]i calibrations were made at the end of experiments lasting 1-2 h, such that a calibration of [Ca2+]i at any time point required calculation of a corrected Fmax to take into account dye washout. Diastolic and peak [Ca2+]i (i.e. baseline and peak fluorescence minus background fluorescence measured from the same heart without Rhod-2) were found to decrease linearly with time and both had the same slope, consistent with dye washout from the heart. To correct for loss of dye, diastolic and peak [Ca2+]i at time t were compared with those measured just before the calibration and their ratio was used to determine a coefficient to obtain a larger, corrected value for Fmax at time t.
Figure 4. Calibration of [Ca2+]i.
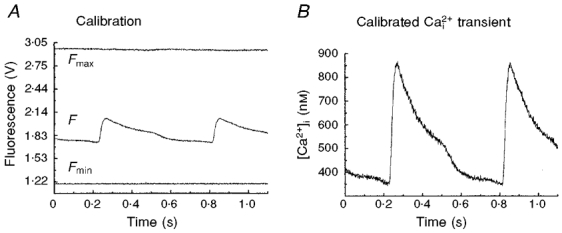
A, minimum (Fmin) and maximum (Fmax) fluorescence levels from Rhod-2 trapped in the heart were measured as described in Methods and plotted on a relative intensity scale with a Ca2+i transient (F). B, as described in Methods, a Ca2+i transient was calibrated in terms of free cytosolic Ca2+, based on Fmin, Fmax and Kd.
Stimulation protocols
Electrical stimuli (2 ms duration and 1.5 times threshold voltage) were delivered with bipolar platinum wire electrodes positioned on the left or right ventricular free wall. A multifunction board (Lab-PC-1200, National Instruments), operating as a background task during data acquisition, generated the pulse logic to drive stimulus isolators (A360; World Precision Inc.). For restitution kinetics, 10 beats (S1) were applied at a basic CL (S1-S1 = 300 ms) followed by a single premature beat S2. The S1-S2 interval was reduced from 300 to 200 ms in 5 ms steps and then from 200 ms to the refractory period (RP) in 1 ms steps. Alternans can be elicited by an increase in heart rate and the conditions which initiate alternans were tested by pacing the heart for a minimum of 15 beats at a basic 300 ms CL then changing to a shorter CL for 10 or 20 beats. The shorter CL was systematically reduced in 10 ms steps from 300 ms and then in 2 ms steps until the CL fell within 20 ms of the RP at the pacing site.
Data analysis
The activation time point at each site was determined from the maximum derivative of the local AP upstroke (dF/dt)max (Salama et al. 1987, 1994). The APD at each site was the interval from the local activation to the inflection point of the AP downstroke, (d2F/dt2)max. This inflection point was shown to occur at ∼97 % repolarization to baseline and to be coincident with the RP (Efimov et al. 1994; Kanai & Salama, 1995). The duration of Ca2+i transients was determined from the maximum first derivative of the Ca2+i upstroke to the time point of 75 % recovery of [Ca2+]i to its original baseline ([Ca2+]i,75). The kinetics of AP and Ca2+i upstrokes were quantified in two ways: the time-to-peak from minimum to maximum and the rise time from 10 to 90 % of the upstroke. Isochronal maps of activation and repolarization and the local conduction velocity maps were generated from local activation and repolarization time points of optical APs, as previously described (Salama et al. 1994). Diodes corresponding to the edges of the heart and/or those detecting pronounced movement artifacts were excluded from the analysis. Isochronal maps were generated from triangulation of adjacent diodes using Delaunay triangulation.
Two-way analysis of variance was used to test the spatial (between apex and base) and temporal (between S1-S2 intervals) differences in AP and Ca2+i kinetics. Results were considered significant when P < 0.01. Each comparison between apex and base at a specific S1-S2 interval was adjusted using a Bonferroni correction. Values are given as means ±s.d. (n, number of hearts).
Magnitude of alternans
The magnitudes of voltage and Ca2+i alternans were quantitatively determined at each site to analyse the degree of alternations and the spatial distribution of alternans. Alternans induced by an abrupt increase in heart rate exhibited alternations in APDs and [Ca2+]i,75, in the amplitudes of APs and Ca2+i and in the rates-of-rise of APs and Ca2+i upstrokes. The most reliable computer-automated measurement of the degree of alternation was obtained from an analysis of differences in the rate-of-rise between odd and even beats. Measurements of amplitudes and durations were prone to errors in the onset and return to baseline of each beat because odd/even beats impinged on each other. Therefore, the rates-of-rise of AP and Ca2+i upstrokes during alternans were first normalized with respect to the rate-of-rise of their control beat and differences in the normalized rates-of-rise between odd and even beats were defined as the ‘magnitude of alternans’. The magnitudes of AP and Ca2+i alternans (ΔAP and ΔCa2+i, respectively) have a range of 0-100 % of the control rate-of-rise.
RESULTS
Simultaneous measurements of APs and Ca2+i transients
Several technical problems had to be overcome before APs and Ca2+i could be mapped simultaneously at high spatial and temporal resolution. (1) Compatible dyes had to be found to avoid optical cross-talk between voltage and Ca2+i. (2) The dyes had to preferably fluoresce at different wavelengths yet be excited at the same wavelength, such that two fluorescence images of the heart could be simultaneously recorded at two wavelengths without switching excitation or emission wavelengths. (3) The two arrays had to be aligned such that voltage and Ca2+i diodes were in perfect register. (4) High-speed software had to be developed to visualize APs and Ca2+i transients during an experiment, to guide each step of the experimental protocol.
Figure 2A shows a diagram of the anterior surface of the heart and illustrates the aspect of the heart viewed by the arrays throughout this study. Hearts were stained with RH237 and Rhod-2 AM to map APs and Ca2+i simultaneously. Figure 2 shows symbolic maps of the voltage (C) and Ca2+i (D) arrays, with the AP and Ca2+i signals drawn in their respective locations, for a heart paced at 300 ms cycle length. Figure 2B illustrates the superposition of an AP and a Ca2+i transient detected by a set of diodes (at the centre of the field-of-view) on the two arrays. As required to validate the system, the AP upstroke always preceded the rise in Ca2+i and the rise time of the AP was shorter than that for Ca2+i, for all diodes.
Pivotal tests were done to verify that the AP and Ca2+i signals were independent of each other and selectively measured the correct parameter. One test involved staining the hearts with either RH237 or Rhod-2 and recording the signals with both arrays. Figure 3A and B shows APs and Ca2+i when hearts were stained with one dye and not the other. Hearts stained with the voltage-sensitive dye RH237 exhibited null Ca2+i signals in the Ca2+i array. Similarly, hearts stained with Rhod-2 exhibited null signals in the voltage array. The traces all have the same amplification and show that the cross-talk between the two dyes was insignificant (≤ 1.7 %, n = 3). In another test, the heart was treated with an agent that altered [Ca2+]i but had little effect on the AP. In the presence of 10 μm ryanodine in the perfusate, Ca2+i transients were markedly reduced to 27 ± 3 % (n = 3) of control [Ca2+]i (Fig. 3, compare C and D). As expected, AP signals with RH237 were essentially unchanged, except for a prolongation of the APD (174.5 ± 7.3 to 248.3 ± 1.7 ms) caused by the decrease in [Ca2+]i due to ryanodine.
Figure 3. Lack of cross-talk between optical measurements of APs and Ca2+i.
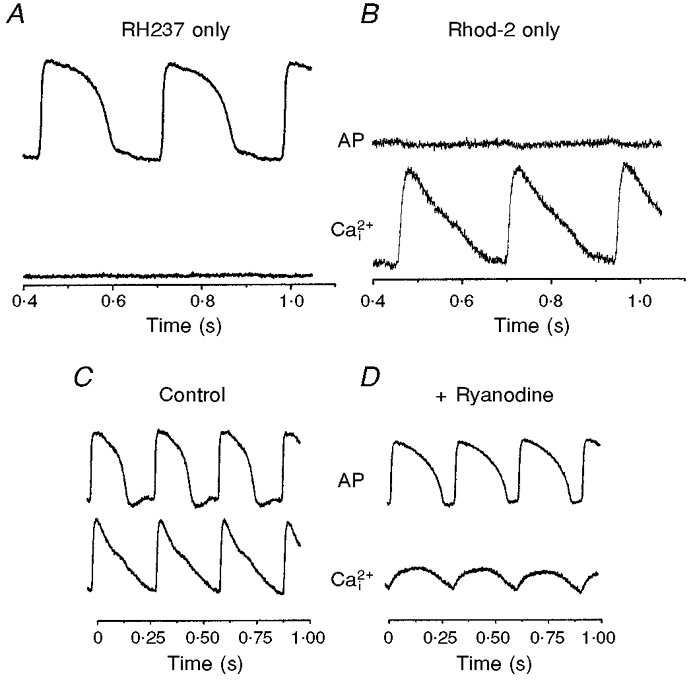
A, signals recorded from 2 diodes in register to detect APs and Ca2+i when the heart was stained with RH237 but not Rhod-2. B, as for A but for a heart stained with Rhod-2, not RH237. Note the lack of cross-talk between the voltage and Ca2+i diode. C and D, effects of ryanodine on AP and Ca2+i recordings. To verify that the Rhod-2 signal is a measure of [Ca2+] released from RyRs, ryanodine (10 μm) was added to the perfusate to test the selectivity of its actions on Ca2+ivs. the AP. C, control recordings of APs and Ca2+i transients from diodes in exact register. D, recordings from the same two diodes after perfusion with ryanodine. Note that, after ryanodine treatment, Ca2+i transients became rounded in shape, lost the rapid rise in [Ca2+]i immediately after the AP upstroke and that peak [Ca2+]i was markedly reduced to 27 ± 3 % (n = 3) of the original signal in 10 min. In contrast, APs were essentially unchanged, except for a prolongation of APD caused by the decrease in [Ca2+]i.
Kinetic analysis of APs and Ca2+i
The spatio-temporal characteristics of APs and Ca2+i were analysed from optical maps taken from the anterior surface of the hearts (as in Fig. 2A). Here, data were sampled at 4000 frames s−1 to maximize the temporal resolution (0.25 ms) and raw traces of APs and Ca2+i were superimposed (as in Fig. 2B) to measure the rise times and time delays between the two signals (n = 6). The time-to-peak was taken as the time between minimum and maximum values of the fluorescence signals and the rise time as the time between 10 and 90 % of the fluorescence upstrokes. For hearts in sinus rhythm, the mean (spatial average) time delay between APs and Ca2+i was 9.4 ± 1.1 ms. The mean rise time of optical APs averaged over the anterior surface was 8.2 ± 0.7 ms at 300 ms CL. The rise time for Ca2+i was 13.9 ± 1 ms (10-90 % of upstroke) and the time-to-peak was 25.6 ± 5.0 ms (minimum to maximum Ca2+i fluorescence). When the heart rate was in the range 200-300 ms CL, whether in sinus rhythm or paced on the ventricle, the kinetics of AP and Ca2+i rise times were similar within experimental error and homogeneous across the anterior surface of the heart (n = 6 hearts).
Calibration of Ca2+i transients
Several approaches were investigated to obtain accurate estimates of Fmin and Fmax for the calibration of Rhod-2 signals. For the measurement of Fmax, the detergent digitonin was added to permeabilize the cell membranes. This produced a rapid influx of Ca2+, which saturated the intracellular Rhod-2. However, the detergent alone caused rapid changes in intrinsic tissue absorption, primarily due to loss of myoglobin from myocytes. Another approach involved using the Ca2+ ionophore A23187 to promote Ca2+ entry in ventricular cells. However, A23187 produced a slow rise in [Ca2+]i and required ∼30 min to equilibrate, during which time considerable metabolic changes could occur. The most effective approach involved a combination of A23187 and the sulfhydryl-oxidizing agent, dithiodipyridine, which triggers Ca2+ release from the SR by activating RyRs (Prabhu & Salama, 1990). The combination of Ca2+ entry from the external medium brought about by A23187 and the emptying of the SR of its stored Ca2+ provided a rapid rise in Rhod-2 fluorescence in 2-5 min before significant metabolic changes occurred. Fmin was measured following perfusion of the hearts with Ca2+-free Tyrode solution containing 2 mm EGTA. The values obtained were compared with Fmin measured before the heart was stained with Rhod-2. Because Rhod-2 exhibits little fluorescence until bound to Ca2+, Fmin can be approximated to the light signal measured before the heart was loaded with Rhod-2. Figure 4 illustrates the ranges of signals recorded for Fmin and Fmax (A) relative to a Ca2+i signal and a calibrated Ca2+i transient (B). Calibrations of [Ca2+]i made 30 min after the heart was loaded with Rhod-2 gave values of diastolic and systolic [Ca2+]i of 301 ± 66 and 936 ± 182 nM (n = 4 hearts), respectively.
Activation and recovery maps of APs and Ca2+i
Activation, recovery and duration maps of Ca2+i and APs were generated as described in Methods and are illustrated in Fig. 5. In sinus rhythm, the anterior surface of the heart was rapidly activated in 3 ms (A) and the rise in Ca2+i transients followed a nearly identical pattern (A′). When hearts were paced (CL = 300 ms) on the left epicardium (right edge), AP propagation and Ca2+i transients spread from right to left in 14 ms (Fig. 5B and B′). In sinus rhythm and in paced hearts, waves of Ca2+i closely followed the spread of depolarization (Fig. 5A′ and B′) but after a time delay, as described above. Repolarization of APs began at the apex and spread towards the base (Fig. 5C), as previously reported (Salama et al. 1987; Kanai & Salama, 1995). The gradient of repolarization was due to the spatial heterogeneity of APDs, which were consistently short at the apex and progressively longer towards the base of the heart (Fig. 5D). The recovery and duration of Ca2+i were measured at 75 % recovery to baseline and had similar general features as AP repolarization and duration maps (Fig. 5C′ and D′). The apex of the left ventricle had consistently shorter Ca2+i transients than the base of the right ventricle (D′) (n = 6), indicating that relaxation spreads diagonally from the apex of the left ventricle to the base of the right ventricle.
Figure 5. Simultaneous maps of activation, repolarization and duration for APs and Ca2+i transients.
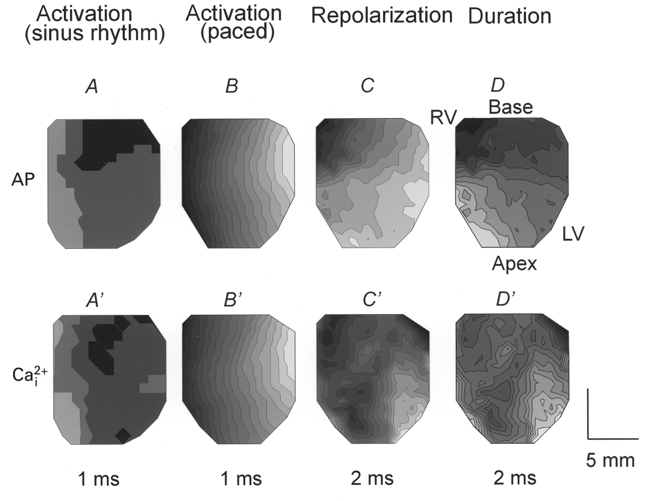
Isochronal maps depicting the direction and rate of propagation of voltage and Ca2+i, as described in Methods. Each map is from the anterior epicardium, as in Fig. 2A and represents analysis of the 252 APs (A-D) and the equivalent Ca2+i transients (A′-D’) recorded simultaneously from the same heart. The light to dark shading shows the progression from earliest activation/repolarization and from short to long duration. A and A’, activation maps for a guinea-pig heart under sinus rhythm. Activation breaks through over a large region of epicardium, originating from the specialized conduction system on the endocardium leading to rapid depolarization within ≈3 ms. Ca2+i elevation follows the same pattern and time course. B and B’, activation maps drawn for the same heart when stimulated at 300 ms from the left ventricle (right of the field of view). APs propagate from the stimulus site in ≈16 ms according to the orientation of epicardial fibre. Ca2+i activation follows AP activation with a time delay of 10 ms in this heart. C and C’, maps of AP repolarization and of Ca2+i recovery ([Ca2+]i,75). Repolarization begins at the apex on the left ventricle 163 ms after the first activation and spreads towards the base or outflow track on the right ventricle. Ca2+i recovery follows a similar pattern with slower recovery times. Similar maps to those shown in C and C’ were recorded when the heart was under sinus rhythm or paced on the right or left ventricle, indicating that repolarization is independent of activation and is driven by spatial heterogeneities of K+ channels responsible for the repolarization of the AP. D and D’, maps of APDs and durations of Ca2+i transients ([Ca2+]i,75). APDs are shorter at the apex than at the base and the recovery and duration of Ca2+i were similar to the electrical repolarization pattern and reveal a gradient of relaxation from apex to base. Isochrones are 1 ms apart for A, B, A’ and B’ and 2 ms apart for C, C’, D and D’.
Restitution kinetics of APs and Ca2+i
The restitution kinetics of the cardiac AP have been extensively investigated as a quantitative measure of the recovery of ion channels to a premature stimulus. When heart muscle is paced at a constant basic cycle length (S1-S1) and a premature pulse is applied at a variable (S1-S2) interval, the premature stimulus elicits an AP of shorter duration and reduced force. The APD elicited by the premature pulse depends on the diastolic interval (interval between the upstroke of the premature pulse and the repolarization of the preceding AP). While the restitution kinetics of APDs and conduction velocity have been extensively investigated, considerably less is known regarding the restitution of Ca2+i transients and the temporal delay between voltage and Ca2+i as a function of S1-S2. Figure 6A illustrates a simultaneous recording of APs and Ca2+i during two basic beats and a premature stimulus. The time delay between (dF/dt)max of the AP upstroke and (dCa2+i/dt)max of the Ca2+i transient is plotted in Fig. 6B, and shows that the delay was prolonged with shorter S1-S2 intervals. The effect was statistically significant near the base and indicates that ICa, the trigger for SR Ca2+ release, and/or the slow recovery of RyRs delay the rise in Ca2+i with decreasing S1-S2 intervals. As illustrated in Fig. 6C, the rise in Ca2+i was slower at the base than at the apex, particularly for short S1-S2 intervals.
The restitution kinetics of APs and Ca2+i were analysed with respect to the duration of the signals, their amplitude and rates-of-rise. As shown in Fig. 7A and B, the durations of APs and Ca2+i transients decreased with decreasing S1-S2 intervals. For APDs, the slope of the curves at short S1-S2 intervals was steeper at the base than at the apex of the heart. For [Ca2+]i,75, the slope of the curve at long S1-S2 intervals was steeper at the base than at the apex. The amplitudes (Fig. 7C and D) and rates-of-rise (Fig. 7E and F) of APs and Ca2+i exhibited a steeper rate of decline at the shortest S1-S2 interval at the base than at the apex. These results are consistent with previous reports on the spatial heterogeneity of APs and the longer APDs and refractory periods measured at the base than at the apex of the ventricular walls.
Alternans induced by rapid pacing
The gradients of recovery and the temporal relationship between APs and Ca2+i transients can influence the adaptation of APs and Ca2+i to a change in heart rate. The mechanisms underlying the initiation of electro-mechanical alternans induced by shortening cycle length were investigated for the first time by mapping voltage and Ca2+i transients simultaneously. The heart rate was increased by first pacing at a long basic cycle length (S1-S1 = 300 ms) for at least 15 beats, then at short cycle lengths (S1′-S1′≥ local refractory period) for at least 10 beats, followed by a return to the basic cycle length (S1-S1 = 300 ms). Figure 8A illustrates APs and matching Ca2+i signals recorded from a set of diodes near the base of the heart, during a change in CL. Changes in heart rate consistently produced electro-mechanical alternans (Fig. 8A) which, in normoxic hearts, at physiological temperature (37°C), lasted ∼20 beats and self-terminated without progressing to a ventricular tachycardia or fibrillation. Alternans elicited by rapid pacing were concordant, that is the larger amplitude Ca2+i transients were associated with APs of higher amplitude and longer durations (Fig. 8A). Figure 8B and C shows the first three beats of APs and Ca2+i shown in Fig. 8A on an expanded time scale. The AP amplitude of the first beat (noted as 1, in B) decreased to 64 ± 6 % (n = 3) of the control amplitude then alternated with large and small amplitudes and durations, every even and odd AP for 10 beats. Figure 8C shows that when the rate was increased, Ca2+i transients oscillated in phase with AP alternations and that systolic and diastolic Ca2+i levels both alternate with a low diastolic [Ca2+]i followed by a larger and faster rise in [Ca2+]i and vice versa, every other beat.
Figure 8. Optical APs and Ca2+i transients during a change in rate (long to short CL).
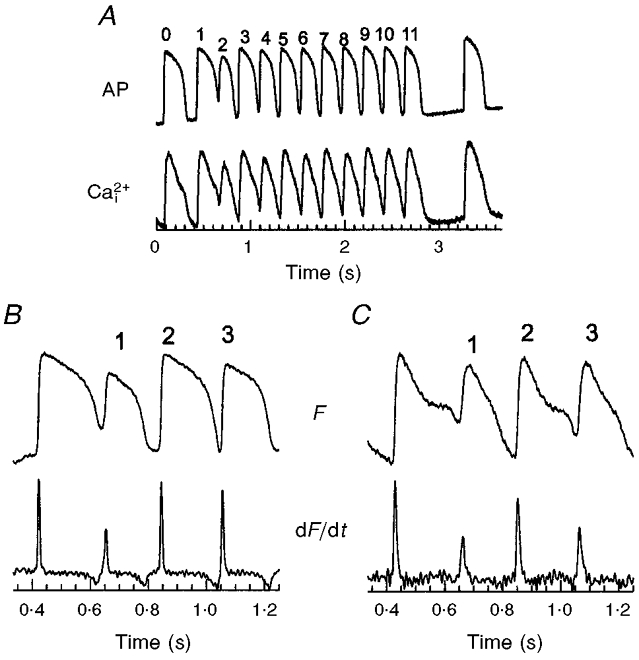
A, traces illustrating the changes in APs and Ca2+i transients that occur during a rate change, by pacing the epicardium at long CL (300 ms) for 20 beats (last 2 beats shown) followed by 10 beats at short CLs (167 ms). Note that the resting potential (top trace) and diastolic Ca2+i are elevated at short CLs and both oscillate between even and odd beats when the rate was increased. B and C, APs and Ca2+i transients, respectively, and their first derivatives shown on an expanded time scale. An increase in rate always produced concordant alternans since the larger Ca2+i transient is always associated with the longer AP and the larger first derivative of Ca2+i is always associated with the larger first derivative of the AP upstroke. Such concordant alternans could be elicited repeatedly by shifting from long to short CLs with the same heart (8-10 times) and the same findings were obtained in 6 separate hearts.
Note that a quantitative analysis of the durations of odd-even APs and Ca2+i transients was not practical because at higher rates, signals fused and neither membrane potential nor Ca2+i levels reached their original baseline. However, the plateau, rise time and amplitude of the signals clearly oscillated between odd and even beats. Instead of calculating the durations of signals lacking a well-defined baseline, alternans were analysed quantitatively by measuring (dF/dt)max, the first time derivative of APs (Fig. 8B) and Ca2+i transients (Fig. 8C), and then alternations in the rate-of-rise of APs and Ca2+i transients. AP alternans with longer durations had faster rates-of-rise (Fig. 8B) and were concordant with Ca2+i transients, where the longer Ca2+i transients also had the faster rate-of-rise (Fig. 8C).
Distribution of the magnitudes of APs and Ca2+i
Concordant alternans elicited by a rate change were spatially homogeneous, meaning ‘in phase’ throughout the field-of-view, but the magnitude of alternans was heterogeneous, being greater at the basal than apical regions of the heart. Figure 9 illustrates a quantitative analysis of alternans from sites at the base and apex (average of 5 diodes per data point). We plotted (dF/dt)max of APs and Ca2+i for odd and even beats. This showed that AP and Ca2+i alternans were larger in magnitude at the base (Fig. 9A and B) compared with the apex (Fig. 9C and D) of the heart. The magnitude of alternans was also measured at each site and mapped for APs (Fig. 10A) and Ca2+i (Fig. 10B). The magnitudes of AP (ΔAP) and Ca2+i (ΔCa2+i) alternans were small in the bottom half of the ventricles, then increased systematically towards the base. The magnitude of alternans was spatially heterogeneous with a gradient that paralleled the distribution of APDs and RPs (see Fig. 5C, D, C′ and D′). The magnitudes of voltage and Ca2+i alternans measured at each site were correlated with the local APD measured at the slow basic cycle length. Plots of the magnitude of alternans versus APD show that at short APDs (i.e. near the apex) the magnitude of alternans was small relative to that measured at sites with long APDs (i.e. near the base). The high correlation between the magnitudes of electrical (Fig. 10C) and mechanical (Fig. 10D) alternans with APD indicates a tight link between the magnitude of alternans and the local refractory period.
Figure 9. AP and Ca2+i alternans at the apex and base.
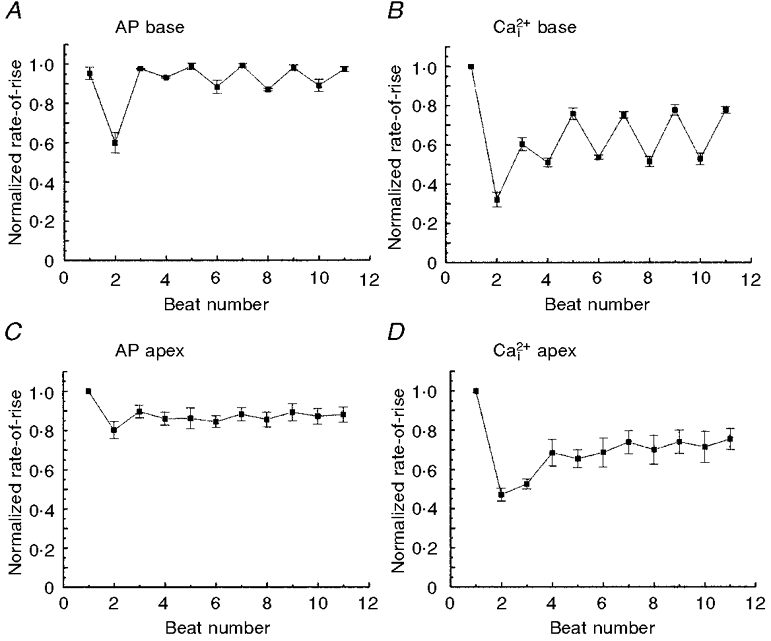
The rates-of-rise of APs and Ca2+i transients were normalized with respect to the control basic beats and then plotted as a function of odd and even beats during concordant alternans elicited by a rate change from 300 to 167 ms CL, as in Fig. 8. Each data point on the plot represents the average rate-of-rise from 8 diodes recording from the base or apex and was plotted against the beat number following the change in rate. Note that the amplitudes of AP and Ca2+i alternans are markedly larger at the base of the heart (A and B) compared with the apex (C and D). Moreover, there was a more rapid damping of alternans at the apex than at the base. In 6 out of 6 hearts, the amplitude of alternans dampened and self-terminated within 20 beats. ANOVA analysis between odd and even beats showed statistically significant differences at the base (P < 0.01) but not at the apex of the heart.
Figure 10. Distribution of the magnitude of alternans and its correlation with APD.
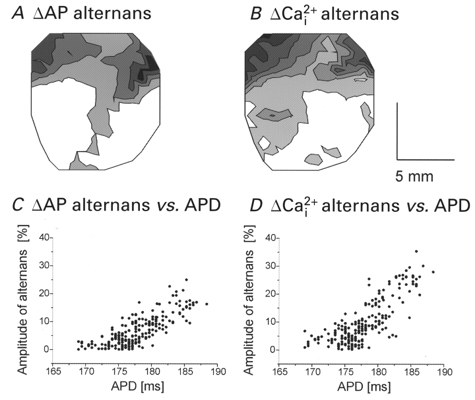
The rates-of-rise of APs and Ca2+i transients during alternans were normalized with respect to the control basic beats (as in Fig. 9). The magnitude of alternans for voltage (ΔAP) and Ca2+i (ΔCa2+i) was calculated for each site (see Methods) and mapped in A and B, respectively. Contour lines of the magnitude of alternans are drawn for every 5 % difference in the normalized rate-of-rise. White to black represents increasingly larger magnitude of alternans. C and D, plots of the magnitude of alternans versus the APD at each site for voltage (C) and Ca2+i (D). The correlation coefficients are 0.79 (P < 0.01) and 0.70 (P < 0.01) for ΔAP and ΔCa2+i, respectively, indicating a high degree of correlation between the magnitude of alternans and the local refractory period of the heart.
The spatial heterogeneity of the magnitude of electro- mechanical alternans was highly reproducible and was correlated with the gradients of APDs and RPs (n = 6 out of 6 hearts).
An alternans was only observed when a long cycle length (S1-S1 = 300 ms) was decreased to a short cycle length (S1′-S1′), if the latter was longer than the RP at the pacing site but shorter than the RP at the base of the heart. Thus, only a narrow range of S1′-S1′, which capture at the pacing site, propagate slowly and encounter a functional arc of conduction block near the base of the heart, could initiate an alternans. Figure 11 illustrates experiments in which the pacing electrode was located on the left (A) or right (B) side of the heart, corresponding to the right and left ventricle, respectively. The control beats recorded at the basic CL (300 ms) are displayed in the top panels (A and B), respectively, as an isochronal map of propagation and as a map of local velocity vectors. The first beat fired at the shorter CL captured and propagated towards the apex where the tissue has a short RP but encountered an arc of block near the base, where the tissue has a longer RP. The propagation of the premature impulses was always slower at the base than at the apex, irrespective of the pacing site, indicating that heterogeneity of RP rather than fibre orientation is responsible for the heterogeneous propagation seen in Fig. 11 (A and B, bottom panels). The first beat of rapid pacing propagated along an arch around the block and failed to elicit a re-entry circuit or spiral wave.
Figure 11. The first rapid beats encounter lines of functional conduction block that initiate alternans.
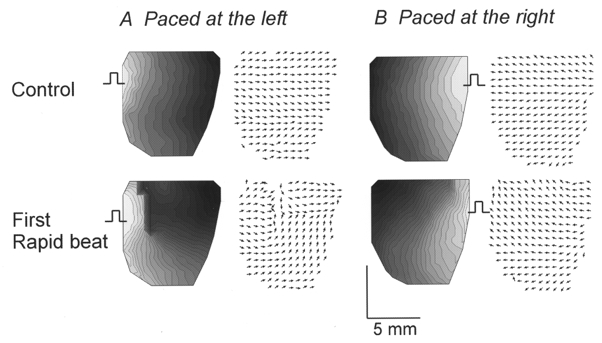
Maps of activation and local velocity vectors are displayed for the last basic beat (top 4 panels; CL = 300 ms) and the first beat at short CL (bottom 4 panels; CL = 167 ms) when the heart was paced from the left (A) or the right (B) side. During ‘control’ beats (top panels), APs propagated from the stimulus site (square pulse) in 15-17 ms. Local velocity vectors are uniformly oriented away from the stimulus site and reveal no rapid changes in direction between adjacent sites. On the other hand, the first rapid stimulus, captured at the site of stimulation, propagated and then encountered a functional line of conduction block (bottom panels). Isochronal lines and local velocity vectors show abrupt changes, respectively, in density and orientation at the line of block. Wave propagation slowed down at the base resulting in curved wavefronts around the arc of conduction block. Isochrones are 1 ms apart and all local velocity vectors were normalized to focus on the changes in orientation rather than absolute values. In 6 out of 6 hearts, the first rapid beat that captured at short CL propagated around an arc of functional conduction block, as illustrated in the bottom panels.
Alternation of conduction velocities
The marked alternations in the rise times of AP upstrokes and Ca2+i transients made us suspect that conduction velocities would also alternate. As shown in Fig. 12, activation displayed as isochronal maps (left panels) and local velocity vectors (right panels) oscillated between even and odd beats during an alternans. For even beats, the activation wavefront spread uniformly from the pacing site on the right towards the left (i.e. left to right ventricle; Fig. 12, top panels). For odd beats, the activation pattern was altered at the base of the heart and conduction in this region slowed down (from 66.9 ± 8.3 to 28.8 ± 8.0 cm s−1). The slower conduction at the base than at the apex was due to the longer APDs and refractory periods at the base (Figs 5D and 12, bottom panels). Thus, AP upstrokes at the base have slower rise times associated with lower peak [Ca2+]i and slower Ca2+i rise times. The marked differences in local velocity at the base and apex in odd beats resulted in alternations of the average conduction velocity between even and odd beats, 63.1 ± 0.1 to 57.1 ± 1.2 cm s−1 (ANOVA, P < 0.01), respectively.
Figure 12. Concordant alternans are linked to alternations of conduction velocity.
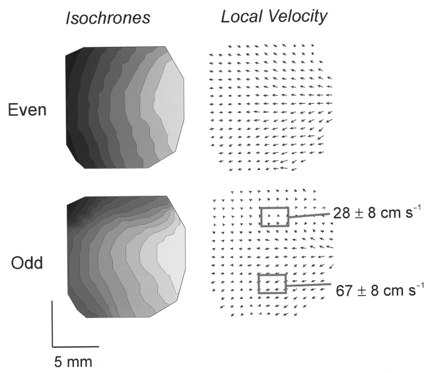
Activation patterns are displayed as isochronal maps and maps of local velocity vectors for odd and even beats of the alternans shown in Figs 8 and 9. Isochronal maps (left) and local velocity vectors (right) compare the propagation of APs for even (top panels) and odd (bottom panels) beats. Activation patterns alternated between even and odd beats because the conduction velocity was consistently and markedly slower at the base (28.8 ± 8.0 cm s−1) than at the apex (66.9 ± 8.3 cm s−1) of the heart. Isochronal lines are 2 ms apart.
DISCUSSION
We developed a technique to measure [Ca2+]i and APs simultaneously from multiple sites on perfused hearts and investigated the spatial and temporal characteristics of APs and Ca2+i transients, and their adaptation to premature stimuli or a change in rate. Hearts were stained with two dyes, a voltage-sensitive dye RH237 and a Ca2+ indicator dye Rhod-2, which were chosen for their spectral properties and accurate reporting of voltage and Ca2+i in heart. Thus, APs and Ca2+i were recorded at high spatial and temporal resolutions, which allows detailed analysis of rise times, rates-of-rise, time delays between APs and Ca2+i, mapping of voltage and Ca2+i waves and the distribution of the magnitude of alternans.
Measurements of cytosolic free Ca2+ with Rhod-2
We have shown previously that Rhod-2 can be used to measure cytosolic free Ca2+ in rabbit hearts using a novel ratiometric technique of fluorescence/reflectance (Del Nido et al. 1998). The Rhod-2 fluorescence measures the concentration of the dye-Ca2+ complex and the reflectance measures the free dye concentration, which fluoresces very weakly. Upon binding to Ca2+, Rhod-2 exhibits a > 100-fold increase in fluorescence quantum efficiency. Numerous experiments have shown that Rhod-2 is primarily trapped in the cytosol of cardiac myocytes rather than subcellular organelles (i.e. mitochondria, the SR network or the nucleus) or endothelial cells. Dye loading in endothelial cells was found to be minimal (< 5 %) because bradykinin had little effect on Rhod-2 fluorescence (Del Nido et al. 1998). Rhod-2 was not significantly loaded in the mitochondria unlike Fura-2, Indo-1 and Fluo-3 (Allen et al. 1992; Chacon et al. 1994; Schreur et al. 1996). Rhod-2 was primarily located in the cytosol (more than 90 %) based on its fluorescence quenching by manganese and confocal images of guinea-pig myocytes loaded with Rhod-2 and selective probes for mitochondria (Del Nido et al. 1998). The rapid rise time of Ca2+i upstrokes measured with Rhod-2 is also consistent with the interpretation that Rhod-2 is an indicator of cytosolic free Ca2+ rather than Ca2+ in various subcellular compartments. Backx et al. (1993) injected low levels of Fura-2 (a high-affinity Ca2+ indicator) iontophoretically into cardiac cells to ensure a cytosolic localization of the dye and measured the fastest rise time for Ca2+i upstrokes. Their values are in excellent agreement with the rise time of Rhod-2 Ca2+i transients (25.6 ± 5.0 ms).
In the present study, we used a single fluorescence wavelength technique to maximize temporal resolution. This approach did not compromise any features of Ca2+i measurements because Rhod-2 is rapidly loaded in the heart and once trapped in the intracellular milieu is more stable than other Ca2+ indicators. Besides its stability in the intact heart, Rhod-2 offers additional advantages such as low Ca2+i buffering and high fidelity of Ca2+i kinetics. Unlike low Kd, high-affinity Ca2+ indicators (Noble & Powell, 1991), the high Kd of Rhod-2 (710 nM in cardiac muscle homogenates) avoids the attenuation of Ca2+i transients and contractions.
Cross-talk between voltage and Ca2+i signals
There was no experimentally significant cross-talk between voltage and Ca2+ signals as shown in hearts stained with one dye but not the other and by testing the pharmacological effects of agents known to alter the AP and Ca2+i transients in different ways. A stringent test was the effect of ryanodine, which, as expected, had no effect on the AP upstroke but produced the near elimination of the rapid rise in Ca2+i (Fig. 3C and D). One can conclude that Rhod-2 transients reported changes in cytosolic free Ca2+ as accurately as possible with current dye techniques.
Characteristics of APs and Ca2+i in perfused guinea-pig heart
The time delay between APs and Ca2+i was ∼10 ms and 90 % of the peak value of Ca2+i was reached in 17 ms and peak [Ca2+]i in < 30 ms. These Ca2+i kinetics are reasonable when compared with values obtained from voltage-clamp experiments on guinea-pig myocytes where Ca2+i reached its peak value in 19 ms (Han et al. 1994). Ca2+i transients measured with a diode are slower than those measured in single cells because they represent the sum of cells viewed in a 0.8 mm × 0.8 mm region of tissue and include propagation delays across the region monitored by the diode. In general, Ca2+ indicators primarily detect Ca2+ released from the SR that is triggered by ICa via CICR, but do not detect the trigger Ca2+ influx entering the gap between T-tubules and the terminal cisternae of the SR. The latter is consistent with the marked reduction of Ca2+i transients measured after treatment of the heart with ryanodine to deplete SR Ca2+ stores (Fig. 3D). In intact hearts, [Ca2+]i reached its maximum in < 30 ms, indicating that SR Ca2+ release is completed during the early phase of the AP plateau. This finding is consistent with single cell voltage-clamp experiments where [Ca2+]i increased gradually with the duration of the voltage-clamp step for up to 8 ms, then longer steps produced no further increase in [Ca2+]i (Han et al. 1994). In guinea-pig heart, it has been previously reported that APDs are shorter at the apex than at the base (Kanai & Salama, 1995; Laurita et al. 1996). The duration of Ca2+i transients, [Ca2+]i,75, followed the apex to base gradients of APD and RP, indicating a gradual wave of relaxation from apex to base. Such gradients of relaxation could occur in situ because APD gradients have also been measured in ‘working’ heart preparations and in perfused ventricular sheets, at various levels of resting force (Salama et al. 1987; Kanai & Salama, 1995). Further studies are required to verify the spatial heterogeneities of Ca2+i transients as a function of left ventricular pre-load and after-load in working heart preparations.
Mechanisms underlying electro-mechanical alternans
T-wave alternans is a precursor of ventricular arrhythmia and may serve as a diagnostic tool for predicting the susceptibility to fibrillation. Alternans is produced when the heart rhythm is accelerated or when the myocardium is ischaemic or acidotic (Lewis, 1910). Spear & Moore (1971) showed that the degree of electrical alternans is highly species- and temperature dependent and is always accompanied by mechanical alternans. However, the relationship between the AP and Ca2+i is complex. APD alternans (long-short APDs) can be associated with concordant (large-small contractions) (Lee et al. 1988; Orchard et al. 1991) or with discordant (small-large contractions) (Spear & Moore, 1971; Kihara & Morgan 1991) mechanical alternans. Moreover, the degree and phase of odd/even alternans may be heterogeneously distributed across the ventricular wall (Lee et al. 1988; Konta et al. 1990). Both concordant and discordant alternans can be ‘in’ or ‘out’ of phase in different regions of the ventricular myocardium.
Several mechanisms have been proposed to explain electro- mechanical alternans. One explanation for concordant alternans is that electrical conduction alternates between two pathways causing APD alternans (Clancy et al. 1991; Brembilla-Perrot et al. 1997). A second possibility is that an alternans is initiated by an increase in rate because of the restitution kinetics of APs, which are an electrical adaptation to a rate change (Bass 1975; Boyett & Jewell, 1977). A third mechanism is that abnormal Ca2+i handling underlies concordant and discordant as well as spatially heterogeneous alternans. The first two mechanisms imply electrical instabilities (oscillations in conduction velocity or APDs) while the third implies abnormal Ca2+i handling. The Ca2+i hypothesis proposes that slow SR Ca2+ recycling and/or recovery of RyRs may cause Ca2+i oscillations between odd and even beats to cause APD alternation through Ca2+-dependent currents (Lee et al. 1988; Hirayama et al. 1993). However, a strict separation of electrical (ion channels responsible for the AP) from Ca2+i (processes controlling Ca2+i handling) mechanisms cannot be made unless APs and Ca2+i are measured simultaneously from multiple sites.
Restitution kinetics of APs and Ca2+i transients
The restitution kinetics of APs and Ca2+i were measured simultaneously by pacing hearts at a basic cycle length (S1-S1 = 300 ms) for 10 beats, then applying a premature stimulus at varying S1-S2 intervals. The premature beat elicited an AP of shorter APD and reduced [Ca2+]i,75 with decreasing diastolic interval (DI: the interval between the AP upstroke of the premature beat and the repolarization of the preceding AP). Measurements of premature APDs and of DIs were not readily automated because the DI is different at each site and the premature pulse interfered with the complete repolarization of the preceding AP. For this reason, APD and [Ca2+]i,75 were plotted against the S1-S2 interval. Like APD restitution curves, the amplitudes and rates-of-rise of APs and Ca2+i transients decrease as a function of the S1-S2 interval. The amplitude and rate-of-rise of the AP upstroke depend on the recovery of inward currents (INa and ICa) and decrease with decreasing S1-S2 intervals (Gettes & Reuter, 1974). The restitution of the amplitude and rate-of-rise of Ca2+i transients depends on ICa, the trigger for SR Ca2+ release, the reloading of Ca2+ in the lumen of the SR, the recovery of RyRs and/or the number of RyRs available for activation. Therefore, the restitution of Ca2+i depends partly on the AP restitution (ICa) as well as on processes involved in Ca2+i handling.
Programmed stimulation showed that all premature stimuli that elicited an AP also elicited a Ca2+i transient. Even at the shortest possible S1-S2 interval (180 ms), the amplitude and rate-of-rise of Ca2+i remained close to (≥ 65 %) the control values measured during basic S1-S1 stimulation (Fig. 7D and F). We never observed a complete failure of Ca2+ release from the SR when the premature pulse triggered an AP. However, as the S1-S2 interval decreased, there was a statistically significant increase in the delay between AP and Ca2+i upstrokes. The delayed but almost normal Ca2+i transient seen at short S1-S2 intervals (Fig. 6B) indicates that the recovery of RyRs from refractoriness and/or ICa, the trigger for SR Ca2+ release, are incomplete at short DIs. On the other hand, Ca2+ recycling by the SR appears to be sufficiently rapid to deliver a near normal release of Ca2+ and is not likely to be rate limiting at short DIs. The latter finding in perfused guinea-pig hearts is in agreement with single cell voltage-clamp studies which indicate that the SR network recycles and reloads its Ca2+ rapidly (∼10 ms) (Han et al. 1994).
Mechanisms underlying alternans elicited by a change in rate
In guinea-pig hearts, we found that electrical (APs) and mechanical (Ca2+i) alternans are elicited by switching from a long to a short CL. Such an alternans was always concordant, spatially ‘in phase’ and the amplitude of alternations was greater at the base than at the apex. Alternans attenuated gradually in amplitude and ceased after ∼20 beats at the short CL or ceased if pacing was resumed at the long CL. For any given initial CL, the ability of short CL stimuli to elicit alternans depends on the location of the pacing site because alternans occurred only when the CL was longer than the RP at the pacing site but shorter than that at the base of the heart. The conditions needed to initiate alternans argue strongly that the RP gradient is of critical importance in setting up these concordant alternans. Maps of activation and local conduction velocity show that the first beat at short CL (Fig. 11) encounters a line of conduction block near the base and propagates at the apex. Similarly, oscillations in conduction velocity between odd and even beats were produced by a slower propagation at the base than at the apex (Fig. 12). Both support a mechanism whereby the RP gradient is important to both the initiation and maintenance of alternans.
Our findings are consistent with other reports that implicate oscillations of conduction velocity (Clancy et al. 1991; Brembilla-Perrot et al. 1997) and explain the reason for these oscillations. Our data are also consistent with those of Spear & Moore (1971), who showed that alternans are difficult to induce in guinea-pig hearts, except at low temperatures. Lower temperatures prolong APDs and enhance repolarization gradients; both facilitate the initiation of alternans by increasing the range of long to short CLs that can elicit alternans.
Are rate-induced alternans pro-arrhythmic?
Our findings are in sharp contrast with those of Pastore et al. (1999), who elicited long lasting, spatially ‘out of phase’ APD alternans of high amplitudes in guinea-pig hearts by pacing in the range 270-315 beats min−1. Moreover, fibrillation was readily triggered with a single premature pulse applied to hearts with alternans at heart rates of ∼330 beats min−1 (Pastore et al. 1999), close to the physiological range for conscious, unrestrained guinea-pigs (240-310 beats min−1; Sisk, 1976). The initiation of alternans and the shift to fibrillation by a single extra pulse was attributed to heterogeneities of APD restitution kinetics, based on a previous study which showed a reversal in the direction of repolarization by a premature pulse (Laurita et al. 1996). It should be noted that the reversal of repolarization from base to apex is likely to be due to gradients of refractoriness (Choi & Salama, 1999b) rather than to heterogeneities of APD restitution kinetics, as proposed by Laurita et al. (1996). Several pilot experiments have been done to try to reconcile these divergent findings. We tested decreases in temperature (27 and 32°C instead of 37°C) and liquid nitrogen cryoablation of the Purkinje fibres (n = 4 hearts). Contrary to the findings of Pastore et al. (1999), rate changes under these different conditions did not precipitate long-lasting spatially heterogeneous alternans and did not enhance the propensity to fibrillation by a premature stimulus (authors’ unpublished data). In addition, the hearts used in the present study were sufficiently large to sustain re-entrant circuits and the dimensions of the hearts did not account for the spontaneous termination of alternans. We used hearts with a perimeter > 5 cm (guinea-pigs > 350 g), which is larger than the activation wavelength during alternans (λ= conduction velocity × APD = 26 (cm s−1) × 150 (ms) = 3.9 cm). Finally, we obtained the same results in hearts stained with RH237 but not Rhod-2 (n = 3 hearts), which negated the possibility that Rhod-2 might influence the type of alternans that can be elicited by a rate change.
On the other hand, we found that discordant, spatially heterogeneous alternans are readily elicited in ischaemic hearts, without requiring an increase in heart rate (Choi & Salama, 1999a,d). An ischaemia-induced alternans was long lasting and pacing readily promoted ventricular arrhythmias. Such a discordant alternans was not initiated by a line of functional conduction block and did not exhibit alternations in conduction velocity (Choi & Salama, 1999a), as described here for rate-induced concordant alternans (Figs 11 and 12). Our findings in ischaemic hearts agree with reports that ischaemia elicits discordant, non-uniform alternans associated with T-wave alternans, which are a harbinger of lethal arrhythmias (Lee et al. 1988; Verrier & Nearing, 1995; Wu & Clusin, 1997).
Cellular mechanisms underlying concordant alternans
A common mechanism has been proposed for alternans induced by an abrupt increase in heart rate and by ischaemia (Lab & Lee, 1990; Euler, 1999). Based on this hypothesis, Ca2+i transients cannot fully recover during an abrupt increase in rate, which results in alternation of Ca2+i, whereas APs adapt within one beat with a shortening of APD. Under ischaemic conditions, Ca2+i overload limits the recovery of Ca2+i transients, resulting in Ca2+i alternations. In both cases, alternation of Ca2+i may activate Ca2+-dependent membrane currents every other beat and produce alternations of APD. Simultaneous maps of optical APs and Ca2+i transients suggest that rate- and ischaemia-induced electrical and mechanical alternans are produced by very different mechanisms (Choi & Salama, 1999a). Ischaemia-induced alternans are elicited by abnormalities in Ca2+i handling (Choi & Salama, 1999a), whereas rate-induced alternans are initiated by heterogeneities of RP and not by Ca2+i alternations. If abnormal Ca2+i handling produced rate-dependent alternans then one would predict that a wide range of long to short CL would be effective at triggering alternans. However, only a narrow window of long to short CLs are effective at triggering alternans. Therefore, heterogeneities of RP play a critical role in the initiation and maintenance of electrical alternans induced by an increase in heart rate, and mechanical (Ca2+i) alternans are a consequence of alternations in AP upstroke velocity resulting in alternations of ICa, SR Ca2+ release and Ca2+i recycling.
Further mapping studies of APs and Ca2+i at low temperature under normoxic or ischaemic conditions will be needed to better understand the spatial and temporal properties of electro-mechanical alternans and their pro-arrhythmic mechanisms, using programmed stimulation.
Acknowledgments
This work was supported by grant awards from the National Institutes of Health, R01 HL 57929 and HL59614, to G.S. and a Pre-doctoral Fellowship from the Western Pennsylvania Affiliate of the American Heart Association to B.-R.C. Thanks are due to the staff of our Departmental Machine and Electronic Shop: Scott J. McPherson and William B. Hughes for the construction of optical components and heart chamber and Jim J. VonHedemann and Greg J. Szekeres for building the electronic interface from the arrays to the computer.
References
- Allen SP, Stone D, McCormack JG. The loading of fura-2 into mitochondria in the intact perfused rat heart and its use to estimate matrix Ca2+ under various conditions. Journal of Molecular and Cellular Cardiology. 1992;24:765–773. doi: 10.1016/0022-2828(92)93390-6. [DOI] [PubMed] [Google Scholar]
- Antzelevitch C, Sicouri S, Litovsky SH, Lukas A, Krishnan SC, Di Diego JM, Gintant GA, Liu DW. Heterogeneity within the ventricular wall. Electrophysiology and pharmacology of epicardial, endocardial, and M cells. Circulation Research. 1991;69:1427–1449. doi: 10.1161/01.res.69.6.1427. [DOI] [PubMed] [Google Scholar]
- Backx PH, Gao WD, Azan-Backx MD, Marban E. Regulation of intracellular calcium in cardiac muscle. Advances in Experimental Medicine and Biology. 1993;346:3–10. doi: 10.1007/978-1-4615-2946-0_1. [DOI] [PubMed] [Google Scholar]
- Bass BG. Restitution of the action potential in cat papillary muscle. American Journal of Physiology. 1975;228:1717–1724. doi: 10.1152/ajplegacy.1975.228.6.1717. [DOI] [PubMed] [Google Scholar]
- Bers DM. Excitation-Contraction Coupling and Cardiac Contractile Force. Dordrecht, The Netherlands: Kluwer; 1991. [Google Scholar]
- Boyett MR, Jewell BR. Causes of shortening of the cardiac action potential during a tension staircase. The Journal of Physiology. 1977;266:80–81. [PubMed] [Google Scholar]
- Brembilla-Perrot B, Lucron H, Schwalm F, Haouzi A. Mechanism of QRS electrical alternans. Heart. 1997;77:180–182. doi: 10.1136/hrt.77.2.180. [DOI] [PMC free article] [PubMed] [Google Scholar]
- Chacon E, Reece JM, Nieminen AL, Zahrebelski G, Herman B, Lemasters JJ. Distribution of electrical potential, pH, free Ca2+, and volume inside cultured adult rabbit cardiac myocytes during chemical hypoxia: a multiparameter digitized confocal microscopic study. Biophysical Journal. 1994;66:942–952. doi: 10.1016/S0006-3495(94)80904-X. [DOI] [PMC free article] [PubMed] [Google Scholar]
- Choi B-R, Salama G. Simultaneous maps of action potentials (AP) and Ca2+ transients (Cai) reveal that Cai oscillations underlie cellular discordant alternans. Circulation. 1999a;100:I50–51. [Google Scholar]
- Choi B-R, Salama G. The modulation of repolarization by a premature impulse is not due to heterogeneities of restitution kinetics (RK) but to dispersion of refractory periods (RP) on the epicardium. Circulation. 1999b;100:150–51. [Google Scholar]
- Choi B-R, Salama G. Simultaneous maps of action potentials (APs) and intracellular calcium transients (Cai) recorded from guinea pig hearts. Biophysical Journal. 1999c;76:A296. [Google Scholar]
- Choi B-R, Salama G. Spatio-temporal relationship between action potentials and Ca2+ transients in anterior region of guinea pig hearts. Pacing and Clinical Electrophysiology. 1999d;22:702. [Google Scholar]
- Clancy EA, Smith JM, Cohen RJ. A simple electrical-mechanical model of the heart applied to the study of electrical-mechanical alternans. IEEE Transactions on Biomedical Engineering. 1991;38:551–560. doi: 10.1109/10.81580. [DOI] [PubMed] [Google Scholar]
- Cross HR, Lu L, Steenbergen C, Philipson KD, Murphy E. Overexpression of the cardiac Na+/Ca2+ exchanger increases susceptibility to ischemia/reperfusion injury in male, but not female, transgenic mice. Circulation Research. 1998;83:1215–1223. doi: 10.1161/01.res.83.12.1215. [DOI] [PubMed] [Google Scholar]
- Del Nido PJ, Glynn P, Buenaventura P, Salama G, Koretsky AP. Fluorescence measurement of calcium transients in perfused rabbit heart using Rhod 2. American Journal of Physiology. 1998;274:H728–741. doi: 10.1152/ajpheart.1998.274.2.H728. [DOI] [PubMed] [Google Scholar]
- Dillon S, Morad M. A new laser scanning system for measuring action potential propagation in the heart. Science. 1981;214:453–456. doi: 10.1126/science.6974891. [DOI] [PubMed] [Google Scholar]
- Efimov IR, Huang DT, Rendt JM, Salama G. Optical mapping of repolarization and refractoriness from intact hearts. Circulation. 1994;90:1469–1480. doi: 10.1161/01.cir.90.3.1469. [DOI] [PubMed] [Google Scholar]
- Euler DE. Cardiac alternans: mechanisms and pathophysiological significance. Cardiovascular Research. 1999;42:583–590. doi: 10.1016/s0008-6363(99)00011-5. [DOI] [PubMed] [Google Scholar]
- Fabiato A, Fabiato F. Use of chlorotetracycline fluorescence to demonstrate Ca2+-induced release of Ca2+ from the sarcoplasmic reticulum of skinned cardiac cells. Nature. 1979;281:146–148. doi: 10.1038/281146a0. [DOI] [PubMed] [Google Scholar]
- Gettes LS, Reuter H. Slow recovery from inactivation of inward currents in mammalian myocardial fibres. The Journal of Physiology. 1974;240:703–724. doi: 10.1113/jphysiol.1974.sp010630. [DOI] [PMC free article] [PubMed] [Google Scholar]
- Gray RA, Pertsov AM, Jalife J. Spatial and temporal organization during cardiac fibrillation. Nature. 1998;392:75–78. doi: 10.1038/32164. [DOI] [PubMed] [Google Scholar]
- Han S, Schiefer A, Isenberg G. Ca2+ load of guinea-pig ventricular myocytes determines efficacy of brief Ca2+ currents as trigger for Ca2+ release. The Journal of Physiology. 1994;480:411–421. doi: 10.1113/jphysiol.1994.sp020371. [DOI] [PMC free article] [PubMed] [Google Scholar]
- Hirayama Y, Saitoh H, Atarashi H, Hayakawa H. Electrical and mechanical alternans in canine myocardium in vivo. Dependence on intracellular calcium cycling. Circulation. 1993;88:2894–2902. doi: 10.1161/01.cir.88.6.2894. [DOI] [PubMed] [Google Scholar]
- Kanai A, Salama G. Optical mapping reveals that repolarization spreads anisotropically and is guided by fiber orientation in guinea pig hearts. Circulation Research. 1995;77:784–802. doi: 10.1161/01.res.77.4.784. [DOI] [PubMed] [Google Scholar]
- Kihara Y, Morgan JP. Abnormal Ca2+ handling is the primary cause of mechanical alternans: study in ferret ventricular muscles. American Journal of Physiology. 1991;261:H1746–1755. doi: 10.1152/ajpheart.1991.261.6.H1746. [DOI] [PubMed] [Google Scholar]
- Kobayashi Y, Peters W, Khan SS, Mandel WJ, Karagueuzian HS. Cellular mechanisms of differential action potential duration restitution in canine ventricular muscle cells during single versus double premature stimuli. Circulation. 1992;86:955–967. doi: 10.1161/01.cir.86.3.955. [DOI] [PubMed] [Google Scholar]
- Konta T, Ikeda K, Yamaki M, Nakamura K, Honma K, Kubota I, Yasui S. Significance of discordant ST alternans in ventricular fibrillation. Circulation. 1990;82:2185–2189. doi: 10.1161/01.cir.82.6.2185. [DOI] [PubMed] [Google Scholar]
- Lab MJ, Lee JA. Changes in intracellular calcium during mechanical alternans in isolated ferret ventricular muscle. Circulation Research. 1990;66:585–595. doi: 10.1161/01.res.66.3.585. [DOI] [PubMed] [Google Scholar]
- Laflamme MA, Becker PL. Ca2+-induced current oscillations in rabbit ventricular myocytes. Circulation Research. 1996;78:707–716. doi: 10.1161/01.res.78.4.707. [DOI] [PubMed] [Google Scholar]
- Lakatta EG, Guarnieri T. Spontaneous myocardial calcium oscillations: are they linked to ventricular fibrillation? Journal of Cardiovascular Electrophysiology. 1993;4:473–489. doi: 10.1111/j.1540-8167.1993.tb01285.x. [DOI] [PubMed] [Google Scholar]
- Laurita KR, Girouard SD, Rosenbaum DS. Modulation of ventricular repolarization by a premature stimulus. Role of epicardial dispersion of repolarization kinetics demonstrated by optical mapping of the intact guinea pig heart. Circulation Research. 1996;79:493–503. doi: 10.1161/01.res.79.3.493. [DOI] [PubMed] [Google Scholar]
- Lee HC, Mohabir R, Smith N, Franz MR, Clusin WT. Effect of ischemia on calcium-dependent fluorescence transients in rabbit hearts containing indo 1. Correlation with monophasic action potentials and contraction. Circulation. 1988;78:1047–1059. doi: 10.1161/01.cir.78.4.1047. [DOI] [PubMed] [Google Scholar]
- Lewis T. Notes upon alternation of the heart. Quarterly Journal of Medicine. 1910;4:141–144. [Google Scholar]
- Niggli E. Localized intracellular calcium signaling in muscle: calcium sparks and calcium quarks. Annual Review of Physiology. 1999;61:311–335. doi: 10.1146/annurev.physiol.61.1.311. [DOI] [PubMed] [Google Scholar]
- Noble D, Powell T. The slowing of Ca2+ signals by Ca2+ indicators in cardiac muscle. Proceedings of the Royal Society. 1991;246:167–172. doi: 10.1098/rspb.1991.0140. B. [DOI] [PubMed] [Google Scholar]
- Orchard CH, McCall E, Kirby MS, Boyett MR. Mechanical alternans during acidosis in ferret heart muscle. Circulation Research. 1991;68:69–76. doi: 10.1161/01.res.68.1.69. [DOI] [PubMed] [Google Scholar]
- Pastore JM, Girouard SD, Laurita KR, Akar FG, Rosenbaum DS. Mechanism linking T-wave alternans to the genesis of cardiac fibrillation. Circulation. 1999;99:1385–1394. doi: 10.1161/01.cir.99.10.1385. [DOI] [PubMed] [Google Scholar]
- Patterson E, Szabo B, Scherlag BJ, Lazzara R. Early and delayed afterdepolarizations associated with cesium chloride-induced arrhythmias in the dog. Journal of Cardiovascular Pharmacology. 1990;15:323–331. doi: 10.1097/00005344-199002000-00021. [DOI] [PubMed] [Google Scholar]
- Pierce GN, Czubryt MP. The contribution of ionic imbalance to ischemia/reperfusion-induced injury. Journal of Molecular and Cellular Cardiology. 1995;27:53–63. doi: 10.1016/s0022-2828(08)80007-7. [DOI] [PubMed] [Google Scholar]
- Prabhu SD. Ryanodine and the left ventricular force-interval and relaxation-interval relations in closed-chest dogs: insights on calcium handling. Cardiovascular Research. 1998;40:483–491. doi: 10.1016/s0008-6363(98)00201-6. [DOI] [PubMed] [Google Scholar]
- Prabhu SD, Salama G. Reactive disulfide compounds induce Ca2+ release from cardiac sarcoplasmic reticulum. Archives of Biochemistry and Biophysics. 1990;282:275–283. doi: 10.1016/0003-9861(90)90117-h. [DOI] [PubMed] [Google Scholar]
- Qu Z, Weiss JN, Garfinkel A. Cardiac electrical restitution properties and stability of reentrant spiral waves: a simulation study. American Journal of Physiology. 1999;276:H269–283. doi: 10.1152/ajpheart.1999.276.1.H269. [DOI] [PubMed] [Google Scholar]
- Salama G. Optical measurements of transmembrane potential in heart. In: Loew L, editor. Spectroscopic Probes of Membrane Potential. Boca Raton: CRC Uniscience Pub; 1988. pp. 137–199. chap. 21. [Google Scholar]
- Salama G, Choi B-R. Images of action potential propagation in heart. News in Physiological Sciences. 2000;15:33–41. doi: 10.1152/physiologyonline.2000.15.1.33. [DOI] [PubMed] [Google Scholar]
- Salama G, Kanai A, Efimov IR. Subthreshold stimulation of Purkinje fibers interrupts ventricular tachycardia in intact hearts. Experimental study with voltage-sensitive dyes and imaging techniques. Circulation Research. 1994;74:604–619. doi: 10.1161/01.res.74.4.604. [DOI] [PubMed] [Google Scholar]
- Salama G, Lombardi R, Elson J. Maps of optical action potentials and NADH fluorescence in intact working hearts. American Journal of Physiology. 1987;252:H384–394. doi: 10.1152/ajpheart.1987.252.2.H384. [DOI] [PubMed] [Google Scholar]
- Santana LF, Cheng H, Gomez AM, Cannell MB, Lederer WJ. Relation between the sarcolemmal Ca2+ current and Ca2+ sparks and local control theories for cardiac excitation-contraction coupling. Circulation Research. 1996;78:166–171. doi: 10.1161/01.res.78.1.166. [DOI] [PubMed] [Google Scholar]
- Schreur JH, Figueredo VM, Miyamae M, Shames DM, Baker AJ, Camacho SA. Cytosolic and mitochondrial [Ca2+] in whole hearts using indo-1 acetoxymethyl ester: effects of high extracellular Ca2+ Biophysical Journal. 1996;70:2571–2580. doi: 10.1016/S0006-3495(96)79828-4. [DOI] [PMC free article] [PubMed] [Google Scholar]
- Shimizu W, Antzelevitch C. Cellular and ionic basis for T-wave alternans under long-QT conditions. Circulation. 1999;99:1499–1507. doi: 10.1161/01.cir.99.11.1499. [DOI] [PubMed] [Google Scholar]
- Sisk D. Physiology. In: Wagner JE, Manning PJ, editors. The Biology of the Guinea Pig. New York: Academic Press, Inc; 1976. pp. 63–92. chap. 7. [Google Scholar]
- Spear JF, Moore EN. A comparison of alternation in myocardial action potentials and contractility. American Journal of Physiology. 1971;220:1708–1716. doi: 10.1152/ajplegacy.1971.220.6.1708. [DOI] [PubMed] [Google Scholar]
- Stern MD. Theory of excitation-contraction coupling in cardiac muscle. Biophysical Journal. 1992;63:497–517. doi: 10.1016/S0006-3495(92)81615-6. [DOI] [PMC free article] [PubMed] [Google Scholar]
- Tweedie D, Harding SE, MacLeod K. Sarcoplasmic reticulum Ca2+ content, sarcolemmal Ca2+ influx and the genesis of arrhythmias in isolated guinea-pig cardiomyocytes. Journal of Molecular and Cellular Cardiology. 2000;32:261–272. doi: 10.1006/jmcc.1999.1070. [DOI] [PubMed] [Google Scholar]
- Verrier RL, Nearing BD. Electrophysiologic basis for T wave alternans as an index of vulnerability to ventricular fibrillation. Journal of Cardiovascular Electrophysiology. 1994;5:445–461. doi: 10.1111/j.1540-8167.1994.tb01184.x. [DOI] [PubMed] [Google Scholar]
- Verrier RL, Nearing BD. T wave alternans as a harbinger of ischemia-induced sudden cardiac death. In: Zipes DP, Jalife J, editors. Cardiac Electrophysiology. Philadelphia: W.B. Saunders; 1995. pp. 467–477. [Google Scholar]
- Watanabe M, Otani NF, Gilmour RF., Jr Biphasic restitution of action potential duration and complex dynamics in ventricular myocardium. Circulation Research. 1995;76:915–921. doi: 10.1161/01.res.76.5.915. [DOI] [PubMed] [Google Scholar]
- Witkowski FX, Leon LJ, Penkoske PA, Giles WR, Spano ML, Ditto WL, Winfree AT. Spatiotemporal evolution of ventricular fibrillation. Nature. 1998;392:78–82. doi: 10.1038/32170. [DOI] [PubMed] [Google Scholar]
- Wu Y, Clusin WT. Calcium transient alternans in blood-perfused ischemic hearts: observations with fluorescent indicator Fura red. American Journal of Physiology. 1997;273:H2161–2169. doi: 10.1152/ajpheart.1997.273.5.H2161. [DOI] [PubMed] [Google Scholar]