Abstract
Clinical investigation of malaria is hampered by the lack of a method for estimating the number of parasites that are sequestered in the tissues, for it is these parasites that are thought to be crucial to the pathogenesis of life-threatening complications such as cerebral malaria. We present a method of estimating this hidden population by using clinical observations of peripheral parasitemia combined with an age-structured mathematical model of the parasite erythrocyte cycle. Applying the model to data from 217 Gambian children undergoing treatment for cerebral malaria we conclude that although artemether clears parasitemia more rapidly than quinine, the clearance of sequestered parasites is similar for the two drugs. The estimated sequestered mass was found to be a more direct predictor of fatal outcome than clinically observed parasitemia. This method allows a sequential analysis of sequestered parasite population dynamics in children suffering from cerebral malaria, and the results offer a possible explanation for why artemether provides less advantage than might have been expected over quinine in reducing mortality despite its rapid effect on circulating parasites.
There is a pressing need to develop more effective therapies for cerebral malaria, which kills about half a million African children each year. On the central issue of which antimalarial drug to use, it has been widely assumed that artemisinin and its derivatives should prove preferable because they act to suppress parasitemia more rapidly than quinine, the standard therapy for cerebral malaria. Such assumptions have been called into question by two large studies that failed to demonstrate a significant reduction in mortality or neurological sequelae when artemether (an artemisinin derivative) was compared with quinine (1, 2).
The question of antimalarial drug efficacy relates to a fundamental problem in infectious disease, namely that clinical samples taken from accessible sites such as peripheral blood can provide a biased picture of the progression of the infection in affected tissues. In the case of Plasmodium falciparum infection, parasitized erythrocytes sequester in the microvasculature of various organs including the brain. This process of sequestration is confined to mature parasites and is mediated by a surface ligand on the infected erythrocyte that binds to endothelial adhesion molecules. At sites of sequestration, mature parasites develop and finally rupture from host erythrocytes to release their progeny. Erythrocytes containing young parasites can circulate freely, and it is only these immature forms of the parasite that are seen on peripheral blood smears.
Clearly it is impossible to form a reliable picture of the response to antimalarial therapy without knowing the behavior of the sequestered parasite population. Because antimalarial drugs are known to act preferentially on different stages of parasite development, it is conceivable that a drug that caused faster clearance of parasites from the peripheral blood might cause slower clearance of sequestered parasites. This is of particular importance because parasite sequestration is held to be responsible for much of the pathology of severe malaria, causing microvascular obstruction with consequent metabolic and inflammatory derangements (3). Because there is no direct method of measuring the sequestered mass, we have developed an age-structured mathematical model that allows the number of sequestered parasites to be estimated from sequential observations of parasitemia on peripheral blood smears. We have used this method to compare the effects of artemether and quinine on sequestered parasite population dynamics in children with cerebral malaria, and to investigate the relationship between sequestered parasite numbers and clinical outcome.
METHODS
Clinical Data.
We analyzed parasitemia data from 217 sequential admissions with cerebral malaria to the pediatric unit of the Royal Victoria Hospital, The Gambia, during the rainy seasons of 1992 and 1994. The inclusion criteria were: (i) cerebral malaria, defined as a Blantyre coma score of ≤2 together with asexual forms of P. falciparum on thick blood film and (ii) parental consent for inclusion in a randomized therapeutic trial. The exclusion criteria were: (i) intercurrent diseases other than malaria and (ii) prior treatment with quinine or artemether. All patients were randomized to receive treatment with either artemether or quinine. Artemether (Paluther, Rhone-Poulenc Rorer, France) was given intramuscularly for 4 days, in an initial dose of 3.2 mg/kg followed by daily doses of 1.6 mg/kg. Quinine hydrochloride (Rotexmedica, Germany) was given intramuscularly for 5 days, in an initial dose of 20 mg/kg followed by 12 hourly doses of 10 mg/kg. The level of parasitemia was determined at the start of treatment and 12 hourly thereafter, by averaging the results of two independent observers who counted the number of asexual parasites per 200 white cells (on thick blood films) or per 1,000 red cells (on thin blood films). These data form part of a larger investigation, which is described elsewhere (1), and which was approved by the Medical Research Council/Gambian Government Joint Ethical Committee.
Age-Structured Model of the Parasite Erythrocyte Cycle.
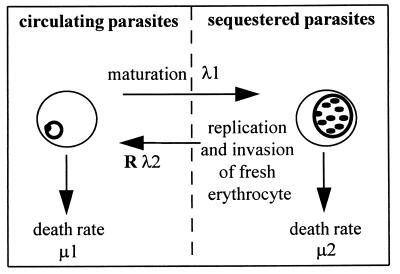
The asexual reproductive cycle of the parasite within erythrocytes is illustrated in Fig. 1. To examine the rate of change of circulating and sequestered parasites, we used the following differential equations:
 |
 |
The densities of circulating and sequestered parasites at time t are represented by n1(t) and n2(t), respectively. Transition from the circulating to the sequestered compartment is governed by the constant continuous rate λ1. The rate of transition from the sequestered to the circulating compartment is Rλ2, where R is the number of young parasites generated by each parasite that successfully completes the reproductive cycle. Parasite death within the circulating and sequestered compartments is denoted by constant per capita rates μ1 and μ2, respectively.
Figure 1.
Schematic of erythrocytic cycle of P. falciparum malaria. The parasite grows and replicates within host erythrocytes. Forty-eight hours after invasion, the erythrocyte ruptures releasing (R) parasite progeny, which can quickly invade other erythrocytes. Initially, the infected erythrocyte circulates in the peripheral blood, but halfway through the cycle it sequesters in the microvascular and is absent from peripheral circulation. The rate of transition out of a compartment (λi) is the inverse of the average time spent in that compartment. Parasite death rates (μi) represent the effect of drug therapy as well as the background effects of immunity and natural loss.
Some of the parameters of the model can be estimated from prior data. The average duration of the entire cycle is 48 hr, with some small variation observed in vitro. Experimental studies have shown that parasites start to adhere to endothelium at 16 hr (4), and examination of blood films in patients indicates that the average time of sequestration in vivo is around 24–26 hr (5, 6). A source of data for the estimation of R comes from clinical studies conducted on patients who were artificially infected with malaria as a form of treatment for neurosyphilis, where the early exponential rise in parasitemia indicates that R is approximately 10 (7, 8). Thus we initially set R = 10 and λ1 = λ2 = 1/24 hr−1 (i.e., a parasite observed in the peripheral blood compartment will sequester after an average of 24 hr, the distribution being exponential), and later we explored the effect of varying these parameters on model output. The parameters to be estimated from the clinical data are the stage-specific death rates, μ1 and μ2. Model simulations also require an estimate of the ratio of sequestered to circulating parasites (n2/n1) at the onset of treatment.
Parameter Estimation and Statistical Analysis.
The parameters μ1 and μ2 will be influenced by many factors including natural loss and the effects of host immunity. However, for the patients in this study, the effect of antimalarial therapy will be a dominant factor; thus differences in the average values for μ1 and μ2 for the artemether and quinine groups provide a comparison of the antiparasitic effects of the two drugs.
Methods based on bootstrapping (9) were used to estimate mean values for μ1 and μ2, and to determine the statistical variance of these parameters. A “bootstrap” sample contains n parasite clearance curves drawn at random, with replacement, from the full set of n individuals who received a particular drug. From each bootstrap sample, a mean (geometric) parasitemia clearance curve was calculated and point estimates made of μ1, μ2, and n2/n1(t=0). The estimate was based on the best fit of the model to the sample, using a nonlinear least-squares algorithm [NAG routine E04JAF (1992), Numerical Algorithms Group, Oxford, U.K.]. We derived 999 such bootstrap samples from both antimalarial groups, and estimated a parameter set from each. By averaging over the estimates from each sample, this process generates values for the mean and standard error of μ1, μ2, and n2/n1(t=0). The mean (geometric) sequestered parasite clearance curves, and the standard error about the curves, were calculated from model simulations by using the 999 estimates of μ1, μ2, and n2/n1(t=0) in each drug group.
Where possible we sought to estimate the number of sequestered parasites in individual patients. This analysis was confined to those patients with 12 hourly parasite counts for at least the first 24 hr after initial treatment. Because of the small number of data points per individual, it was not feasible to estimate μ1, μ2, and n2/n1(t=0) on an individual basis. Instead, for each individual we made the simplifying assumption that μ1 and μ2 lay close to the average values for the corresponding antimalarial drug (calculated as above), and then used the clinical data to estimate n2/n1(t=0) for that individual. This was done by using a nonlinear least-squares algorithm to identify the value for which the model gave the best fit to the clinical data (NAG E04JAF).
The average estimates of μ1 and μ2 for artemether and quinine were compared with t tests. Individual estimates of sequestered parasite numbers at the start of therapy, together with corresponding observations of peripheral parasitemia, were analyzed for their relationship to mortality with logistic regression.
RESULTS
Clinical Data.
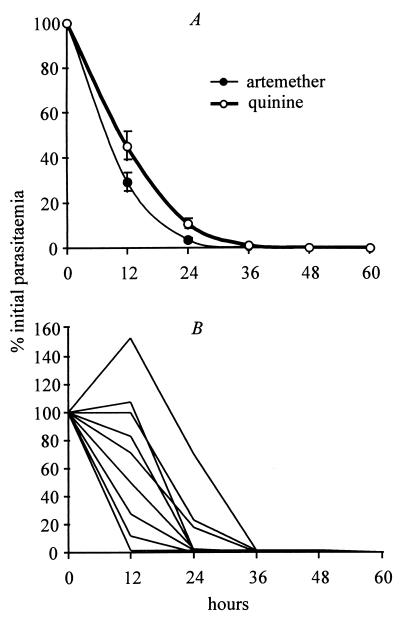
One hundred and eight children received artemether and 109 received quinine. As reported previously (1, 2), artemether cleared parasitemia significantly more rapidly than quinine (Fig. 2A) but did not give a significant improvement in clinical outcome. Twenty-four of 108 children treated with artemether died, compared with 28 of 109 children treated with quinine (χ2 = 0.4, P = 0.5).
Figure 2.
Quinine and artemether parasite clearance curves. (A) Observed parasitemia (geometric mean percentage of admission value ± SE) in children treated for cerebral malaria with artemether (n = 108) or quinine (n = 109). (B) Sample of individual parasite clearance curves taken from the artemether group (the same patterns were observed in the quinine group). Data are from ref. 1.
Fig. 2B illustrates that the amalgamated data conceal a considerable amount of variation in parasite clearance rates. Some individuals reduced their parasitemia to below detectable levels within 12 hr, whereas others showed a large increase in parasitemia over this time. One element of this variability is the age structure of the parasite population at the commencement of treatment. If two children have identical circulating parasitemia (i.e., young parasites) but differ in their sequestered parasite load (i.e., mature parasites), they are likely to show different patterns of response to treatment. This variation between individuals is explored below.
Average Sequestered Parasite Clearance Curves for Artemether and Quinine.
The parameters μ1 and μ2 are representative of the stage-specific effects of an antimalarial drug on circulating and sequestered parasites, respectively. The mean estimate of μ1 was 3.08 ± 0.15 for artemether and 1.98 ± 0.32 for quinine (units per 12 hr ± SE). The mean estimate of μ2 was 3.32 ± 0.37 for artemether and 3.77 ± 0.78 for quinine. The results show that artemether is significantly more effective than quinine at killing parasites in the circulating compartment (μ1artemether vs. μ1quinine, P = 0.002). For parasites within the sequestered compartment, quinine appeared marginally more effective but this was not statistically significant (μ2artemether vs. μ2quinine, P = 0.6). As expected from the randomization procedure, the average initial ratio of sequestered to circulating parasites did not differ significantly between the artemether and quinine groups (1.29 ± 0.4 vs. 1.04 ± 0.4, P = 0.5).
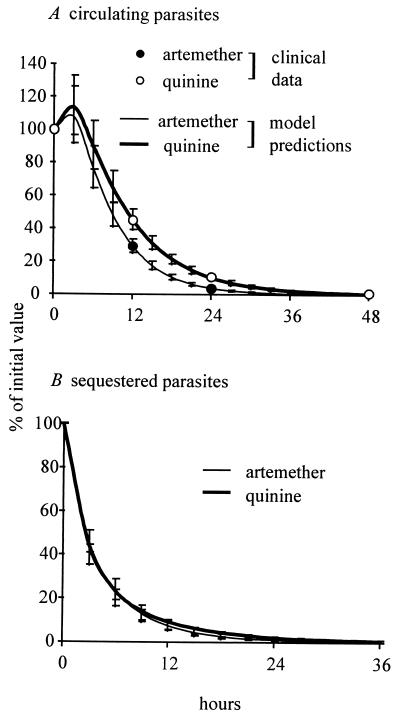
Fig. 3 shows model simulations of circulating and sequestered parasite numbers for the average patient receiving either artemether or quinine, based on the above parameter estimates. It can be seen (Fig. 3A) that the simulation of circulating parasites fits well with the clinically observed parasitemia data. Fig. 3B indicates that sequestered parasites generally are cleared much more rapidly than circulating parasites. In contrast to the clearance of circulating parasites, the number of sequestered parasites declines at essentially the same rate in the artemether and quinine groups. When compared with the number of sequestered parasites at the start of treatment, giving geometric mean values (with 95% confidence interval) for artemether and quinine, respectively, at 6 hr it was 23% (16–34) vs. 23% (10–54); at 12 hr, 7.4% (4–14) vs. 9.2% (3–27); and at 24 hr, 1% (0.3–2.3) vs. 1.9% (0.5–7).
Figure 3.
Model predictions from parameter estimation process. (A) Comparison of averaged clinical data from Fig. 2A (circles) to the model simulations using parameters estimated from the clinical data. (B) Estimated geometric mean (±SE) sequestered parasite clearance. Data are expressed as percentage of admission value.
Sequestered Parasite Population Dynamics in Individual Patients.
This analysis was confined to 136 individuals (artemether, 68, and quinine, 68) who had reliable parasite counts over at least the first 24 hr. After estimating the initial ratio of parasites in the sequestered-to-circulating compartments for each individual (see Methods), the model was used to simulate both circulating and sequestered parasite clearance. For 59/68 in the artemether group and 52/68 in the quinine group, the proportion of variation in the clinical data explained by the model (R2) was greater than 0.85.
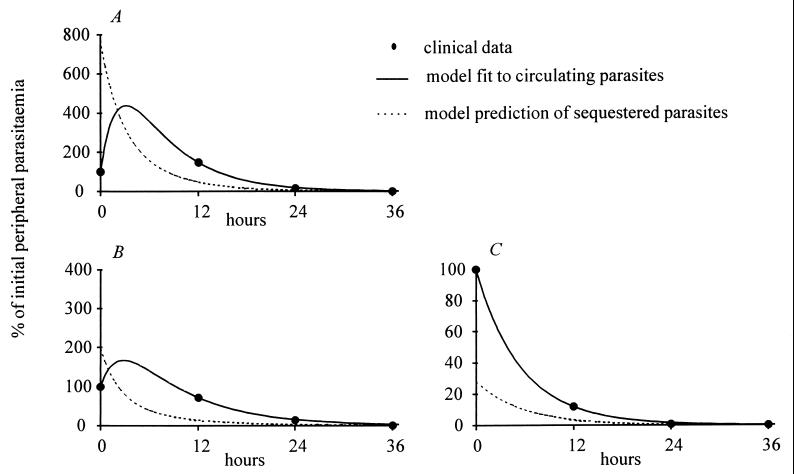
Three examples of these model simulations are shown in Fig. 4, together with the corresponding clinical data. Patient A showed an initial rise in parasitemia despite treatment, which could be explained by the high estimate of the ratio of sequestered to circulating parasites at the start of therapy (7:1). Patient B showed a delay before parasite clearance, suggesting a starting ratio of 2:1. Patient C showed very fast parasite clearance, implying a low ratio (0.3:1) of sequestered to circulating parasites at the start of treatment.
Figure 4.
Sequestered and peripheral parasite dynamics in individual infections. Three examples of individual peripheral parasite clearance data are shown together with the corresponding model fit and predicted sequestered population dynamics. (A and B) Treated with quinine. (C) Treated with artemether.
Relationship Between Parasite Density and Disease Severity.
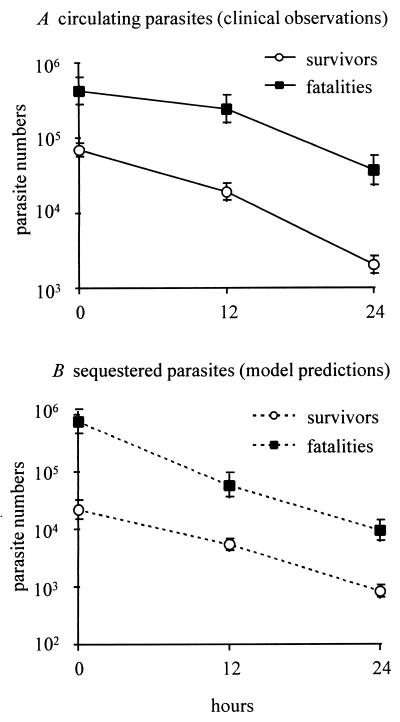
Using the estimates of individual sequestered population dynamics, we investigated the relationship of sequestered parasite load to fatal outcome, confining the analysis to those cases in which the model fit the observed data well (R2 > 0.85). One hundred of these patients survived infection (artemether, 55, and quinine, 45), and 11 died (artemether, 4, and quinine, 7). Because our model does not describe erythrocyte dynamics, the sequestered parasite density refers to the number of sequestered parasites relative to the number of parasites observed in a defined peripheral blood volume (here, 1 μl). Both observed parasitemia and estimated sequestered parasite numbers tended to be higher in the fatal cases than in the survivors (Fig. 5). The clinical data recorded that the surviving patients had a geometric mean parasitemia of 69,590 parasites/μl of blood at the onset of treatment and the fatal cases had a mean of 426,282. Our estimates of the relative numbers in the sequestered compartment were 22,116 in the survivors and 759,502 in the fatalities. These observations raise the question of whether fatal outcome is determined truly by the number of circulating parasites, or by the number of sequestered parasites, or both. This was explored by using stepwise logistic regression analysis with three independent variables: a, observed parasitemia at start of treatment; b, estimated sequestered parasite numbers at start of treatment; and c, the type of antimalarial drug used. Both forward and backward stepwise methods revealed that, when these three variables are considered together, the number of sequestered parasites is the only significant predictor of fatal outcome (P = 0.008, Wald statistic, 7.1). Despite choosing an undemanding criterion (P < 0.1) for the inclusion of a variable in the final statistical predictive model, both observed parasitemia (P = 0.57) and the type of antimalarial drug used (P = 0.23) were rejected as informative variables. If the survivors whose infection was complicated by neurological sequelae were excluded (artemether, 10; quinine, 9), the same trends resulted (Wald statistic for sequestered mass, 6.3; P = 0.01).
Figure 5.
Relationship between parasite density and mortality from cerebral malaria. Circulating parasites (A) and estimated sequestered parasites (B). Both are expressed as geometric means (±SE) of the number of parasites relative to 1 μl of peripheral blood.
Sensitivity of Model Output to Fixed Parameter Assumptions.
Although approximations for λ1 and Rλ2 are available in the literature, it was important to test the sensitivity of the model output to perturbations in these parameters. We repeated the estimation process for a 50% reduction in R. The effect on the parasite death rates was to reduce them by an average of 12%. The estimated sequestered clearance curves, however, remained similar to Fig. 3 (24%, 7%, and 1% at 6, 12, and 24 hr for artemether; 19%, 6%, and 1%, respectively, for quinine). The analysis with R set at a low value of 2 further reduced the estimated parasite death rates, but yielded similar results in the comparison of drug categories: average parasite clearance to 26%, 7%, and 1% for artemether and 25%, 8%, and 1% for quinine. Finally, we repeated the analysis for sequestration occurring at 18 rather than 24 hr. The same trends resulted, though this parameter had a less marked affect. Parasite death rates were reduced by an average of 2%, and estimated sequestered clearance at 6, 12, and 24 hr was 25%, 8%, and 1% in the artemether group and 26%, 10%, and 2% in the quinine group. In each case, the significant relationship between individual sequestered parasite numbers and fatal outcome remained.
DISCUSSION
The efficacy of an antimalarial drug is measured conventionally by the rate at which parasites are cleared from the peripheral circulation. The above observations clearly demonstrate that such measurements may fail to reflect the behavior of sequestered parasites. Artemether is known to clear parasites from the circulation more rapidly than quinine, but these results indicate that the clearance of sequestered parasites in similar for the two drugs. Importantly, it is the estimated number of sequestered parasites rather than the observed number of circulating parasites that appears to be the critical determinant of fatal outcome.
Our central argument is that the intraerythrocytic life cycle can be reduced, at least to a first approximation, to a simple, age-structured model containing only five parameters, of which three are approximately known. The two unknown parameters are the death rates of circulating and sequestered parasites, and these can be estimated from clinical data. These death rates will be determined by factors such as natural loss and host immunity, as well as the effects of antimalarial therapy, but by comparing the death rates for two different antimalarial drugs we can gauge their relative efficacy against different stages of parasite development. When the model was used to analyze data from children undergoing treatment for cerebral malaria, the results were consistent with in vitro evidence that quinine acts mainly against older parasites whereas artemether has a broader range of action (10, 11).
It is reassuring that the above conclusions are relatively independent of the starting assumptions of the model. For example, it was assumed initially that sequestration occurs, on average, at 24 hr after erythrocyte invasion and that the average number of young parasites generated by the rupture of a mature parasite (R) is 10. There are clinical data to suggest that these are reasonable approximations, but it was important to determine whether our findings are affected by changes in these parameters. Therefore, we repeated the estimation process on three separate occasions, assuming instead that R = 5, R = 2, or sequestration occurs at 18 hr. These changes did not alter our conclusions that artemether kills circulating parasites more effectively than quinine, that sequestered parasites are similarly affected by both drugs, and that disease outcome is better related to sequestered numbers than to peripheral parasitemia.
When parasitemia rises after the commencement of treatment, it often is wrongly assumed that this is because of drug resistance. White et al. (12) have pointed out that this may simply indicate that a large proportion of the total parasite load is sequestered, and this is clearly illustrated in Fig. 4. Using the average death rates estimated for the artemether or quinine groups as a whole, and applying the model to individual patients, we can achieve a close fit to the clinical data in more than 80% of cases by simply generating an estimate of the sequestered/peripheral ratio at the start of treatment. This allows us to explore the relationship between sequestration and clinical outcome. As illustrated in Fig. 5, both observed parasitemia and estimated sequestered numbers at the start of treatment were higher in fatal cases than in survivors. To explore the question of what truly determines fatal outcome, we carried out a logistic regression analysis with observed parasitemia and estimated sequestered parasite numbers as independent variables. When both variables were considered together, the estimated number of sequestered parasites was the only significant predictor of fatal outcome. This result suggests that peripheral parasitemia can predict clinical outcome, but only insofar as it reflects the number of sequestered parasites, which is not the case in highly synchronous infections or during treatment with an antimalarial drug that acts on a specific stage of parasite development. In the subset of individual patients analyzed in this way, an admission parasitemia of >250,000 parasites per μl of blood represented a 22% risk of fatal outcome. If that group was further divided into those with initially greater than or less than 250,000 sequestered parasites, the risks of fatal outcome were 30% and 8%, respectively.
This study provides an example of how mathematical frameworks may be used to explore the mechanisms that control parasite populations within their hosts (13). The advantage of using a simple model of this sort is that all of the essential parameters can be estimated from routine clinical data. With the collection of more detailed parasitemia data, the basic model can easily be expanded upon to analyze parasite age structure more accurately (by adding more compartments to the model) and to explore complex issues such as the variation in the parameters that may exist between different parasite strains, between different hosts, and within a single individual over time.
Acknowledgments
We are grateful to all those involved in clinical data collection, particularly Brian Greenwood, Ayo Palmer, and the clinicians and nurses at the Royal Victoria Hospital. For helpful discussions, thanks to Dan Haydon and Alun Lloyd. M.G. is supported by an Medical Research Council Research Fellowship and D.K. is supported by an Medical Research Council Senior Fellowship.
Footnotes
This paper was submitted directly (Track II) to the Proceedings Office.
References
- 1.Boele van Hensbroek M, Onyiorah E, Jaffar S, Schneider G, Palmer A, Frenkel J, Enwere G, Forck S, Nusmeijer A, Bennet S, et al. N Engl J Med. 1996;335:69–75. doi: 10.1056/NEJM199607113350201. [DOI] [PubMed] [Google Scholar]
- 2.Tran T H, Day N P, Nguyen H P, Nguyen T H, Tran T H, Pham P L, Dinh X S, Ly V C, Ha V, Waller D, et al. N Engl J Med. 1996;335:124–126. doi: 10.1056/NEJM199607113350202. [DOI] [PubMed] [Google Scholar]
- 3.White N J, Ho M. Adv Parasitol. 1992;31:83–173. doi: 10.1016/s0065-308x(08)60021-4. [DOI] [PubMed] [Google Scholar]
- 4.Gardner J P, Pinches R A, Roberts D J, Newbold C I. Proc Natl Acad Sci USA. 1996;93:3503–3508. doi: 10.1073/pnas.93.8.3503. [DOI] [PMC free article] [PubMed] [Google Scholar]
- 5.Garnham P C C. Malaria Parasites and other Haemosporidia. Oxford: Blackwell Scientific; 1966. [Google Scholar]
- 6.Silamut K, White N J. Trans R Soc Trop Med Hyg. 1993;87:436–443. doi: 10.1016/0035-9203(93)90028-o. [DOI] [PubMed] [Google Scholar]
- 7.Kitchen S F. In: Malariology. Boyd M F, editor. Philadelphia: Saunders; 1949. [Google Scholar]
- 8.Gravenor M B, McLean A R, Kwiatkowski D. Parasitology. 1995;110:115–122. doi: 10.1017/s0031182000063861. [DOI] [PubMed] [Google Scholar]
- 9.Efron B, Tibshirani R. Stat Sci. 1986;1:54–77. [Google Scholar]
- 10.Geary T G, Divo A A, Jensen J B. Am J Trop Med Hyg. 1989;40:240–244. doi: 10.4269/ajtmh.1989.40.240. [DOI] [PubMed] [Google Scholar]
- 11.Ter Kuile F, White N J, Holloway P, Pasvol G, Krishna S. Exp Parasitol. 1993;76:85–95. doi: 10.1006/expr.1993.1010. [DOI] [PubMed] [Google Scholar]
- 12.White N J, Chapman D, Watt G. Trans R Soc Trop Med Hyg. 1992;86:590–597. doi: 10.1016/0035-9203(92)90141-x. [DOI] [PubMed] [Google Scholar]
- 13.Anderson R M. Science. 1994;264:1884–1886. doi: 10.1126/science.8009218. [DOI] [PubMed] [Google Scholar]


