

Abstract
Tight-seal whole-cell patch-clamp experiments were carried out in order to investigate the effects of different holding potentials on the rate of development and amplitude of the Ca2+ release-activated Ca2+ current ICRAC in rat basophilic leukaemia (RBL-1) cells. ICRAC was monitored at −80 mV from fast voltage ramps, spanning 200 mV in 50 ms.
At hyperpolarised potentials, the macroscopic CRAC conductance was lower than that seen at depolarised potentials. The conductance increased almost 5-fold over the voltage range −60 to +40 mV and was seen when the stores were depleted either by the combination of IP3 and thapsigargin in high Ca2+ buffer, or passively with 10 mm EGTA or BAPTA.
The voltage-dependent conductance of the CRAC channels could not be fully accounted for by Ca2+-dependent fast inactivation, nor by other slower inhibitory mechanisms. It also did not seem to involve intracellular Mg2+ or the polycations spermine and spermidine.
Voltage step relaxation experiments revealed that the voltage-dependent conductance changes developed and reversed slowly, with a time constant of several seconds at −60 mV.
In the presence of physiological levels of intracellular Ca2+ buffers, ICRAC was barely detectable when cells were clamped at −60 mV and dialysed with IP3 and thapsigargin, but at 0 mV the current in low Ca2+ buffer was as large as that seen in high Ca2+ buffer.
Our results suggest that CRAC channels exhibit slow voltage-dependent conductance changes which can triple the current amplitude over the physiological range of voltages normally encountered by these cells. The role of this conductance change and possible underlying mechanisms are discussed.
In many cell types, the process of emptying the inositol 1,4,5-trisphosphate (IP3)-sensitive intracellular Ca2+ stores activates Ca2+ influx through the store-operated pathway (capacitative Ca2+ entry; Putney, 1986; Petersen et al. 1999). Whole-cell patch-clamp recordings have revealed that store-operated Ca2+ entry is electrogenic, being manifested as a Ca2+ current. The most widely distributed and best characterised store-operated Ca2+ current is ICRAC (Hoth & Penner, 1992; Parekh & Penner, 1997). Ca2+ entry through CRAC channels is required for refilling the Ca2+ stores, triggering exocytosis, activating certain transcription factors and stimulating cell proliferation (Parekh & Penner, 1997). Given the broad spectrum of kinetically distinct processes that are activated by Ca2+ entry through CRAC channels, one would anticipate that the activity of these channels should be extensively regulated. Indeed, several independent mechanisms have been found to curtail the activity of CRAC channels in RBL-1 (rat basophilic leukaemia) cells and Jurkat T-lymphocytes, two model systems for investigating ICRAC. These include Ca2+-dependent fast inactivation (operating over tens of milliseconds) arising through a negative feedback mechanism triggered by permeating Ca2+ ions (Zweifach & Lewis, 1995a; Fierro & Parekh, 1999a), Ca2+-dependent slow (tens of seconds) inactivation independent of store refilling but requiring a global increase in cytosolic Ca2+ (Zweifach & Lewis, 1995b; Parekh, 1998), slow inactivation by protein kinase C (Parekh & Penner, 1995), and inhibition by sphingolipids (Mathes et al. 1998).
It has generally been accepted that ICRAC can only be measured when high concentrations of Ca2+ buffers are included in the recording pipette. Recently, we have succeeded in recording robust ICRAC under conditions of weak intracellular Ca2+ buffering in RBL-1 cells (Fierro & Parekh, 2000). Macroscopic ICRAC develops in low Ca2+ buffer provided the sarco-endoplasmic reticulum Ca2+-ATPase (SERCA) pumps are blocked, for example with thapsigargin. Intracellular dialysis with a combination of IP3 and thapsigargin in low Ca2+ buffer activated ICRAC to a similar extent to that seen with high Ca2+ buffer. ICRAC can therefore be activated maximally under physiological conditions of weak Ca2+ buffering (Fierro & Parekh, 2000).
In the presence of low intracellular Ca2+ buffering, we have previously applied the capacitance technique to directly record exocytosis in RBL-1 cells (Artalejo et al. 1998). We found that secretion was both GTP and intracellular Ca2+ dependent. The combination of IP3 and thapsigargin (together with GTPγS) in low Ca2+ buffer was a very effective stimulus for triggering exocytosis in RBL-1 cells. However, we failed to detect any consistent macroscopic current under these conditions. In the light of our recent finding that large ICRAC can routinely be activated by IP3 and thapsigargin in low Ca2+ buffer (Fierro & Parekh, 2000), our inability to record ICRAC during the capacitance recordings is puzzling. The key difference between the two reports was that cells were clamped at −60 mV for the capacitance study (Artalejo et al. 1998), rather than the routinely used 0 mV (Fierro & Parekh, 2000). A holding potential of −60 mV was chosen simply to prevent the activation of the very large GTP-gated Na+ current, which would have contaminated the capacitance measurements. We therefore hypothesised that the amplitude of ICRAC is affected by the prevalent membrane potential in that hyperpolarisation somehow induces a voltage-dependent inhibition of channel activity. Clarification of this is important both for understanding the regulation of ICRAC and for placing its role in a physiological context, since most cell types that express ICRAC have quite hyperpolarised membrane potentials where the putative block would be most severe. In the present report, we have tested this hypothesis and our results suggest that CRAC channels exhibit voltage-dependent conductance changes.
METHODS
Rat basophilic leukaemia (RBL-1) cells were bought from the American Type Culture Collection. Cell culture was as previously described (Fierro & Parekh, 2000) and will not be elaborated here.
Patch-clamp experiments were conducted in the tight-seal whole-cell configuration at room temperature (20–25°C) as previously described (Hamill et al. 1981; Fierro & Parekh, 2000; Glitsch & Parekh, 2000). Sylgard-coated, fire-polished pipettes had DC resistances of 2.9–4 MΩ when filled with standard internal solution containing (mm): caesium glutamate 145, NaCl 8, MgCl2 1 and Hepes 10; pH 7.2 with CsOH. The Ca2+ chelators EGTA (Sigma) or BAPTA (tetracaesium salt, Molecular Probes) were added to this solution at the concentrations specified in the text. IP3 (added to the pipette solution) was obtained from Sigma. Thapsigargin was from Alomone Laboratories. All other chemicals were purchased from Sigma. A correction of +10 mV was applied for the subsequent liquid junction potential that arose from this glutamate-based internal solution. Extracellular solution contained (mm): NaCl 145, KCl 2.8, CaCl2 10, MgCl2 2, CsCl 10, glucose 10 and Hepes 10, pH 7.4 with NaOH. Voltage ramps (−100 to +100 mV in 50 ms) were applied at 0.5 Hz from different holding potentials (stated in the text) and ICRAC was measured at −80 mV from the ramps, as previously described (Fierro & Parekh, 2000; Glitsch & Parekh, 2000). Currents were filtered using an 8-pole Bessel filter at 2.9 kHz and digitised at 100 μs. ICRAC was normalised for cell size by dividing the amplitudes (measured from the voltage ramps at −80 mV) by the cell capacitance. Capacitative currents were compensated before each ramp using the automatic compensation of the EPC 9–2 amplifier. All leak currents were subtracted by averaging the first two to four ramp currents, and then subtracting this from all subsequent currents. Data are presented as means ±s.e.m., and statistical evaluation was carried out using Student's unpaired t test.
During the initial stages of this work, we clamped cells at different voltages and monitored the inward current that subsequently developed. However, this approach was problematic for two reasons. First, background current subtraction is not possible when the DC current is measured continuously at a fixed voltage and where ICRAC develops almost immediately upon break-in. Second, because ICRAC is a small current (10–60 pA, depending on the holding potential), small changes in the leak would lead to an error in estimating the true size of ICRAC. Such small changes in the leak would not be identifiable simply by observing the current at one set voltage. To circumvent these problems, we applied brief (50 ms) voltage ramps from −100 to +100 mV every 2 s from different holding potentials. Because ICRAC has certain hallmarks when ramps are applied (inward rectification, voltage-independent gating over the 50 ms time scale and a reversal potential (Vrev) > +50 mV (Parekh & Penner, 1997), we were able to leak subtract the records as well as detect sudden changes in leak current (Vrev shifting to less positive values and less inward rectification). Recordings contaminated with changes in leak were discarded.
RESULTS
Recording conditions
In the experiments described below, we attempted to minimise the contributions of the previously documented inhibitory mechanisms that operate on ICRAC, in order to examine the effect of membrane potential on ICRAC in relative isolation. To this end, we dialysed cells with the standard internal solution supplemented with a maximal concentration of IP3 (30 μm; Parekh et al. 1997), 10 mm EGTA/BAPTA and 2 μm thapsigargin. Under these conditions, ICRAC is activated maximally, no refilling of stores can occur, Ca2+-dependent slow inactivation is largely suppressed and kinase-mediated inactivation is prevented (see Discussion for relevant references).
The size of ICRAC depends on the holding potential
Figure 1Ai-iv shows the effects of different holding potentials (−80, −40, 0 and +40 mV) on the rate and extent of activation of ICRAC. Cells were clamped at the given potential (Vh) immediately upon break-in and then maintained at this potential. The development of ICRAC was monitored by applying fast voltage ramps (−100 to +100 mV in 50 ms) every 2 s. The upper panels of Fig. 1Ai-iv plot the amplitude of ICRAC (measured from the ramps at −80 mV and normalised to cell capacitance) against time after break-in at the different holding potentials. The corresponding I-V relationships are shown below. At negative holding potentials, the size of the current was considerably smaller than that seen at more depolarised potentials. Pooled data from several cells are summarised in Fig. 1Bi. Each point represents data from 5–35 cells. At potentials more negative than −60 mV, a lower limit of −0.8 pA pF−1 was obtained for the size of ICRAC; the current density increased as the holding potential became more positive, reaching an upper limit close to −4.2 pA pF−1 around +40 mV. ICRAC was most sensitive to the holding potential over the range −20 to +20 mV. The open circles in Fig. 1Bi represent recordings from cells dialysed with a similar pipette solution except that IP3 was omitted and Ca2+ was buffered at 120 nm (10 mm EGTA), in order to prevent passive depletion of the stores (Fierro & Parekh, 1999a). Under these conditions, no voltage-dependent currents were observed and the small linear leak (< −0.15 pA pF−1 at −80 mV) was constant.
Figure 1. Conductance of CRAC channels depends on the holding potential.
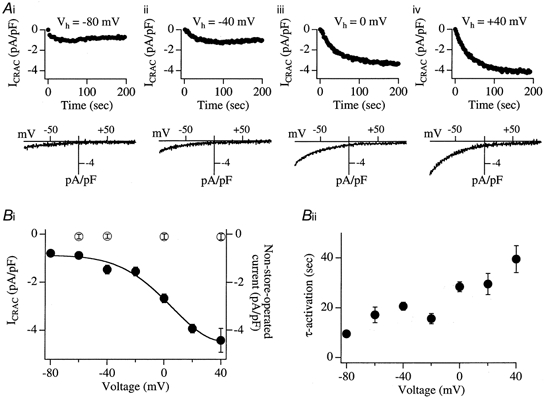
A, cells were clamped at the indicated holding potentials (Vh; −80 mV in i, −40 mV in ii, 0 mV in iii and +40 mV in iv). ICRAC was activated by dialysing cells with IP3 (30 μm), 10 mm EGTA and 2 μm thapsigargin and was monitored by applying fast voltage ramps (−100 to +100 mV in 50 ms at 0.5 Hz) superimposed on the holding potential. The amplitude of the current was always measured at −80 mV from the ramps. Upper panels plot the amplitude of ICRAC against time for each Vh (corresponding to different cells) and the lower panels show the I-V relationship obtained from the ramps. Bi, plot of the pooled data for ICRAC (•) from several cells for each Vh. Each point represents data from between 5 and 35 cells. The relationship between current amplitude and holding potential could be reasonably well fitted with a modified Boltzmann-type equation of the form: ICRAC (−80 mV) = 1/(1 + exp(V–V½)/S) where V½ is the voltage at which the current is one-half its maximal amplitude and S is the slope factor (RT/zF), where R, T and F have their usual meanings and z is the gating valency of the voltage-dependent step. For the pooled data, V½ was −3.1 mV and z was 1.9. This is a macroscopic empirical estimate of z and is only a very rough indication. All points were significantly different from that at 0 mV (P < 0.05). The size of the non-store-operated current as a function of different holding potentials, measured for up to 300 s is also shown (^). For these recordings, cells were dialysed with a solution lacking IP3 and Ca2+ was buffered at 120 nm (see text). Note that this current is constant, irrespective of the membrane potential, and very small. It would therefore not affect the voltage dependence of ICRAC (•). Bii, summary of the relationship between holding potential and the time constant of activation (τ-activation). There was a tendency for the current to activate more quickly as the holding potential became more negative. τ-activation at −80, −60, −40 and −20 mV was significantly different from that at 0 mV, whereas τ-activation at +20 and +40 mV was not.
Although ICRAC tended to be smaller at more negative potentials, it seemed to develop more quickly. Fitting the time course of ICRAC activation (at different holding potentials) with a mono-exponential function indicated that the time constant of activation increased with depolarisation (Fig. 1Bii), being approximately 3.5-fold slower when the holding potential was changed from −80 to +40 mV. Although this was a general pattern, there was nevertheless a lot of variability in the behaviour of individual cells in that some activated as quickly at positive potentials as others did at more hyperpolarised ones.
For clarity of narration, we shall refer to the effect of the holding potential as hyperpolarisation-induced inhibition (HII) of ICRAC. This arbitrary terminology does not indicate an underlying molecular mechanism.
Ca2+-dependent inactivation of ICRAC does not fully explain HII
The preceding results demonstrate that the amplitude of ICRAC (measured at −80 mV from brief voltage ramps) is reduced as the holding potential between ramps becomes more negative (up to −80 mV). Because we measured ICRAC at −80 mV (from the ramps), the electrical driving force for Ca2+ entry through CRAC channels is always the same ((−80 –ECa) mV, where ECa is the equilibrium potential for Ca2+), irrespective of the pre-ramp holding potential. Therefore the reduction in the size of ICRAC at negative holding potentials means that the whole-cell CRAC conductance has fallen. Negative holding potentials provide a favourable electrochemical gradient for Ca2+ influx and it is conceivable that the enhanced Ca2+ entry could inactivate CRAC channels through the well-documented process of Ca2+-dependent fast inactivation (Zweifach & Lewis, 1995a; Fierro & Parekh, 1999a). Ca2+-dependent fast inactivation arises from the build-up of a microdomain of Ca2+ in the vicinity of each open CRAC channel and this subsequently reduces channel activity with time constants of around 10 and 100 ms. Ca2+-dependent fast inactivation is little affected by the slow chelator EGTA, but can be attenuated by the faster Ca2+ chelator BAPTA. Reducing the amount of Ca2+ influx through each CRAC channel (by lowering external Ca2+ concentration, for example) can also reduce the extent of Ca2+-dependent fast inactivation. The contribution of Ca2+-dependent fast inactivation to HII was examined and the results are shown in Fig. 2. The left-hand and middle panels in Fig. 2A depict the time course of activation and the steady-state amplitude of ICRAC from two different holding potentials (0 and −60 mV) for cells dialysed with either IP3 and 10 mm EGTA (0 mV, n = 35; −60 mV, n = 16) or IP3 and 10 mm BAPTA (0 mV, n = 5; −60 mV, n = 8). Thapsigargin (2 μm) was present in both solutions. In spite of dialysis with the faster chelator BAPTA, the current from the holding potential of −60 mV was significantly reduced compared with that at 0 mV. The right-hand panel of Fig. 2A plots the amplitude of ICRAC versus the time constant of activation for the different Ca2+ chelators at the different holding potentials. The amplitude of ICRAC at −60 mV in BAPTA-dialysed cells (point A4) was significantly larger than the corresponding value for EGTA (A2, P < 0.05), whereas the corresponding amplitudes at 0 mV were not significantly different. This indicates that BAPTA reduces the extent of HII, albeit modestly.
Figure 2. Reduction in the extent of fast Ca2+-dependent inactivation does not prevent HII of ICRAC.
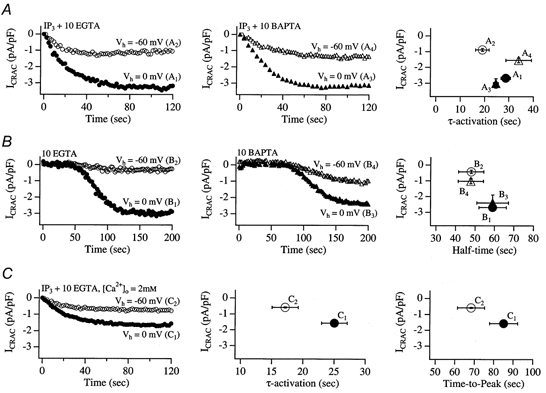
In A, the rate and extent of activation of ICRAC at 0 and −60 mV holding potentials with IP3+ EGTA + thapsigargin in the pipette are compared with those seen with IP3+ BAPTA + thapsigargin. Both chelators were used at 10 mm. A1 refers to IP3+ 10 mm EGTA + thapsigargin at a Vh of 0 mV, A2 to IP3+ 10 mm EGTA + thapsigargin at a Vh of −60 mV, A3 to IP3+ 10 mm BAPTA + thapsigargin at a Vh of 0 mV and A4 to IP3+ 10 mm BAPTA + thapsigargin at a Vh of −60 mV. Each trace is from a different cell. Pooled data are summarised in the right-hand panel, which plots current amplitude against τ-activation. Each point represents data from 5–9 cells. In B, ICRAC was activated passively following dialysis with 10 mm EGTA or BAPTA at the indicated holding potentials. IP3 was not present in the patch pipette. Point B1 here refers to 10 mm EGTA at a Vh of 0 mV, B2 to 10 mm EGTA at a Vh of −60 mV, B3 to 10 mm BAPTA at a Vh of 0 mV and B4 to 10 mm BAPTA at a Vh of −60 mV. The right-hand panel plots the amplitude of ICRAC against half-time to peak (time at which ICRAC had reached half its steady-state amplitude) and this has been corrected for the delay before the current started to develop (typically around 70 s). In C, ICRAC was activated by dialysing cells with IP3 and 10 mm EGTA + thapsigargin under conditions where extracellular Ca2+ was reduced from 10 to 2 mm. Point C1 refers to a Vh of 0 mV and C2 to a Vh of −60 mV.
We found that the time course of activation was slightly faster at −60 mV compared with 0 mV when EGTA was the chelator (P < 0.05; compare A1 and A2 in Fig. 2A), whereas this was not the case with BAPTA (A3vs. A4). Comparing EGTA with BAPTA data at −60 mV, the respective time courses of activation were slightly different (19.0 ± 2.8 s, n = 16 and 33.9 ± 5.3 s, n = 8). Although this difference was significant (P < 0.05), the variability in BAPTA-dialysed cells was quite large and four cells activated at a rate indistinguishable from that seen in EGTA.
Because ICRAC starts to activate within 3 s of breaking into the cell and develops with a time constant of 12–20 s at negative holding potentials (Fig. 1Bii), we were concerned that an insufficient amount of free chelator would have diffused into the cell during the time that ICRAC developed. Furthermore, the chelator would probably be saturated because of the substantial Ca2+ release triggered by IP3. With our typical series resistance of 7 MΩ and a cell capacitance of 18 pF, we calculate time constants of equilibration of 270 and 373 s for EGTA and BAPTA, respectively (Pusch & Neher, 1988). Hence cytoplasmic Ca2+ will be buffered only weakly as ICRAC activates. We therefore sought an approach that would enable us to effectively load the cytoplasm with exogenous chelator before ICRAC activated. Passive depletion of stores by dialysis with high concentrations of chelator, which we have previously characterised in detail (Fierro & Parekh, 1999b), is ideal for this because ICRAC starts around 70 s after the onset of whole-cell recording, develops slowly (100–120 s to peak), and stores are depleted without any rise in cytoplasmic Ca2+. We therefore compared the amplitude of ICRAC at −60 and 0 mV holding potentials, following passive depletion of stores with 10 mm EGTA (left-hand panel of Fig. 2B; 0 mV, n = 11; −60 mV, n = 7) or BAPTA (middle panel of Fig. 2B; 0 mV, n = 7; −60 mV, n = 6). The right-hand panel of Fig. 2B plots the amplitude of ICRAC at −60 or 0 mV holding potential against half-time to peak for both EGTA and BAPTA. As for the experiments using IP3, the amplitude of ICRAC at −60 mV was significantly larger with BAPTA than EGTA (P < 0.05). Nevertheless, for both treatments ICRAC was still substantially smaller when cells were held at −60 mV compared with 0 mV.
We then examined whether a reduction in the extent of Ca2+ entry could reduce the difference in ICRAC amplitude at −60 vs. 0 mV holding potential. We therefore lowered the external Ca2+ concentration to 2 mm, slightly above the apparent KD of the CRAC channel for Ca2+ in RBL cells (Fierro & Parekh, 2000). The results are summarised in Fig. 2C. The current was evoked by dialysing cells with IP3 and 10 mm EGTA together with thapsigargin. Application of voltage ramps revealed that ICRAC (measured at −80 mV from the ramps) was still more than twice as large in cells held at 0 mV (n = 6) than in those held at −60 mV (n = 6). Note that C1 and C2 in the right-hand panel of Fig. 2C are around 50% the amplitude of A1 and A2 in Fig. 2A, the latter being recorded in 10 mm Ca2+. Despite this reduction in current amplitude, the ratios of the currents at 0 mV (C1/A1) and −60 mV (C2/A2) were similar, indicating that the voltage dependence of ICRAC was not suppressed by reducing the extent of Ca2+ entry.
Taken together, these results indicate that Ca2+-dependent fast inactivation alone cannot account for the HII of ICRAC. Further evidence against Ca2+-dependent inactivation is described below (Fig. 4 and Discussion).
Figure 4. Voltage step relaxation studies reveal that the development of, and recovery from, HII is slow.
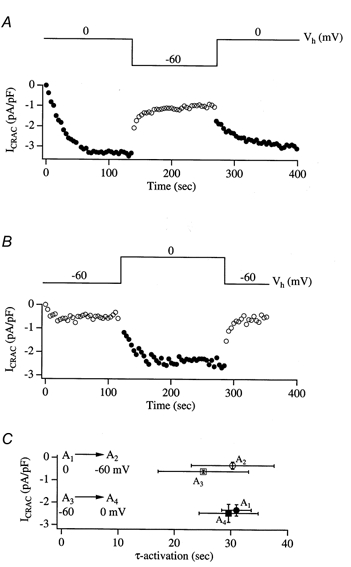
A, a cell was dialysed with IP3+ 10 mm EGTA + thapsigargin and held at 0 mV. Once ICRAC had reached steady state (•), the potential was changed to −60 mV. ICRAC then decayed slowly to reach a new steady-state (^). Stepping back to 0 mV resulted in a mono-exponential increase in the current (•) which almost reached the level it had prior to pulsing to −60 mV. B, similar experiment to A in a different cell which was initially held at −60 mV (^) and then stepped to 0 mV (•). In C, the amplitude of ICRAC is plotted against the activation time constant corresponding to each change in membrane potential. A1 represents the size of the current and τ-activation when cells were held at 0 mV upon break-in. A2 refers to the change in A1 upon stepping to −60 mV. A3 reflects the amplitude of ICRAC and τ-activation when cells were held at −60 mV upon break-in and A4 is the subsequent change when these cells were then stepped to 0 mV. Note that A1 and A4 are virtually identical, and A2 and A3 are not significantly different, indicating that the changes in ICRAC following each voltage relaxation do not seem to depend on the preceding state. Voltage relaxation experiments in the absence of store depletion (dialysis with an internal solution without IP3 and in which Ca2+ was strongly buffered at 120 nm to prevent passive store emptying) failed to generate slowly developing currents on stepping from 0 to −60 mV and vice versa. Instead, there was an instantaneous change in the current amplitude (< 10 pA). It is unlikely therefore that there was a major contribution from other conductances, including Na+-Ca2+ exchange, to the voltage relaxation experiments.
HII of ICRAC does not reflect voltage-dependent block by intracellular Mg2+ or polycationic bases
Intracellular Mg2+ induces a voltage-dependent block of inwardly rectifying K+ channels and this contributes to the rectification (Matsuda et al. 1987). We entertained the possibility that Mg2+ might plug CRAC channels from the inside at hyperpolarised potentials, reducing channel conductance. To test this, we examined the effect of different intracellular Mg2+ concentrations on the rate and extent of activation of ICRAC at 0 and −60 mV. Cells were dialysed with internal solution containing IP3, thapsigargin and 10 mm EGTA and either 4 mm Mg2+ (0 mV, n = 3; −60 mV, n = 4) or 10 μm Mg2+ (buffered with 2 mm EDTA; 0 mV, n = 4; −60 mV, n = 7). The results were compared with those from cells dialysed with internal solution containing IP3, thapsigargin and standard Mg2+ (1 mm; 0 mV, n = 5; −60 mV, n = 8). The left-hand panel of Fig. 3A compares the time course and extent of ICRAC activation at −60 and 0 mV for 0 versus 4 mm internal Mg2+. Reducing or elevating internal Mg2+ concentration did not alter the amplitude of ICRAC at −60 or 0 mV, nor did it affect the time constant of activation at either voltage, when compared with standard 1 mm Mg2+ (middle and right-hand panels of Fig. 3A).
Figure 3. HII of CRAC channels is not mediated by cytoplasmic Mg2+ or polycations.
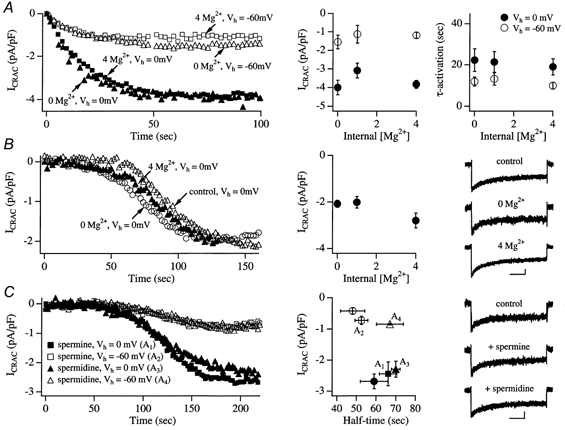
A, cells were dialysed with IP3+ 10 mm EGTA + thapsigargin and the indicated concentrations of Mg2+. 0 Mg2+ refers to a pipette solution in which Mg2+ was omitted and 2 mm EDTA was added together with 10 mm EGTA. The left-hand panel shows examples of recordings from cells dialysed with 0 or 4 mm Mg2+ at a holding potential of either 0 mV (filled symbols) or −60 mV (corresponding open symbols). The middle and right-hand panels show how the amplitude of ICRAC and activation time constant are related to internal Mg2+ concentration. B shows the effects of the different Mg2+ concentrations on the properties of ICRAC when the latter was evoked by passive depletion of stores (10 mm EGTA). The left-hand panel depicts data from 3 cells dialysed with 0, 1 (control) or 4 mm Mg2+ at a holding potential of 0 mV and the middle panel shows the relationship between Mg2+ concentration and current size following passive store depletion. Each point represents data from 3–6 cells. The right-hand panel shows that fast Ca2+-dependent inactivation is not affected by changes in intracellular Mg2+ levels. Cells were held at 0 mV and then stepped to −80 mV for 250 s. Scale bars refer to 50 ms and −0.5 pA pF−1. In C, ICRAC was activated following dialysis with 10 mm EGTA and 2 mm spermine or spermidine and cells were clamped at either 0 or −60 mV. The left-hand panel depicts examples of the development of ICRAC in the presence of spermine (at either 0 (A1) or −60 mV (A2)) and spermidine (A3 at 0 and A4 at −60 mV). Data from 2 different cells are shown for each voltage. The middle graph plots the amplitude of ICRAC against half-time (time at which ICRAC had reached half its steady-state amplitude) for the different conditions. Filled circles represent the control (no polycation) at 0 mV and open circles correspond to the control at −60 mV. The right-hand panel shows that fast inactivation of ICRAC is largely unaffected by the polycations compared with control upon pulsing to −80 mV. Scale bars as in B.
Because the effects of Mg2+ on Ca2+-dependent fast inactivation of ICRAC are not known, we also examined whether intracellular Mg2+ affected this inactivation. We repeated the above experiments, but depleted stores passively with 10 mm EGTA instead. This was because we wanted to ensure that cytosolic Mg2+ concentration was reasonably similar to pipette Mg2+ concentration as ICRAC started to develop. Consistent with the results of Fig. 3A where IP3 was used, the amplitude of ICRAC was not affected by different Mg2+ concentrations (Fig. 3B, middle panel, points represent data from 3–6 cells). The right-hand panel of Fig. 3B shows that ICRAC inactivated to similar extents when 250 ms hyperpolarising steps to −80 mV were applied from a holding potential of 0 mV. The extent of inactivation was 47.3 ± 3% for control, 54.0 ± 3% for 0 Mg2+ and 46.7 ± 5% for 4 mm Mg2+. Hence cytoplasmic Mg2+ does not seem to alter fast inactivation.
Intracellular polycationic bases like spermine and spermidine exert voltage-dependent block of several ionic channels including the inwardly rectifying K+ channels (Ficker et al. 1994; Lopatin et al. 1994) and voltage-dependent Ca2+ channels (Scott et al. 1993). The effects of these polycations on ICRAC have not been reported. We dialysed cells with either 2 mm spermine or 1.5 mm spermidine under conditions where ICRAC was activated by passive store depletion and compared the properties of the current at 0 and −60 mV. Typical recordings are shown in the left-hand panel of Fig. 3C. The development of ICRAC as well as its steady-state amplitude at either voltage were not affected by the polycations, demonstrating that polyamines did not have a clear effect on HII. The middle panel of Fig. 3C (points represent data from 4–11 cells) plots the amplitude of ICRAC against the half-time to peak, corrected for delay. Neither parameter was significantly affected by spermine or spermidine when compared with control recordings (filled and open circles, reflecting 0 mV (n = 11) and −60 mV (n = 7), respectively) obtained in the absence of the polycations. We also examined the effects of spermine and spermidine on Ca2+-dependent fast inactivation (250 ms hyperpolarising steps to −80 mV from 0 mV holding potential). As shown in the right-hand panel of Fig. 3C, this inactivation was not altered by inclusion of the polycations (percentage inactivation was 40.0 ± 3, 34.3 ± 3 and 44.1 ± 2% for control, spermine and spermidine).
Voltage jump relaxations reveal that HII of ICRAC is reversible
Figure 4 describes experiments in which we activated ICRAC at one holding potential and then changed this potential to examine the rate and extent of relaxation to the new steady state. In Fig. 4A, the cell was initially held at 0 mV and ICRAC was evoked by dialysing the cell with IP3, 10 mm EGTA and thapsigargin. The current activated with a time constant of 22 s before reaching a plateau. We then changed the holding potential to −60 mV. ICRAC decayed mono-exponentially with a time constant of around 30 s to the new steady-state level. On stepping back to 0 mV, ICRAC increased mono-exponentially (time constant, 28 s) to attain almost the same amplitude it had reached prior to stepping to −60 mV. Figure 4B shows another recording from a different cell in which the pulse protocol was inverted compared with Fig. 4A. ICRAC increased upon stepping to 0 mV and then relaxed mono-exponentially on stepping back to −60 mV. Pooled data from several cells are summarised in Fig. 4C, which plots the amplitude of ICRAC at each potential against the time constant that led to this amplitude. Cells initially held at 0 mV are called A1 (n = 5); the time constant of A1 refers to the activation time constant of the current. These cells were then stepped to −60 mV. The amplitude and time constant of ICRAC during this voltage relaxation are indicated by point A2. Other cells were initially clamped at −60 mV (A3; n = 5) and then stepped to 0 mV (A4). Strikingly, the amplitudes and time constants of ICRAC at −60 mV were very similar irrespective of whether the cell was initially held at −60 mV or stepped to this potential after being clamped at 0 mV. Similarly, the amplitudes and time constants at 0 mV were almost identical whether the cell had been held at 0 mV from the outset of whole-cell recording or stepped to 0 mV from −60 mV. This indicates that the CRAC channels respond to voltage relaxation jumps in a manner that is not influenced by the preceding state. No detectable hysteresis was present in the system. We repeated the voltage step relaxation experiments, but this time dialysed the cells with 10 mm BAPTA instead of EGTA. On stepping to −60 mV from a holding potential of 0 mV (once ICRAC had reached a stable level of −2.86 ± 0.21 pA pF−1, n = 5), ICRAC relaxed with a time constant of 4.94 ± 0.8 s to reach a new steady-state amplitude that was 55.4 ± 4.7% of that at 0 mV. This time constant was significantly different from that seen with EGTA (P < 0.05).
The amplitude of macroscopic ICRAC in low Ca2+ buffer is reduced at hyperpolarised potentials
Recently we have discovered that ICRAC can be measured in the presence of physiological intracellular Ca2+ buffer provided SERCA pumps are blocked (Fierro & Parekh, 2000). We therefore compared the size of ICRAC at a holding potential of −60 mV with that at 0 mV following dialysis with IP3 and thapsigargin in low Ca2+ buffer (0.1 mm EGTA). As stated in the Introduction, −60 mV was chosen to mimic the conditions of Artalejo et al. 1998. Whereas we were able to detect ICRAC consistently at a holding potential of 0 mV (7 of 7 cells), results at −60 mV were more variable (Figure. 5). In 3 of 8 cells we failed to detect any ICRAC at all and in those where we did see the current it was quite small (−0.54 ± 0.14 pA pF−1; 5 cells). Holding cells at −60 mV therefore reduces the probability of recording ICRAC and, if the current is detectable, it has a much smaller amplitude when compared with that at 0 mV.
Figure 5. ICRAC in low intracellular Ca2+ buffer is very small at a holding potential of −60 mV.
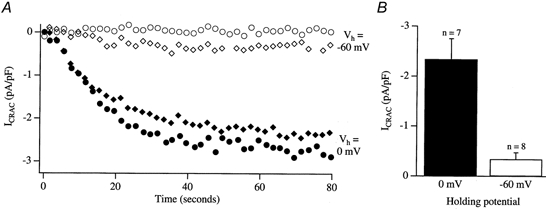
A shows the time course of ICRAC for 2 cells held at 0 mV (filled symbols) and for 2 different cells held at −60 mV (open symbols). Internal solution contained IP3+ 0.1 mm EGTA + 2 μm thapsigargin. Note that one of the cells held at −60 mV did not generate ICRAC at all. In B, the amplitude histogram compares the size of ICRAC in low Ca2+ buffer for the 2 different holding potentials. At a Vh of 0 mV, ICRAC was around 5-fold larger than at a Vh of −60 mV.
DISCUSSION
Our results provide new insight into the behaviour of store-operated CRAC channels. Whole-cell CRAC conductance appears to be, directly or indirectly, voltage dependent in that hyperpolarising potentials reduce channel activity. This is somewhat unexpected because one of the hallmarks of ICRAC is its voltage-independent gating, as evinced by a weak inward rectification during fast voltage ramps (−100 to +100 mV in 50 ms). We believe that the voltage-dependent behaviour which we have described here has been overlooked in previous reports by us and others both because a holding potential of 0 mV has usually been employed and because the voltage-dependent inhibition develops slowly. A holding potential of 0 mV for ICRAC recordings is chosen for two main reasons. First, Ca2+ entry between ramps is rather small at 0 mV (< −0.5 pA pF−1) and therefore the exogenous Ca2+ buffer (usually several millimolar) can maintain cytosolic Ca2+ concentration at a low level. This will prevent Ca2+-dependent slow inactivation as well as store refilling, both of which would curtail CRAC channel activity. Second, at 0 mV, Ca2+-dependent fast inactivation does not occur (Fierro & Parekh, 1999a) and therefore whole-cell CRAC conductance is high. Because the ramps are of only 50 ms duration whereas HII of ICRAC develops with a time constant of several seconds at −60 mV depending on the Ca2+ chelator, the latter would not be seen in the I-V relationship obtained from ramps.
Is ICRAC the only current recorded under our conditions?
Because we have employed different holding potentials, it is possible that other currents, in addition to ICRAC, contribute to the size of the whole-cell current we have recorded. However, we do not think our recordings were contaminated to any significant extent by other currents for the following reasons. First, irrespective of the holding potential, the I-V relationship and reversal potential were the same and clearly reflected ICRAC (inward rectification, voltage independent and Vrev > +50 mV). If other currents had come into play then one would have expected the I-V relationship and Vrev to change. Second, we have carried out experiments under identical conditions except stores were not depleted. No voltage-dependent currents were observed (open circles in Fig. 1Bi). Hence the voltage dependence we describe reflects properties of ICRAC rather than a contribution from another current.
Previously described inactivation mechanisms cannot adequately account for HII of ICRAC
Ca2+-dependent fast inactivation of CRAC channels, reflecting the build-up of a microdomain of high Ca2+ in the vicinity of each open channel, is prominent at potentials > −60 mV and is therefore a prime candidate for the HII of ICRAC (Zweifach & Lewis, 1995a; Fierro & Parekh, 1999a) However, there are several arguments against this. First, fast inactivation (in the presence of EGTA) in RBL-1 cells develops with a double-exponential time course (τ1 of 10 ms and τ2 of 120 ms) and recovers with time constants of 34 and 233 ms. With BAPTA, the corresponding time constants are 9 and 250 ms (Fierro & Parekh, 1999a). However, the voltage-dependent relaxation studies of Fig. 4 demonstrate that HII of ICRAC takes place with a time constant of around 30 s with EGTA and 5 s with BAPTA. The collapse of Ca2+ microdomains (which would occur on stepping back to 0 mV from −60 mV) proceeds on a sub-millisecond time scale (Neher, 1998), several orders of magnitude faster than the voltage relaxation time course. Second, fast inactivation is substantially reduced at −60 mV when BAPTA is used instead of EGTA in the pipette solution (Fierro & Parekh, 1999a). However, the results of Fig. 2B indicate that HII of ICRAC at −60 mV is still prominent in the presence of BAPTA. Third, fast inactivation is virtually absent at < −20 mV. However, the amplitude of ICRAC increases continuously from −20 to +40 mV, even though fast inactivation would not be involved over this range.
Although ICRAC was slightly larger at hyperpolarised potentials under conditions where fast inactivation was reduced, and the time course of the voltage step relaxations was faster with BAPTA than EGTA, it is nevertheless clear that fast inactivation alone cannot account for the inhibition at negative potentials.
In addition to fast inactivation, other mechanisms can inhibit ICRAC over a time frame of tens of seconds. These are mediated by protein kinase C (Parekh & Penner, 1995), a Ca2+-dependent slow inactivation (Zweifach & Lewis, 1995b; Parekh, 1998) and Ca2+-dependent store refilling (Zweifach & Lewis, 1995b; D. Bakowski & A. B. Parekh, manuscript in preparation). We do not think that any of these mechanisms plays a significant role here because we have taken precautions to minimise their effectiveness. ATP was omitted from the pipette solution (a manoeuvre that suppresses kinase inactivation; Parekh & Penner, 1995), Ca2+ was strongly buffered with 10 mm EGTA or BAPTA (attenuating slow inactivation; Zweifach & Lewis, 1995b; Parekh, 1998) and store refilling was prevented by the inclusion of thapsigargin in the pipette solution at a concentration which routinely activates ICRAC on its own (indicating effective SERCA pump inhibition; Fierro & Parekh, 2000). Hence HII of ICRAC cannot be fully accommodated into the well-characterised mechanisms already known to reduce CRAC channel activity in RBL-1 cells.
Mechanism of HII of ICRAC
The mechanism whereby sustained hyperpolarisation reduces CRAC channel conductance is not clear. Unlike inwardly rectifying K+ channels and NMDA receptors, it does not seem to involve voltage-dependent block by cytoplasmic Mg2+ or polycations such as spermine and spermidine. Because the inhibition could be repetitively evoked in whole-cell voltage relaxation experiments over a time course of several hundred seconds, it is unlikely to involve a small diffusible factor since one would expect such a molecule to be effectively washed out of the cell into the recording pipette.
One possibility is that HII of ICRAC reflects voltage-dependent binding (at hyperpolarised potentials) and unbinding (at depolarised potentials) of a relatively large molecule such as a protein. One potential candidate is the IP3 receptor spanning the Ca2+ store membrane. It has been suggested that this receptor physically links to the store-operated Ca2+ channel (Berridge, 1995; Kiselyov et al. 1998; Paterson et al. 1999; see Putney, 1999, for review). Because the IP3 receptor has a large amino terminal cytoplasmic head with many polar residues, our results could be explained by a voltage-dependent interaction between the IP3 receptor and CRAC channels. In this scenario, hyperpolarisation would favour dissociation of the protein-protein complex, whereas depolarisation would stabilise it. Such binding and unbinding would have to be rather slow to account for a time constant of around 30 s. Binding/unbinding would also have to be Ca2+ dependent because the kinetics are accelerated by BAPTA. Alternatively, the inhibition at negative potentials could represent an intrinsic property of the CRAC channels themselves. In this scheme, hyperpolarisation would presumably inactivate the channels rather than deactivate them because mean closed time is shorter at hyperpolarised than at depolarised potentials for single CRAC channels with Na+ as the charge carrier (Kerschbaum & Cahalan, 1999). However, 45 s hyperpolarising pulses to −80 mV from 0 mV did not reveal any inactivation other than the well-described biphasic inactivation time course of CRAC (data not shown). Because certain enzymes in the plasma membrane are voltage dependent (e.g. adenylate cyclase in cerebellar neurons; Reddy et al. 1995), it is possible that changes in membrane potential alter the activity of such enzymes, resulting in a biochemical cascade that culminates in the modification of CRAC channel conductance.
The amplitude of ICRAC depends on the holding potential despite maximal store emptying
Although we dialysed cells with a combination of agents that would rapidly empty the IP3-sensitive Ca2+ stores and keep them empty (IP3+ 10 mm EGTA/BAPTA + thapsigargin), we nevertheless obtained a range of ICRAC amplitudes depending on the holding potential. ICRAC amplitude at −60 mV was almost three times less than at 0 mV. The extent of the current was clearly graded with the holding potential. However, this does not reflect graded depletion of stores since the latter were essentially empty. Hence sub-maximal ICRAC can be seen under conditions where stores are depleted, and this seems to arise from the voltage-dependent conductance changes in the macroscopic CRAC conductance. HII of ICRAC may therefore be a powerful way to grade the extent of Ca2+ entry through CRAC channels, even following maximal store emptying.
Since macroscopic CRAC conductance appears to be voltage dependent, investigating the relationship between the amount of Ca2+ released from the stores and subsequent Ca2+ influx in non-voltage-clamped cells becomes complex. Without knowing the value of the membrane potential or how it changes with time, one cannot rule out the possibility that HII of ICRAC exaggerates/masks the extent of Ca2+ influx depending on where the membrane potential actually is. In addition, changes in membrane potential will alter the extent of Ca2+ influx simply by changing the electrical driving force for Ca2+ entry. Hence the conclusions from such experiments may be somewhat limited (Sedova et al. 2000).
Physiological implications of HII of ICRAC
Most RBL-1 cells have a resting potential of around −90 mV (Fierro & Parekh, 1999a), a value sufficiently negative to ensure that a substantial fraction of the CRAC channels are affected by HII. At rest it would appear therefore that HII is a major inhibitory mechanism that reduces macroscopic CRAC activity. Current-clamp recordings have revealed that stimulation of FCεRI receptors with antigen does not seem to change the membrane potential (Fernandez & Lindau, 1986; Fierro & Parekh, 1999a), which may be explained by the observation that antigen receptor stimulation activates inwardly rectifying K+ channels which would clamp the resting potential close to EK (Gericke et al. 1995). HII of ICRAC would therefore remain effective and the macroscopic CRAC conductance would be kept at a low level. On the other hand, stimulation of P2y purinoceptors on RBL cells with ATP activates large conductance non-selective cation channels which would shift the membrane potential towards 0 mV (Obukhov et al. 1995). Such a depolarisation would reduce the effects of HII and thereby increase the whole-cell CRAC conductance around 3-fold. In current-clamped RBL cells, relatively large fluctuations in the membrane potential have been observed following application of thapsigargin (Mason et al. 1999), and this seems to reflect an interaction between inwardly rectifying K+ channels and the store-operated Ca2+ current. These depolarisations were large, and could reach −17 mV, a potential where HII is occurring. Hence stimulation of distinct cell-surface receptors may evoke different patterns of intracellular Ca2+ signalling depending on an interplay between their ability to change the membrane potential and hence macroscopic CRAC conductance and the subsequent electrical driving force for Ca2+ entry.
The impact of HII in low Ca2+ buffer is particularly high. At −60 mV holding potential, and in agreement with a previous report (Artalejo et al. 1998), we often failed to detect any macroscopic ICRAC at all and, if present, the current was significantly smaller than that seen at 0 mV holding potential. These experiments were carried out in 10 mm external Ca2+, to increase the size of the current. In 2 mm Ca2+, ICRAC is around 60% the size of that in 10 mm Ca2+ (Fierro & Parekh, 2000). This means that under physiological conditions of low intracellular Ca2+ buffer, a strongly hyperpolarised membrane potential and 2 mm external Ca2+, ICRAC will be virtually undetectable (< 0.27 pA pF−1). Both HII and Ca2+-dependent slow inactivation can account for the dramatic reduction in ICRAC at −60 mV. Although we are currently unable to accurately estimate the contribution of each mechanism, a rough indication is that the two contribute equally because in high Ca2+ buffer ICRAC is reduced around 3-fold at −60 mV (compared with at 0 mV holding potential) whereas in low Ca2+ buffer this is approximately 6-fold.
The fact that ICRAC can barely be resolved in low Ca2+ buffer at a holding potential of −60 mV in the whole-cell configuration should not be taken to indicate that the current is of little physiological relevance. For an RBL-1 cell of 15 pF capacitance, we calculate that just a −2 pA whole-cell ICRAC will raise cytosolic Ca2+ concentration at the sizeable rate of 50 nm s−1 (taking accessible cell volume as 50% and a cytosolic Ca2+ binding ratio of 75; Neher, 1995).
Since ICRAC is around 6-fold larger at 0 mV than at −60 mV in the presence of physiological intracellular Ca2+ buffer, maximal activation of the current may be accomplished through rhythmic oscillations in membrane potential. A strong hyperpolarisation would initially result in a large ICRAC (due to the increased electrical driving force for Ca2+ entry) but this would subsequently decline due to both Ca2+-dependent inactivation and HII. A modest depolarisation would increase the conductance of CRAC channels and this would tend to offset the fall in driving force, thereby maintaining Ca2+ entry. A subsequent hyperpolarisation would now result in more Ca2+ influx before HII developed further. In this way, rhythmic depolarisations and hyperpolarisations would be more effective in sustaining Ca2+ entry through CRAC channels than maintaining the membrane potential at a large hyperpolarised level. The membrane potential in most non-excitable cells can fluctuate between EK (set by inward rectifiers and Ca2+-dependent K+ channels) and 0 mV (Ca2+-activated non-selective cation channels). Oscillations in membrane potential in this range would impact upon the extent of HII. Our results may also help explain one puzzling paradox in the calcium signalling field. It is thought that the proteins encoded by certain members of the Trp family of genes underlie store-operated Ca2+ channels (Zhu & Birnbaumer, 1998). However, Trp proteins are expressed in high levels in excitable cells where ICRAC has not been reported. Although ICRAC might not involve a Trp product, it is nevertheless tempting to speculate that the inability to record ICRAC in neurons (and most other excitable cells, but see Fomina & Nowycky, 1999) stems from the fact that the cells have to be clamped at very negative potentials in order to prevent activation of voltage-dependent Ca2+ as well as other channels. At such negative potentials, HII of ICRAC will be pronounced and this, coupled with Ca2+-dependent slow inactivation, may suppress the activation of ICRAC. In this scenario, ICRAC is indeed present in neurons but is simply not detectable at hyperpolarised potentials.
The Ca2+ current through single CRAC channels is too small to be resolved. Although our macroscopic measurements provide only limited insight into channel behaviour at a microscopic level, it is instructive nevertheless to consider potential gating schemes. One such scheme is depicted below (Scheme 1).
Scheme 1.
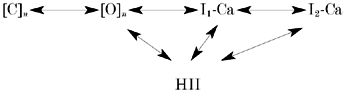
In this model, open CRAC channels (representing an unknown number (n) of open states) can enter the rapid Ca2+-inactivated states (I1-Ca and I2-Ca, representing the biphasic recovery from fast inactivation; Fierro & Parekh, 1999a) or HII. For simplicity, we have not included slow Ca2+-dependent or kinase-mediated inactivation processes. Because HII occurs even under conditions in which I1-Ca and I2-Ca are reduced, we think open channels can enter HII directly and not necessarily via one of the other inactivated states. It is striking that the time constant for development of HII (τHII) is around 28 s at −60 mV, a value only slightly larger than that for activation of ICRAC (τact) at a similar voltage (18 s). If τHII >> τact, then HII would contribute little to the development/extent of activation of ICRAC over the time scale of most receptor-evoked Ca2+ signals. If τHII << τact, HII would act simply as a DC offset. The fact that τHII≈τact indicates that HII can alter the extent of ICRAC even as it develops. In this regard, HII will be ideally primed to dynamically modulate the pattern of Ca2+ entry at all stages of current development.
Experiments are now being designed to delineate the molecular mechanisms underlying HII and to investigate whether it is a general feature of CRAC channels or restricted to RBL cells.
Acknowledgments
D.B. is a British Heart Foundation Prize Student. A.B.P. is a Wellcome Trust Career Development Fellow and holds the Amersham Fellowship in Medical Cell Biology at Keble College, Oxford. We are grateful to Professors Alison Brading (Oxford) and Criss Hartzell (Atlanta) for critical comments on the work, Vicky Pank for preparing the cells and B. Bagel for technical support.
References
- Artalejo AR, Ellory JC, Parekh AB. Ca2+-dependent capacitance increases in rat basophilic leukaemia cells following activation of store-operated Ca2+ entry and dialysis with high Ca2+-containing intracellular solution. Pflügers Archiv. 1998;436:934–939. doi: 10.1007/pl00008088. [DOI] [PubMed] [Google Scholar]
- Berridge MJ. Capacitative Ca2+ entry. Biochemical Journal. 1995;312:1–11. doi: 10.1042/bj3120001. [DOI] [PMC free article] [PubMed] [Google Scholar]
- Fernandez J, Lindau M. A patch-clamp study of histamine-secreting cells. Journal of General Physiology. 1986;88:349–368. doi: 10.1085/jgp.88.3.349. [DOI] [PMC free article] [PubMed] [Google Scholar]
- Ficker E, Taglialatela M, Wible MA, Henley CM, Brown AM. Spermine and spermidine as gating molecules for inward rectifier K+ channels. Science. 1994;266:1068–1072. doi: 10.1126/science.7973666. [DOI] [PubMed] [Google Scholar]
- Fierro L, Parekh AB. Fast calcium-dependent inactivation of calcium release-activated calcium current (CRAC) in Rbl-1 cells. Journal of Membrane Biology. 1999a;168:9–17. doi: 10.1007/s002329900493. [DOI] [PubMed] [Google Scholar]
- Fierro L, Parekh AB. On the characterisation of the mechanism underlying passive activation of the Ca2+ release-activated Ca2+ current ICRAC in rat basophilic leukaemia cells. Journal of Physiology. 1999b;520:407–416. doi: 10.1111/j.1469-7793.1999.00407.x. [DOI] [PMC free article] [PubMed] [Google Scholar]
- Fierro L, Parekh AB. Substantial depletion of the intracellular Ca2+ stores is required for macroscopic activation of the Ca2+ release-activated Ca2+ current in rat basophilic leukaemia cells. Journal of Physiology. 2000;522:247–257. doi: 10.1111/j.1469-7793.2000.t01-1-00247.x. [DOI] [PMC free article] [PubMed] [Google Scholar]
- Fomina AL, Nowycky M. A current activated on depletion of intracellular Ca2+ stores can regulate exocytosis in adrenal chromaffin cells. Journal of Neuroscience. 1999;19:3711–3722. doi: 10.1523/JNEUROSCI.19-10-03711.1999. [DOI] [PMC free article] [PubMed] [Google Scholar]
- Gericke M, Dar O, Droogmans G, Pecht I, Nilius B. Immunological stimulation of single rat basophilic leukaemia RBL-2H3 cells co-activates Ca2+-entry and K+-channels. Cell Calcium. 1995;17:71–83. doi: 10.1016/0143-4160(95)90104-3. [DOI] [PubMed] [Google Scholar]
- Glitsch MD, Parekh AB. Ca2+ store dynamics determines the pattern of activation of the store-operated Ca2+ current ICRAC in response to InsP3 in rat basophilic leukaemia cells. Journal of Physiology. 2000;523:283–290. doi: 10.1111/j.1469-7793.2000.t01-2-00283.x. [DOI] [PMC free article] [PubMed] [Google Scholar]
- Hamill OP, Marty A, Neher E, Sakmann B, Sigworth FJ. Improved patch-clamp techniques for high-resolution current recording from cells and cell-free membrane patches. Pflügers Archiv. 1981;391:85–100. doi: 10.1007/BF00656997. [DOI] [PubMed] [Google Scholar]
- Hoth M, Penner R. Depletion of intracellular calcium stores activates a calcium current in mast cells. Nature. 1992;355:353–356. doi: 10.1038/355353a0. [DOI] [PubMed] [Google Scholar]
- Kerschbaum HH, Cahalan MD. Single-channel recording of a store-operated Ca2+ channel in jurkat T-lymphocytes. Science. 1999;283:836–839. doi: 10.1126/science.283.5403.836. [DOI] [PubMed] [Google Scholar]
- Kiselyov K, Xu X, Mozhayeva G, Kuo T, Pessah I, Mignery G, Zhu X, Birnbaumer L, Muallem S. Functional interaction between InsP3 receptors and store-operated Htrp3 channels. Nature. 1998;396:478–482. doi: 10.1038/24890. [DOI] [PubMed] [Google Scholar]
- Lopatin AN, Makhina EN, Nichols CG. Potassium channel block by cytoplasmic polyamines as the mechanism of intrinsic rectification. Nature. 1994;372:366–369. doi: 10.1038/372366a0. [DOI] [PubMed] [Google Scholar]
- Mason MJ, Limberis J, Schofield GG. Transitional changes in membrane potential and intracellular Ca2+ in rat basophilic leukemia cells. Journal of Membrane Biology. 1999;170:79–87. doi: 10.1007/s002329900539. [DOI] [PubMed] [Google Scholar]
- Mathes C, Fleig A, Penner R. Calcium release-activated calcium current (ICRAC) is a direct target for sphingosine. Journal of Biological Chemistry. 1998;273:25020–25030. doi: 10.1074/jbc.273.39.25020. [DOI] [PubMed] [Google Scholar]
- Matsuda H, Saigusa A, Irisawa H. Ohmic conductance through the inwardly rectifying K channel and blocking by internal Mg2+ Nature. 1987;325:156–159. doi: 10.1038/325156a0. [DOI] [PubMed] [Google Scholar]
- Neher E. The use of Fura-2 for estimating Ca2+ buffers and Ca2+ fluxes. Neuropharmacology. 1995;34:1423–1442. doi: 10.1016/0028-3908(95)00144-u. [DOI] [PubMed] [Google Scholar]
- Neher E. Vesicle pools and Ca2+ microdomains. New tools for understanding their roles in neurotransmitter release. Neuron. 1998;20:389–399. doi: 10.1016/s0896-6273(00)80983-6. [DOI] [PubMed] [Google Scholar]
- Obukhov AG, Jones SVP, Degtiar VE, Lueckhoff A, Schultz G, Hescheler J. Ca2+-permeable large conductance nonselective cation channels in rat basophilic leukemia cells. American Journal of Cell Physiology. 1995;269:C1119–1125. doi: 10.1152/ajpcell.1995.269.5.C1119. [DOI] [PubMed] [Google Scholar]
- Parekh AB. Slow feedback inhibition of calcium release-activated calcium current (CRAC) by calcium entry. Journal of Biological Chemistry. 1998;273:14925–14932. doi: 10.1074/jbc.273.24.14925. [DOI] [PubMed] [Google Scholar]
- Parekh AB, Penner R. Depletion-activated Ca2+ current is inhibited by protein kinase in RBL-2H3 cells. Proceedings of the National Academy of Sciences of the USA. 1995;92:7907–7911. doi: 10.1073/pnas.92.17.7907. [DOI] [PMC free article] [PubMed] [Google Scholar]
- Parekh AB, Penner R. Store-operated calcium influx. Physiological Reviews. 1997;77:901–930. doi: 10.1152/physrev.1997.77.4.901. [DOI] [PubMed] [Google Scholar]
- Parekh AB, Fleig A, Penner R. The store-operated calcium current ICRAC: Non-linear activation by InsP3 and dissociation from calcium release. Cell. 1997;89:973–980. doi: 10.1016/s0092-8674(00)80282-2. [DOI] [PubMed] [Google Scholar]
- Patterson RL, Van Rossum DB, Gill DL. Store-operated Ca2+ entry: evidence for a secretion-like coupling model. Cell. 1999;98:487–499. doi: 10.1016/s0092-8674(00)81977-7. [DOI] [PubMed] [Google Scholar]
- Petersen OH, Burdakov D, Tepikin AV. Polarity in intracellular calcium signalling. Bioessays. 1999;21:851–860. doi: 10.1002/(SICI)1521-1878(199910)21:10<851::AID-BIES7>3.0.CO;2-F. [DOI] [PubMed] [Google Scholar]
- Pusch M, Neher E. Rates of diffusional exchange between small cells and a measuring patch pipette. Pflügers Archiv. 1988;411:204–211. doi: 10.1007/BF00582316. [DOI] [PubMed] [Google Scholar]
- Putney JW. A model for receptor-regulated calcium entry. Cell Calcium. 1986;7:1–12. doi: 10.1016/0143-4160(86)90026-6. [DOI] [PubMed] [Google Scholar]
- Putney JW. Kissin' cousins”: intimate plasma membrane-ER interactions underlie capacitative calcium entry. Cell. 1999;99:5–8. doi: 10.1016/s0092-8674(00)80056-2. [DOI] [PubMed] [Google Scholar]
- Reddy R, Smith D, Wayman G, Wu Z, Villacres EC, Storm DR. Voltage-sensitive adenylyl cyclase activity in cultured neurons. Journal of Biological Chemistry. 1995;270:14340–14346. doi: 10.1074/jbc.270.24.14340. [DOI] [PubMed] [Google Scholar]
- Scott RH, Sutton KG, Dolphin AC. Interactions of polyamines with neuronal ion channels. Trends in Neurosciences. 1993;16:153–160. doi: 10.1016/0166-2236(93)90124-5. [DOI] [PubMed] [Google Scholar]
- Sedova M, Klishin A, Hueser J, Blatter LA. Capacitative Ca2+ entry is graded with degree of intracellular Ca2+ store depletion in bovine vascular endothelial cells. Journal of Physiology. 2000;523:549–560. doi: 10.1111/j.1469-7793.2000.t01-3-00549.x. [DOI] [PMC free article] [PubMed] [Google Scholar]
- Zhu X, Birnbaumer L. Calcium channels formed by mammalian Trp homologues. News in Physiological Sciences. 1998;13:211–217. doi: 10.1152/physiologyonline.1998.13.5.211. [DOI] [PubMed] [Google Scholar]
- Zweifach A, Lewis RS. Rapid inactivation of depletion-activated calcium current (ICRAC) due to local calcium feedback. Journal of General Physiology. 1995a;105:209–226. doi: 10.1085/jgp.105.2.209. [DOI] [PMC free article] [PubMed] [Google Scholar]
- Zweifach A, Lewis RS. Slow calcium-dependent inactivation of depletion-activated calcium current. Store-dependent and independent mechanisms. Journal of Biological Chemistry. 1995b;270:14445–14451. doi: 10.1074/jbc.270.24.14445. [DOI] [PubMed] [Google Scholar]