

Abstract
The role of h1-calponin in regulating the contractile properties of smooth muscle was investigated in bladder and vas deferens of mice carrying a targeted mutation in both alleles designed to inactivate the basic calponin gene. These calponin knockout (KO) mice displayed no detectable h1-calponin in their smooth muscles.
The amplitudes of Ca2+ sensitization, force and Ca2+ sensitivity were not significantly different in permeabilized smooth muscle of KO compared with wild-type (WT) mice, nor were the delays in onset and half-times of Ca2+ sensitization, initiated by flash photolysis of caged GTPγS, different.
The unloaded shortening velocity (Vus) of thiophosphorylated fibres was significantly (P < 0.05) faster in the smooth muscle of KO than WT animals, but could be slowed by exogenous calponin to approximate WT levels; the concentration dependence of exogenous calponin slowing of Vus was proportional to its actomyosin binding in situ.
Actin expression was reduced by 25–50%, relative to that of myosin heavy chain, in smooth muscle of KO mice, without any change in the relative distribution of the actin isoforms.
We conclude that the faster Vus of smooth muscle of the KO mouse is consistent with, but does not prove without further study, physiological regulation of the crossbridge cycle by calponin. Our results show no detectable role of calponin in the signal transduction of the Ca2+-sensitization pathways in smooth muscle.
Smooth muscle contraction is primarily regulated via reversible Ca2+-calmodulin-dependent phosphorylation of myosin regulatory light chain (MLC20; Hartshorne, 1987; Somlyo & Somlyo, 1994), but the existence of additional, thin filament-mediated regulatory mechanisms that modulate contractility has also been proposed (Marston & Smith, 1985; Walsh, 1991). Basic or h1-calponin, herein referred to as calponin, is a 34 kDa smooth muscle-specific, actin-associated protein first isolated from bovine aorta (Takahashi et al. 1988), and a putative candidate for mediating thin filament regulation of smooth muscle (Lehman, 1991; Winder et al. 1998). It is a specific marker of smooth muscle phenotype (Takahashi et al. 1987; Gimona et al. 1990; Samaha et al. 1996) and the major calponin isoform expressed in smooth muscle (Jin et al. 1996). Exogenous calponin inhibits both maximal shortening velocity (Jaworoski et al. 1995; Obara et al. 1996) and isometric tension (Itoh et al. 1994; Jaworoski et al. 1995; Uyamu et al. 1996) in permeabilized smooth muscle containing endogenous calponin and, in vitro, calponin inhibits actin-activated Mg2+-ATPase activity (Takahashi et al. 1986; Winder & Walsh, 1990; Horiuchi & Chacko, 1991) and actin filament velocity (Shirinsky et al. 1992; Haeberle, 1994). It has been suggested that calponin maintains smooth muscle in a relaxed state at low/moderate levels of phosphorylated MLC20 (Malmqvist et al. 1997). However, conclusive evidence of its physiological role in smooth muscle is yet to be established and in a recent study comparing smooth muscle in rat strains with or without constitutive calponin expression, the only difference observed in smooth muscle lacking calponin was a small decrease in agonist sensitivity (Nigam et al. 1998), a change that could be due to a decrease in the Ca2+-sensitizing effects of agonists. Ca2+ sensitization describes the processes by which agents can increase myosin phosphorylation and force independently of changes in [Ca2+]i (Somlyo & Somlyo, 1994). Although the involvement of calponin in Ca2+ sensitization is unknown, based on an immunofluorescence study of the cellular redistribution of calponin, calponin has been implicated in protein kinase C (PKC)-mediated, Ca2+-independent contractions (Parker et al. 1994, 1998). A calponin gene-knockout strategy offers a powerful and unique means for testing the relative importance of calponin in the regulation of smooth muscle contraction. Therefore, in this study we compared Ca2+ sensitization, force, shortening velocity and the stoichiometry of contractile and regulatory proteins in smooth muscle from calponin KO and WT mice.
METHODS
Mice
A targeted mutation was induced in CCE ES cells (obtained from an inbred mouse line 129/SvJ; Gondo et al. 1994). F2 mice homozygous for the mutant basic calponin allele (KO) or the wild-type allele (WT) were generated after outcross to C57BL/6 mice as previously described (Yoshikawa et al. 1998). Homozygous mice of each genotype from the F2 generation were then used to derive independent KO and WT lines. The mice used for these experiments were taken from the F2 N ≥ 12 generations. The absence of h1-calponin expression in the KO mice was confirmed by Western blotting (Fig. 1). Mice were killed by halothane or CO2 inhalation, as approved by the Animal Research Committee of the University of Virginia.
Figure 1. Western blot for calponin (CaP) showing its presence and absence in WT and KO mice, respectively.
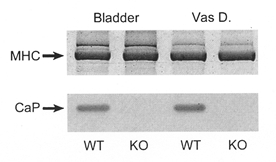
Similar protein loading is shown by Coomassie Blue staining of myosin heavy chain (MHC). Vas D., vas deferens.
Genome scanning
Using DNA prepared from one WT and five randomly selected KO mice, 73 mapped microsatellite loci (Dietrich, 1996; World Wide Web URL http://carbon.wi.mit.edu:8000/cgi-bin/mouse/index) previously determined to be polymorphic in a C57BL/6J × 129X1/SvJ (formerly 129/SvJ) cross were analysed using methods adapted from Dietrich et al. (1992). Briefly, PCR amplification from genomic DNA was performed using fluorochrome-labelled primers purchased from Research Genetics, Inc. (Huntsville, AL, USA) or synthesized from published oligonucleotide sequences (Integrated DNA Technologies, Coralville, IA, USA). Products from 10-16 loci per animal were pooled following amplification and analysed for allele sizes using an ABI377 automated sequencer equipped with Genescan v. 2.1 and Geneotyper v. 2.0 software (PE Applied Biosystems, Foster City, CA, USA). Strain determination was made using control DNA from C57BL/6J, 129X1/SvJ and (C57BL/6J × 129X1/SvJ)F1 mice. Detailed amplification protocols, locus list and allele sizes are available on request (M. J. McDuffie; email: mjm7e@virginia.edu). Inheritance of specific loci relevant to contractile function in smooth muscle was inferred through the genotypes of flanking markers when their localization in the mouse genome was known or predictable based on regions of human/mouse conserved synteny (Table 1).
Table 1.
Probable derivation of structural genes with contractile function in WT and KO mice
| Mouse mapping† | Parental derivation§ | ||||||
|---|---|---|---|---|---|---|---|
| Gene product | Gene symbol | Human mapping* | Confirmed | Predicted‡ | Ratio | WT | KO |
| Calponin | Cnn1 | 19p13.2 | 9:7.0 cM | — | — | B | A |
| Caldesmon | Cald1 | 7q33 | 6:11.5 cM | — | — | A | A |
| α-Actin | Actvs | 10q22–q24 | unknown | 19:25.0-42.0 cM | 4/8 | A | A/B |
| 14:2.5-14.0 cM | 3/8 | B | B | ||||
| 10:3.5 cM | 1/8 | A | A/B | ||||
| β-Actin | Actb | 7p22-p12 | 5:80.0cm | — | — | A | A |
| γ-Actin | Actg | 17q25 | unknown | 11:72.0-78.0 cM | 7/7 | A×B | BRA/B |
| α-Tropomyosin | Tpm1 | 15q22.1 | 9:40.0cM | — | — | A | B |
| β-Tropomyosin | Tpm2 | 9p13.2-p136.1 | unknow | 4:12.7-20.8 cM | 9/10 | B | A |
| 11:26.0 cM | 1/10 | A | A | ||||
Mapping data retrieved from Online Mendelian Inheritance in Man (OMIM; McKusick-Nathans Institute for Genetic Medicine, Johns Hopkins University, Baltimore, MD, USA) and National Center for Biotechnology Information (National Library of Medicine, Bethesda, MD, USA; May, 2000; World Wide Web RL http://www.ncbi.nlm.gov/omim/).
Mapping data retrieved from the Mouse Genome Database (MGD; Blake et al. 2000; Mouse Genome Informatics, The Jackson Laboratory, Bar Harbor, ME, USA; May, 2000; World Wide Web URL http://www.informatics.jax.org/). cM, centimorgans.
Regions of conserved synteny in mouse derived from closely linked human genes with defined and mapped mouse orthologues (no. of mouse orthologues in the predicted region/no. of total mapped mouse orthologues to human genes linked to the primary locus).
Allele desginations: A = 129X1/SvJ; B = C57BL/6; A/B = either A or B homozygote; A × B = heterozygote; R = recombinant.
Analysis of contractile and regulatory proteins
Bladder or vas deferens smooth muscle tissue was cleaned of connective tissue, blotted and weighed before homogenization in sample buffer (2% SDS, 10 mm dithiothreitol, 10% glycerol, a trace amount of Bromophenol Blue and 50 mm Tris HCl, pH 7.4) to give a stock concentration of 10 mg ml−1 (wet w/v). After homogenization, samples were heated at 85°C for 5 min and allowed to stand at room temperature for 60 min before centrifugation at 10 600 g for 10 min. Total protein extracts were subjected to SDS-PAGE and either stained with Coomassie Blue (0.2% w/v) or transferred to polyvinylidene fluoride membranes for subsequent Western blotting. For quantitative analysis of myosin heavy chain (MHC) and actin content, their relative concentrations were determined from serial dilutions of whole homogenate and compared to a linear range of bovine serum albumin standards, after correction for differential staining intensity with Coomassie Blue (Haeberle et al. 1992). The relative distribution of actin isoforms was determined by two-dimensional gel electrophoresis (2% ampholytes, pH 4-6.5) and staining with Coomassie Blue. Using densitometric analysis of Coomassie Blue-stained gels loaded with equal amounts of homogenate, the relative amounts of tropomyosin and h-caldesmon were expressed as a ratio of KO to WT. The identities of calponin, seven amino acid-inserted MHC, h-caldesmon and tropomyosin were confirmed by Western blotting. The calponin antibody was generated to a carboxyl-terminal peptide of calponin (Yoshikawa et al. 1998).
MLC20 thiophosphorylation
The levels of MLC20 thiophosphorylation were determined by one-dimensional isoelectric focusing (2% ampholytes, pH 4.5-5.4) and transfer to polyvinylidene fluoride membranes for subsequent Western blotting with an anti-MLC20 antibody.
Isometric tension measurement and solutions
Bundles of bladder muscle (3 mm × 200-400 μm) or strips of vas deferens (3 mm × 100-200 μm) were dissected from male mice (6-12 weeks, aged matched for WT and KO) and tied with monofilament silk to a fixed hook and force transducer (AE 801; AME, Horten, Norway) for measurement of isometric tension at room temperature (20°C) (Horiuti et al. 1989). For evaluating Ca2+ sensitization or relaxation from rigor, tissues were permeabilized with Staphylococcus aureus α-toxin (7500 rabbit units ml−1) for 45 min. Otherwise, tissues were permeabilized with 0.5% Triton X-100 for 20 min. All intracellular solutions had an ionic strength of 0.2 m (adjusted with potassium methanesulfonate), and contained 30 mm Pipes (pH 7.1), 2 mm free Mg2+, 4.5 mm MgATP, 5 mm creatine phosphate and 10 mm total EGTA (Ca-EGTA and EGTA were combined to produce the desired pCa) except for rigor solutions, which did not contain MgATP or creatine phosphate.
Ca2+ sensitization
After permeabilization with α-toxin, bladder bundles were incubated with A23187 (10 μm) for 10 min to deplete internal Ca2+ stores before equilibration in G10 solution (Ca2+ free, 10 mm EGTA) for 20 min. A steady-state pCa-force relationship was then obtained by cumulative addition of Ca2+. After relaxation in G10, strips were equilibrated for a further 20 min before obtaining a Ca2+-sensitization response in pCa 6.0 solution by cumulative addition of GTP (50 μm) and carbachol (100 μm), phorbol 12,13-dibutyrate (PDBu; 1 μm) or GTPγS (100 μm). After obtaining steady-state tension, strips were transferred to pCa 4.5 solution to elicit the maximal Ca2+-activated tension.
In some experiments, the kinetics of GTPγS-induced Ca2+ sensitization were compared in smooth muscle from WT and KO animals using flash photolysis of caged GTPγS to circumvent diffusional delays (Somlyo & Somlyo, 1990). Briefly, α-toxin-permeabilized bundles of bladder were transferred from G1 (Ca2+-free, 1 mm EGTA) to a 25 μl trough containing pCa 6.0 solution containing caged GTPγS (200 μm) and glutathione (3 mm) for 5 min. Caged GTPγS was photolysed using a frequency-doubled ruby laser (Lumonics, Warwick, UK), delivering a 50 ns pulse of near-UV light at 347 nm, sufficient to release 14 ± 2.3 μm GTPγS (n = 6, where n refers to the number of experimental observations), as determined by HPLC of the trough solution after completion of the force measurements. The delay between the laser flash and initiation of force by Ca2+ sensitization was measured from the point at which the force record started to deviate from the pre-photolysis baseline. The amplitude of the GTPγS-induced Ca2+ sensitization was measured from the pre-photolysis pCa 6.0-induced force plateau.
Determination of force per cross-sectional area
Bladder or vas deferens preparations were Triton permeabilized and washed for 15 min in G10 solution before activation in pCa 5.0 solution (containing 2 μm calmodulin) and subsequent relaxation in G10 solution. After tension had returned to baseline, the muscles were fixed whilst in the muscle trough, in 2% glutaraldehyde for 30 min, then cut down and transverse sections prepared (as detailed under ‘Electron Microscopy’). Sections (1 μm thick) were stained with Toluidine Blue, mounted under a coverslip, and photographed at × 80 magnification. The mean cross-sectional area of each strip was determined from three sections taken at different levels. Each section area was developed onto 10 cm × 15 cm prints, counted using a transparent grid overlay and compared to prints of known area.
Electron microscopy
Strips of bladder or vas deferens were fixed in 2% glutaraldehyde in 75 mm sodium cacodylate buffer with 4% sucrose overnight at 4°C, followed by fixation in 2% osmium tetroxide and 1% tannic acid, en bloc staining with saturated uranyl acetate, dehydration in alcohol and embedment in Spurr’s resin. Thin transverse sections were stained with lead citrate and examined in a Philips CM12 electron microscope at 80 keV (1 eV = 1.60219 × 10⁻¹⁹ J). Cells were evaluated for filament content and differences in morphology between the WT and KO specimens.
Unloaded shortening velocity
Vus was determined using the slack test method (Edman, 1979; Matthew et al. 1998). Briefly, Triton-permeabilized muscle preparations, attached to hooks via aluminium T-clips, were washed in zero-Ca2+ rigor solution for 15 min before transfer to ATP-free, pCa 5.0 (Ca2+-rigor) solution containing 1 mm ATPγS and 2 μm calmodulin for 10 min. After thiophosphorylation, preparations were washed in zero-Ca2+ rigor solution for 15 min before activation of tension in G10 solution (plus 8 mm creatine phosphate and 100 units ml−1 creatine kinase). Upon reaching steady-state isometric tension, length changes of varying amplitude, 7-20% of the initial muscle length and sufficient to reduce tension to baseline, were applied to one end of the muscle strip using an isotonic lever (Model 308, Cambridge Technology, Watertown, MA, USA; maximum step time, 300 μs); the time taken for the strip to take up the slack (Fig. 2A) was plotted against the length change and the slope of this relationship was taken as the Vus (Fig. 2B). To minimize depletion of MgATP and accumulation of MgADP, trough solutions were changed every 3 min during determination of Vus.
Figure 2. Measurement of unloaded shortening velocity.
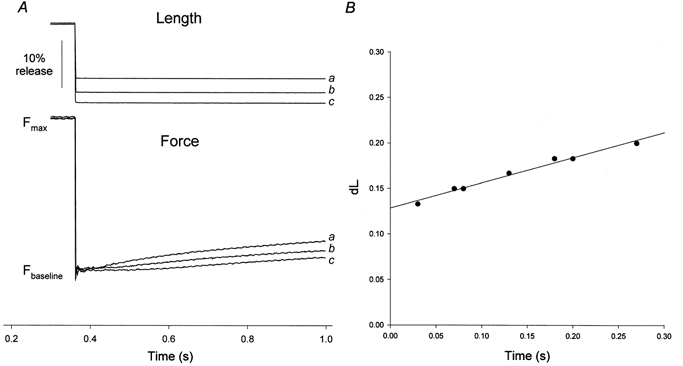
A, superimposed original force traces from mouse bladder smooth muscle demonstrating the slack test. After thiophosphorylation, steady-state force was obtained in the presence of 4.5 mm MgATP (Fmax). Slack was introduced by imposing rapid releases up to ∼20% of the initial muscle length. The length step was kept constant and the time for the imposed slack to be taken up by the muscle was indicated by the deviation from Fbaseline of the force tracing. Note that the shorter the length step, the shorter the time to remove slack. B, plot of individual slack test measurements performed on the same strip. Note the linear relationship of dL vs. dt over this time range (where dL is length change, normalised to initial length). The slope of this relationship was taken as the unloaded shortening velocity.
In some experiments, the effect of exogenous calponin on the shortening velocity of vas deferens strips from KO mice was examined. Strips were thiophosphorylated as above, but also incubated for a further 30 min in calponin (0-12 μm)-containing rigor solution before activation of force. Before use, calponin was extensively dialysed against 20 mm Pipes (pH 7.1) and 1 mm DTT and rapidly frozen as a 2 mg ml−1 stock. Vials were thawed immediately before use.
Co-sedimentation of calponin with actomyosin
In order to determine whether there was a correlation between the effect of exogenous calponin on shortening velocity and calponin binding to actomyosin, Triton-permeabilized strips of vas deferens from KO mice were incubated for 30 min in calponin (0-12 μm)-containing rigor solution, washed in calponin-free G10 solution (4.5 mm MgATP) for a further 30 min, lightly blotted and rapidly frozen in liquid N2. Thawed strips were homogenized in 100 μl lysis buffer (1% Nonidet P-40, 150 mm NaCl, 2 mm MgCl2, 2 mm EGTA, 1 mm DTT, 0.1 mm leupeptin, 1 mm 4-(2-aminoethyl)benzenesulfonyl fluoride (AEBSF) and 20 mm Tris HCl (pH 7.2). Cellular debris was pelleted at 800 g for 10 min. The supernatant was transferred to an ultracentrifuge tube and spun at 200 000 g for 30 min at 20°C (TLA 120.1, Ultima TLX, Beckman) to sediment actin and myosin. The pellet and supernatant (1/3 total volume) were resuspended in 2 × Laemmli sample buffer and analysed using one-dimensional SDS-PAGE to determine whether calponin distributed with actomyosin or was retained in the supernatant. To test whether calponin itself precipitated under these conditions, 100 μl lysis buffer containing 800 ng calponin was used as a control.
Relaxation from rigor
The apparent second-order rate constants of ATP-induced crossbridge detachment from high tension rigor, in the absence of Ca2+, were estimated in α-toxin-permeabilized vas deferens from WT and KO mice as previously described (Fuglsang et al. 1993; Khromov et al. 1996). Briefly, after establishment of high-tension rigor, strips were incubated for 3 min with caged ATP before photolytic release of ATP. The ensuing relaxation consisted of an initial fast component and a second, slower component. The rate constant of the fast component was determined over a range of ATP concentrations (50-400 μm). Fitting of this relationship provided an estimate of the apparent second-order rate constant of MgATP-induced crossbridge detachment and was performed using SigmaPlot 4.0 software (Jandel Scientific, San Rafael, CA, USA).
Materials
All reagents were obtained from Sigma Chemical Co. except for α-toxin, which was purified from Staphylococcus aureus, A23187 (Calbiochem, La Jolla, CA, USA), ATPγS and GTPγS (Boehringer Mannheim, Indianapolis, IN, USA), caged GTPγS (a generous gift from Drs D. Trentham and G. Reid), pH ampholytes (Pharmalyte, Pharmacia, Piscataway, NJ, USA), chicken gizzard calponin (a generous gift from Dr M. Walsh), anti-MHC insert antibody (a generous gift from Dr A. Rovner), anti-myosin essential light chain (MLC17) antibody (a generous gift from Dr K. Trybus), anti-smooth muscle myosin phosphatase regulatory subunit antibody (a generous gift from Dr D. Hartshorne), anti-MLC20 antibody (a generous gift from Dr K. Kamm), HRP-conjugated anti-mouse antibody (Goldmark Biologicals, Philipsburg, NJ, USA) and HRP-conjugated anti-rabbit antibody (Amersham, Piscataway, NJ, USA).
Statistics and data analysis
Data are presented as the mean ± s.e.m. and statistical significance was determined using Student’s t test for single comparisons or Student’s t test with the Bonferroni modification for multiple comparisons. The force records from the flash photolysis and slack test experiments were collected using LabView 3.1.1 data acquisition software (National Instruments, Austin, TX, USA). Quantification of protein bands was determined by gel-scanning densitometry (GS 670, BioRad, Hercules, CA, USA). All gels and Western blots presented are representative of at least three similar experiments.
RESULTS
Mice
As originally described (Yoshikawa et al. 1998), the calponin KO animals did not differ from WT mice in terms of body weight, growth, fertility or activity and the offspring of heterozygote matings exhibited Mendelian distribution.
Contractile and regulatory protein content
Initial experiments were conducted to determine whether, in addition to inactivation of the calponin gene (Fig. 1), the expression of other contractile or regulatory proteins was also altered. In smooth muscle from KO mice, the amount of MHC was not significantly different from WT (Fig. 3 and Table 2), nor was any change detectable in the relative expressions of the seven amino acid-inserted MHC isoform (Fig. 4A), MLC17 isoforms (Fig. 4B), myosin light chain kinase (Fig. 5A), or the regulatory subunit of smooth muscle myosin phosphatase (Fig. 5B). However, the amount of actin was significantly (P < 0.05) reduced by ∼25% in the bladder and ∼50% in the vas deferens (Fig. 3 and Table 2). Using densitometric analysis, the KO/WT ratio of tropomyosin (α and β) expression was 0.5 ± 0.06 in the bladder (n = 7) and 0.5 ± 0.05 in the vas deferens (n = 4). The KO/WT ratio of h-caldesmon was 0.9 ± 0.03 in the bladder (n = 6) and 1.1 ± 0.05 in the vas deferens (n = 5) but, interestingly, an upwards shift in the SDS-PAGE mobility of h-caldesmon was present in both KO smooth muscles (Fig. 6).
Figure 3. Coomassie Blue stain of smooth muscle protein extracts from WT and KO mice using 12% SDS-PAGE.
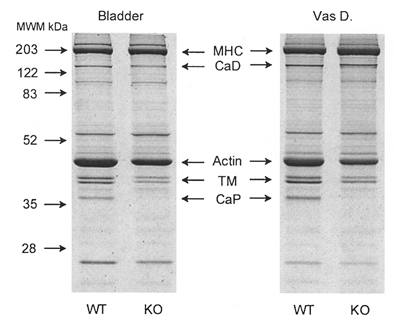
Positions of major contractile proteins are indicated. Note that in extracts from calponin KO mice, there is a concomitant decrease in actin and tropomyosin (TM) relative to myosin heavy chain (MHC). The identities of calponin (CaP), TM and caldesmon (CaD) were confirmed by Western blotting. The size of the protein bands (in kDa) is indicated beside the gel.
Table 2.
Quantitative analysis of myosin heavy chain and actin expression
| Myosin | Actin | ||||
|---|---|---|---|---|---|
| Tissue | n | WT | KO | WT | KO |
| Bladder | 7 | 12 ± 1.6 | 14 ± 1.8 | 41 ± 3.3 | 29 ± 2.7* |
| Vas deferes | 6 | 16 ± 1.1 | 19 ± 1.6 | 41 ± 3.4 | 20 ± 1.9* |
Mouse bladder or vas deferens tissue was prepared, analysed using 10 or 12% SDS-PAGE, and quantified as described in Methods. Amounts of protein are expressed in micrograms per milligram tissue (wet wt).
P < 0.05 compared to WT tissue.
Figure 4. Expression of myosin isoforms in WT and KO tissue.
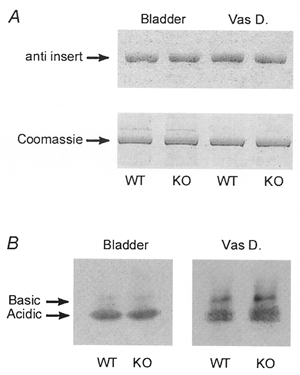
A, Western blot for the 7 amino acid-inserted isoform of MHC (anti insert, upper panel) using 10% SDS-PAGE. Relative loading is indicated by the Coomassie Blue stain (lower panel) of MHC remaining in the gel after transfer. B, Western blot for myosin essential light chain (MLC17) acidic and basic isoforms using one-dimensional isoelectric focusing.
Figure 5. Expression of MLCK and SMPP-1M in WT and KO tissue using 10% SDS-PAGE.
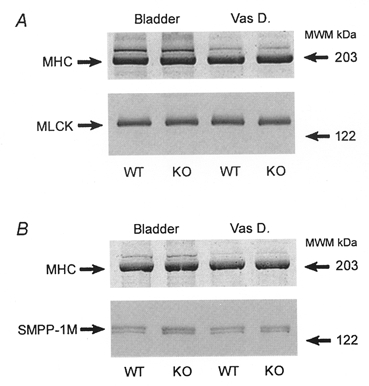
A, Western blot for myosin light chain kinase (MLCK). B, Western blot for the regulatory subunit of smooth muscle myosin phosphatase (SMPP-1M). In both A and B, relative loading is indicated by the Coomassie Blue stain for myosin heavy chain (MHC).
Figure 6. Expression of h-caldesmon in WT and KO tissue using 7.5% SDS-PAGE.
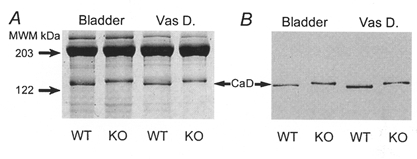
A, Coomassie Blue stain showing an upwards shift in mobility of h-caldesmon (CaD) in KO tissue. The identity of CaD was confirmed by Western blotting (B).
Assuming molecular masses of 41 kDa for actin and 203 kDa for MHC, the approximate actin:MHC molar ratio was reduced from 16:1 to 10.5:1 in the bladder and from 12:1 to 5.2:1 in the vas deferens of KO animals compared to WT. This reduction in total actin was not associated with any change in the relative distribution of the α, β and γ isoforms of actin (Table 3), but was paralleled by a reduction in actin filament density (see ‘Morphology’ below).
Table 3.
Distribution of actin isoforms
| Bladder | Vas deferences | ||||||
|---|---|---|---|---|---|---|---|
| Strain | n | α | β | γ | α | β | γ |
| WT | 3 | 44 ± 3.5 | 10 ± 1.1 | 46 ± 2.3 | 49 ± 1.9 | 10 ± 2.1 | 41 ± 2.1 |
| KO | 3 | 44 ± 1.6 | 8 ± 1.1 | 47 ± 1.3 | 49 ± 3.3 | 11 ± 2.9 | 40 ± 0.7 |
Mouse bladder or vas deferens tissue was prepared, analysed using using 2–D SDS–PAGE, and quantified as described in Methods. Values are expressed as a percentage of the total actin.
Ca2+ sensitization
Neither the Ca2+ sensitivity nor the relative amplitude of the responses to the Ca2+-sensitizing agents carbachol, PDBu or GTPγS (Fig. 7) was significantly different between α-toxin-permeabilized bladder preparations from WT and KO mice. The pCa-tension curves were superimposable with pCa for half-maximal response (pCa50) values of 5.5 ± 0.06 (WT) and 5.5 ± 0.08 (KO) (both n = 6). In order to test whether the kinetics of GTPγS-induced Ca2+ sensitization were affected in the KO mouse, GTPγS was released by flash photolysis of caged GTPγS at constant [Ca2+] (Fig. 8). No significant difference was observed in the delay, half-time or relative amplitude of contraction between muscles from WT and KO animals (Table 4).
Figure 7. Summary of cumulative tension responses of α-toxin-permeabilized bundles of mouse bladder to Ca2+-sensitizing agents.
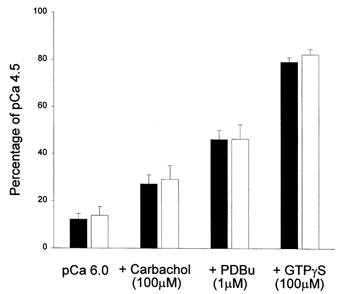
Tension is expressed as a percentage of the maximal force response to pCa 4.5. WT, ▪ (n = 6); KO, □ (n = 6). Force in pCa 4.5 was 0.79 ± 0.10 mN for WT and 0.81 ± 0.11 mN for KO. Note that the different agents were added sequentially to the same strips and the cumulative response is shown.
Figure 8. Representative tension trace illustrating the protocol for measuring the rate of Ca2+ sensitization induced by flash photolytic release of GTPγS from caged GTPγS in α-toxin-permeabilized mouse bladder.
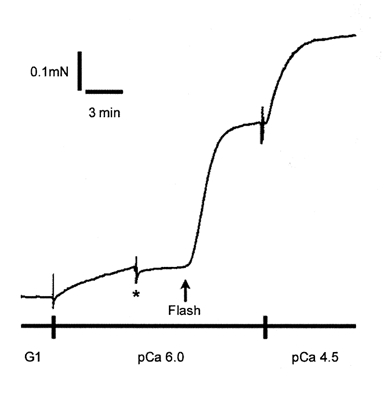
Sub-maximal tension was produced by transfer from G1 to pCa 6.0 solution. At the point indicated by the asterisk, the preparation was transferred from pCa 6.0 solution to the photolysis trough containing pCa 6.0 and 200 μm caged GTPγS. After approximately 3 min, laser flash photolysis of the caged compound released GTPγS, which produced an increase in tension. At the tension plateau, the preparation was transferred to pCa 4.5 solution to elicit maximal tension.
Table 4.
Rate and amplitude of Ca2+ sensitization initiated by laser flash photolysis of caged GTPγS
| Strain | n | Delay (s) | t50% (s) | Percentange of pCa 4.5-induced tension |
|---|---|---|---|---|
| WT | 10 | 4.3 ± 0.3 | 68 ± 4.8 | 52 ± 4.6 |
| KO | 9 | 4.8 ± 0.4 | 66 ± 7.1 | 57 ± 5.1 |
Mouse bladder bundles, α-toxin-permeabilized, were incubated with caged GTPγS (200 μm) for 5 min in pCa 6.0 solution. Force development by Ca2+ sensitization was initiated by laser flash photolysis as described in Methods. t50%, time to reach 50% of maximal GTPγS-induced Ca2+ sensitization.
Unloaded shortening velocity
Vus was significantly faster (P < 0.05) in KO compared to WT preparations in both the vas deferens and bladder (Table 5), whereas the levels of MLC20 thiophosphorylation in WT and KO mice were similar (vas deferens, 71 ± 4% for WT vs. 70 ± 2% for KO; bladder, 80 ± 3% for WT vs. 81 ± 2% for KO; all n = 3).
Table 5.
Unloaded shortening velocity (Vus) of Triton-permeabilized muscles
| Tissue | WT | KO |
|---|---|---|
| Vas deferens | 0.23 ± 0.01 (10) | 0.31 ± 0.03 (8)* |
| Bladder | 0.25 ± 0.03 (5) | 0.36 ± 0.03 (7)* |
After permeabilization, MLC20 was thiophosphorlated before activation of tension in G10 solution and measurement of Vus as described in Methods. Values are in muscle lengths per second; n is shown in parentheses.
P < 0.05, sgnificantly different from WT.
Force per cross-sectional area
No significant difference in the force per cross-sectional area was observed between Triton-permeabilized WT and KO muscles activated in pCa 5.0 solution. In vas deferens, the values were 18 ± 5.3 mN mm−2 for WT and 18 ± 5.2 mN mm−2 for KO (both n = 4), and for bladder they were 25 ± 6.1 mN mm−2 for WT and 19 ± 1.0 mN mm−2 for KO (both n = 3).
The effect of exogenous calponin on shortening velocity and lack of effect on force
To determine whether the above increase in Vus of muscles from the KO mice could be reversed by exogenous calponin, we incubated Triton-permeabilized, thiophosphorylated strips of vas deferens with increasing concentrations of calponin (0-12 μm). A concentration-dependent reduction in Vus (Fig. 9A) was shown to be proportional to the amount of calponin bound to actomyosin in situ (Fig. 9B). Note that no calponin was detectable in the supernatants (1/3 of the total supernatant volume was loaded), indicating that the majority of calponin retained after 30 min washing was bound to actomyosin. Although calponin (12 μm) caused a significant reduction in Vus, it had no significant effect on the amplitude of the force produced upon addition of 4.5 mm MgATP (after Triton permeabilization and MLC20 thiophosphorylation), expressed as a percentage of the initial response to high K+ (154 mm) before permeabilization: 49 ± 12% in the 0 μm (dialysate buffer only) group and 54 ± 7% in the 12 μm calponin-treated group (both n = 4).
Figure 9. Inhibition of shortening velocity by exogenous calponin is porportional to its actomyosin binding in situ.
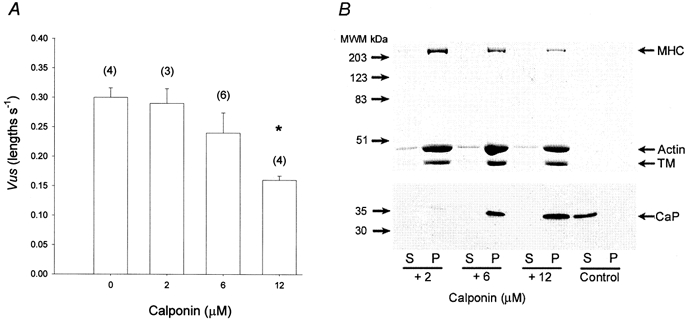
A, exogenous calponin inhibits the shortening velocity of MLC20-thiophosphorylated strips of vas deferens from KO mice. Strips of Triton-permeabilized KO vas deferens were thiophosphorylated and then incubated for a further 30 min with 0, 2, 6 or 12 μm calponin as described in Methods, before activation of force and measurement of shortening velocity. n for each concentration is shown in parentheses. *P < 0.05 compared to 0 μm. B, co-precipitation of exogenous calponin with native actomyosin from KO vas deferens, using 10% SDS-PAGE. Strips of Triton-permeabilized vas deferens from KO mice were incubated with 2, 6 or 12 μm calponin as described in Methods. Following high-speed centrifugation (200 000 g) of the tissue homogenate, the supernatant (S) and pellet (P) were analysed using 10% SDS-PAGE. The upper section of the gel, stained with Coomassie Blue, shows that the majority of the myosin heavy chain (MHC), actin and tropomyosin (TM) was located in the pellet. The lower section of the gel was transferred to polyvinylidene fluoride membrane and blotted for calponin (CaP). Note the similar concentration dependence of the co-precipitation of calponin with actomyosin and its effects on shortening velocity (compare with A). Control refers to high-speed centrifugation of exogenous calponin (800 ng) in the absence of tissue homogenate.
Relaxation from rigor
To determine whether the altered Vus in the KO mice was associated with a difference in nucleotide binding, we estimated the apparent second-order rate constant of MgATP-induced crossbridge detachment from rigor. There was no significant difference in the dependence on [MgATP] (Fig. 10) or the amplitude of the initial, rapid phase of relaxation from rigor between vas deferens strips from WT or KO mice. The apparent second-order rate constant, estimated using pooled data from the WT and KO mice, was 9.7 (± 0.6) × 104m−1 s−1, which is similar to the value obtained for phasic smooth muscle of the rabbit (Khromov et al. 1996).
Figure 10. Concentration dependence of the rate constant of MgATP-induced crossbridge detachment from rigor.
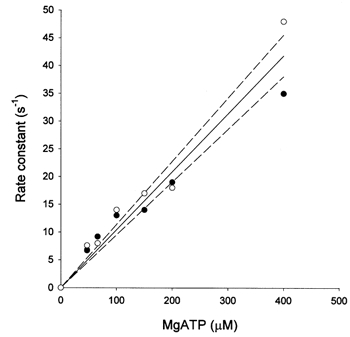
Strips of α-toxin-permeabilized vas deferens were prepared as described in Methods. Open and filled symbols represent WT and KO tissue, respectively. Each point represents a single observation. Fitting of the pooled data (continuous line) estimated a second-order rate constant of 9.7 (± 0.6) × 104m−1 s−1. The dashed lines represent the 95% confidence limits.
Morphology
The ultrastructure was examined in vas deferens preparations from three calponin KO and two WT mice, in the portal anterior mesenteric vein of one KO and one WT mouse, and in the bladder from one KO mouse. All preparations were permeabilized with α-toxin, except for one pair of KO and WT vas deferens tissues, which were permeabilized with Triton X-100 prior to fixation. Permeabilization enhances the penetration of the fixative for improved preservation of the contractile proteins. Low magnification transverse views across the wall of the vas deferens or portal vein showed no obvious differences in wall thickness, cell shape or size, or in the size of the extracellular space. At higher magnifications in the α-toxin-permeabilized preparations, the mitochondria, cytoplasmic and membrane-associated dense bodies, endoplasmic reticulum and sarcoplasmic reticulum appeared normal in all tissues examined from both the WT and KO mice. In transverse sections, a regular distribution of myosin filaments occurred throughout the cytoplasm in all of the well-preserved preparations (Fig. 11). To determine the structural correlates of the 51% decrease in actin determined by SDS-PAGE in the vas deferens from the KO mice, the ratio of actin to myosin filaments was measured in transverse sections in the same Triton-permeabilized muscle strips that were used to measure the total force per cross-sectional area. These muscles were set at the same resting length, and following the maximal Ca2+ contraction were relaxed to the resting level and fixed in this state. In micrographs at × 66 000 magnification, regions of transversely oriented actin and myosin filaments suitable for counting were circled and the number of actin and myosin profiles counted. The measurements were performed blind. The actin-to-myosin ratio in 28 regions from the vas deferens of the WT mouse was 11.3 ± 0.59, and was 6.6 ± 0.31 in 15 regions from the vas deferens of the KO mouse. The decrease in actin was highly significant (P < 0.00001).
Figure 11. Electron micrographs of Triton-permeabilized WT and KO vas deferens.
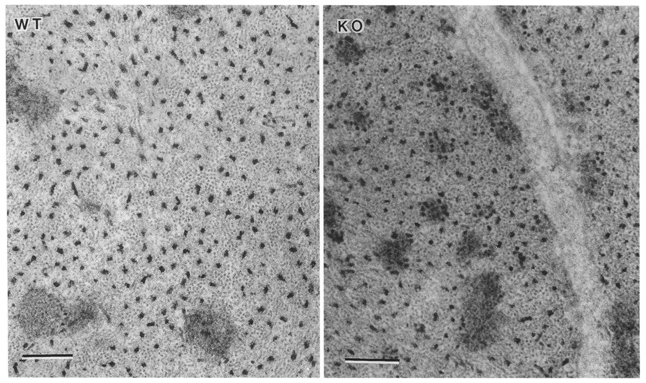
The cytoplasmic distribution of thick and thin filaments in transverse section. Scale bars represent 0.2 μm.
DISCUSSION
The major findings of our comparison of smooth muscle of calponin KO with WT mice were (1) a faster Vus of KO fibres in which MLC20 was thiophosphorylated for maximal activation, an effect that could be inhibited by exogenous calponin, (2) altered expression of contractile proteins other than calponin, and (3) no difference in Ca2+-activated tension or the rate constant of MgATP binding to crossbridges. The calponin KO mice developed normally and did not display increased morbidity or mortality compared with WT mice. In addition, unstimulated muscles of KO mice were not contracted, as might be expected if calponin was required to maintain smooth muscle in a relaxed state (Malmqvist et al. 1997). The basal level (in G10 solution) of MLC20 phosphorylation was ∼10% (data not shown) in both WT and KO permeabilized bladder smooth muscle. In an earlier study of osteogenesis in this KO mouse, Yoshikawa et al. (1998) found no enhanced or ectopic expression of neutral or acidic calponin isoforms. Although neutral (Nigam et al. 1998) and acidic (Applegate et al. 1994) isoforms have been detected in some smooth muscles, their relative paucity of expression compared to basic calponin renders any compensatory effect of these isoforms on smooth muscle function highly unlikely. Previous in situ studies were limited to adding exogenous calponin to smooth muscle either expressing native levels of calponin (Itoh et al. 1994; Jaworoski et al. 1995; Obara et al. 1996; Uyama et al. 1996) or from which calponin had been non-selectively extracted (Malmqvist et al. 1997), whereas the knockout strategy provided us with a more direct method for examining the functional importance of calponin in smooth muscle regulation.
The Vus of KO smooth muscle was faster under conditions in which the level of MLC20 thiophosphorylation in WT and KO tissues was comparable and, therefore, the faster velocity of KO muscle is the result of a difference in crossbridge cycling, rather than the level of activation. The relative expressions of the seven amino acid-inserted MHC and the acidic MLC17 isoform were also unchanged, both of which correlate with faster shortening velocities in smooth muscle (Sjuve et al. 1996; DiSanto et al. 1997; Malmqvist & Arner, 1991; Matthew et al. 1998; reviewed in Somlyo, 1993). Consistent with the faster Vus in the absence of calponin, exogenous calponin inhibited the Vus of KO fibres to approximate WT levels without, however, a discernible effect on force. A selective effect of calponin on Vus, but not force, is supported by the similar Ca2+-activated tension generated by smooth muscle from WT and KO mice, and is in agreement with studies in which exogenous calponin, added to permeabilized smooth muscle, affected velocity to a greater extent than force (Jaworoski et al. 1995; Obara et al. 1996). This implies a greater effect of calponin on g than f, the apparent rate constants for crossbridge detachment and attachment, respectively, described in detail by Huxley (1957). Since there was no difference in the apparent second-order rate constant of MgATP binding to crossbridges, the Vus differences in WT and KO tissue are likely to be rate limited by a later step(s) in the crossbridge cycle, other than MgATP binding, e.g. isomerization, inorganic phosphate (Pi) release, MgADP dissociation.
The shortening velocity of muscle is related to the number of contractile units in series (‘minisarcomeres’ in smooth muscle; Ashton et al. 1975), as well as to the crossbridge detachment rate (Rüegg, 1971). The apparent Vus of KO smooth muscle, when expressed in muscle lengths per second, may well be faster compared to WT if the reduced actin results in shorter minisarcomeres acting in series. The reduced number of actin filaments in electron micrographs of KO smooth muscles could be indicative of shorter minisarcomeres, but these measurements do not distinguish between a decreased length and a decreased number of filaments. Therefore, the possibility cannot be excluded that the decrease in actin, rather than the absence of calponin, is responsible for the faster Vus in smooth muscle of KO mice. In vitro (Kake et al. 1995), calponin has been shown to promote and stabilize actin polymerization, suggesting that actin filament formation, but not necessarily actin content, may be affected by the absence of calponin. That the faster Vus of KO mice can be reduced by exogenous calponin supports the hypothesis that calponin exerts a regulatory influence on the crossbridge cycle, probably mediated via its binding to actin (Takahashi et al. 1986; Winder & Walsh, 1990; Mezgueldi et al. 1992), although the co-precipitation result does not preclude binding also to myosin (Szymanski & Tao, 1993) or tropomyosin (Takahashi et al. 1987). Further, because exogenous calponin also reduces the Vus of smooth muscles containing a normal complement of endogenous calponin (Jaworowski et al. 1995; Obara et al. 1996), no claim can be made for a specific ‘rescue’ of KO smooth muscles by exogenous calponin.
The altered expression of actin and tropomyosin and the mobility shift of caldesmon in the calponin KO mouse were unexpected. They may reflect the co-ordinate regulation of calponin expression with that of other thin filament proteins, although the variations in genetic background of the WT and KO strains could also be responsible. A limited DNA microsatellite mapping study was performed to address the issue of genetic background. Consistent with the number of intercross generations, 85-90% of the loci were typed as homozygous in the WT and KO mice. Forty per cent of the homozygous loci in the KO mice were C57BL/6J derived, compared with 45% in the WT animal. The excess of 129 alleles in KO mice was caused by the expected selective retention of a large fraction of chromosome 9 surrounding the putative calponin locus (NCBI LocusLink; Maglott, 2000; World Wide Web URL http://www.ncbi.nlm.nih.gov/genome/sts/sts.cgi?uid=125918). The five KO mice were essentially concordant for parental derivation except in regions where persistent heterozygosity was detected (∼15% of loci). Based on genotypes at flanking markers, the regions encoding structural genes relevant to smooth muscle contractile function were tested for parental derivation in KO and WT mice. With the exception of the expected discordance found near the calponin gene, only the intervals flanking the tropomyosin α and β loci (Table 1) were clearly dissimilar in parental derivation. Genome scan data, however, demonstrated that the WT and KO mice differed across intervals on 13 chromosomes, including most of chromosomes 1 and 9 (Table 1 and data not shown). Furthermore, five loci carried a third, unidentified allele suggesting genetic contamination of one or both of the parental strains (D5Mit240, D7Mit78, D8Mit112, D10Mit35, D12Nds2). Thus, although allelic differences in trans-acting regulatory genes are unlikely to result in the co-ordinate decrease in actin subunit expression or the mobility shift seen in the caldesmon protein from KO mice, such trans-acting gene effects cannot be ruled out until congenic mice with defined, equivalent genetic backgrounds are available.
The different SDS-PAGE mobility of h-caldesmon in WT and KO tissues resembles a previously reported h-caldesmon doublet (Bretscher, 1984) attributable to a heterogeneity of exon expression (Payne et al. 1995). Whether the shift in h-caldesmon mobility (Fig. 6) is of the same origin, its functional significance, if any, is unknown.
Consistent with observations on other mammalian smooth muscle (Kitazawa et al. 1989; reviewed in Somlyo & Somlyo, 2000), a Ca2+-sensitizing mechanism was present in the mouse and unequal maximal responses (Himpens et al. 1990) could be elicited by carbachol, PDBu or GTPγS in α-toxin-permeabilized bladder. Since the responses to these stimuli were additive, it is likely that distinct G-protein- and PKC-coupled pathways of Ca2+ sensitization can be activated in this tissue (Jensen et al. 1996). The amplitudes of Ca2+ sensitization produced by these agents were not different in WT and KO preparations (Fig. 7), nor were the delay in the onset and the rate of GTPγS-induced Ca2+ sensitization following flash photolysis of caged GTPγS (Table 4). These findings imply that the Rho-A signalling pathway leading to inhibition of myosin phosphatase (reviewed in Somlyo & Somlyo, 2000) is not altered in the muscles from KO animals. Assuming no compensatory mechanism masking the effects of the absence of calponin, we conclude that calponin is not necessary for signal transduction of G-protein- or phorbol ester-mediated pathways of Ca2+ sensitization in mouse smooth muscle. This is in agreement with a calponin-independent pathway of PKC-induced Ca2+ sensitization in rabbit vascular smooth muscle (Kitazawa et al. 1999), but does not support a cellular redistribution of calponin being a necessary step in PKC-dependent contraction of smooth muscle (Parker et al. 1998).
In conclusion, the present results are consistent with, but do not prove, a physiological role for calponin in regulating the crossbridge cycle in smooth muscle. In addition, the absence of calponin was without effect on force, Ca2+ sensitivity or Ca2+ sensitization in the mouse smooth muscles studied.
Note added in proof
An increase in shortening velocity in intact, non-permeabilized smooth muscle of calponin knockout mice has been noted in a preliminary report by K. Takahashi, M. Mitsui-Saito, K. Fuchibe, Y. Yamamura, S. Taniguchi, M. Katsuki, H. Ozaki, T. Tsuchiya, N. Shibata & H. Karaki (Biophysical Journal74, A38 (1998)) in which, however, the level of activation (intracellular Ca2+ and myosin light chain phosphorylation) was not controlled.
Acknowledgments
We thank Drs Hartshorne, Kamm, Reid, Rovner, Trentham, Trybus and Walsh for their generous gift of reagents, Joseph Craft for technical assistance with the tissue sections and Barbara Nordin for preparation of the manuscript. This work was supported by the NIH (PO1-HL 19242 and PO1-HL 48807).
J. D. Matthew and A. S. Khromov contributed equally to this work.
References
- Applegate D, Feng W, Green RS, Taubman MB. Cloning and expression of a novel acidic calponin isoform from rat aortic vascular smooth muscle. Journal of Biological Chemistry. 1994;269:10683–10690. [PubMed] [Google Scholar]
- Ashton FT, Somlyo AV, Somlyo AP. The contractile apparatus of vascular smooth muscle: intermediate high voltage stereo electron microscopy. Journal of Molecular Biology. 1975;98:17–29. doi: 10.1016/s0022-2836(75)80098-2. [DOI] [PubMed] [Google Scholar]
- Blake JA, Eppig JT, Richardson JE, Davisson MT. The Mouse Genome Database (MGD): expanding genetic and genomic resources for the laboratory mouse. Nucleic Acids Research. 2000;28:108–111. doi: 10.1093/nar/28.1.108. [DOI] [PMC free article] [PubMed] [Google Scholar]
- Bretscher A. Smooth muscle caldesmon. Rapid purification and F-actin cross-linking properties. Journal of Biological Chemistry. 1984;259:12873–12880. [PubMed] [Google Scholar]
- Dietrich W, Katz H, Lincoln H, Shin H-S, Friedman J, Dracopoli NC, Lander EC. A genetic map of the mouse suitable for typing intraspecific crosses. Genetics. 1992;131:423–447. doi: 10.1093/genetics/131.2.423. [DOI] [PMC free article] [PubMed] [Google Scholar]
- Dietrich WF, Miller J, Steen R, Merchant MA, Damron-Boles D, Husain Z, Dredge R, Daly MJ, Ingalls KA, O’Conner TJ, Evans CA, DeAngelis MM, Levinson DM, Kruglyak L, Goodman N, Copeland NG, Jenkins NA, Hawkins TL, Stein L, Page DC, Lander ES. A comprehensive genetic map of the mouse genome. Nature. 1996;380:149–152. doi: 10.1038/380149a0. [DOI] [PubMed] [Google Scholar]
- DiSanto ME, Cox RH, Wang Z, Chacko S. NH2-terminal-inserted myosin II heavy chain is expressed in smooth muscle of small muscular arteries. American Journal of Physiology. 1997;272:C1532–1542. doi: 10.1152/ajpcell.1997.272.5.C1532. [DOI] [PubMed] [Google Scholar]
- Edman KA. The velocity of unloaded shortening and its relation to sarcomere length and isometric force in vertebrate muscle fibres. Journal of Physiology. 1979;291:143–159. doi: 10.1113/jphysiol.1979.sp012804. [DOI] [PMC free article] [PubMed] [Google Scholar]
- Fuglsang A, Khromov A, Torok K, Somlyo AV, Somlyo AP. Flash photolysis studies of relaxation and cross-bridge detachment: higher sensitivity of tonic than phasic smooth muscle to MgADP. Journal of Muscle Research and Cell Motility. 1993;14:666–677. doi: 10.1007/BF00141563. [DOI] [PubMed] [Google Scholar]
- Gimona M, Herzog M, Vandekerckhove J, Small JV. Smooth muscle specific expression of calponin. FEBS Letters. 1990;274:159–162. doi: 10.1016/0014-5793(90)81353-p. [DOI] [PubMed] [Google Scholar]
- Gondo Y, Nakamura K, Nakao T, Sasaoka T, Ito K, Kimura M, Katsuki M. Gene replacement of the p53 gene with the lacZ gene in mouse embryonic stem-cells and mice using two steps of homologous recombination. Biophysical and Biochemical Research Communications. 1994;202:830–837. doi: 10.1006/bbrc.1994.2005. [DOI] [PubMed] [Google Scholar]
- Haeberle JR. Calponin decreases the rate of cross-bridge cycling and increases maximum force production by smooth muscle myosin in an in vitro motility assay. Journal of Biological Chemistry. 1994;269:12424–12431. [PubMed] [Google Scholar]
- Haeberle JR, Hathaway DR, Smith CL. Caldesmon content of mammalian smooth muscles. Journal of Muscle Research and Cell Motility. 1992;13:81–89. doi: 10.1007/BF01738431. [DOI] [PubMed] [Google Scholar]
- Hartshorne DJ. Biochemistry of the contractile proteins in smooth muscle. In: Johnson LR, editor. Physiology of the Gastrointestinal Tract. 2. New York: Raven Press; 1987. pp. 423–482. [Google Scholar]
- Himpens B, Kitazawa T, Somlyo AP. Agonist-dependent modulation of Ca2+-sensitivity in rabbit pulmonary artery smooth muscle. Pflügers Archiv. 1990;417:21–28. doi: 10.1007/BF00370764. [DOI] [PubMed] [Google Scholar]
- Horiuchi KY, Chacko S. The mechanism for the inhibition of actin-activated ATPase of smooth muscle heavy meromyosin by calponin. Biochemical and Biophysical Research Communications. 1991;176:1487–1493. doi: 10.1016/0006-291x(91)90455-g. [DOI] [PubMed] [Google Scholar]
- Horiuti K, Somlyo AV, Goldman YE, Somlyo AP. Kinetics of contraction initiated by flash photolysis of caged adenosine triphosphate in tonic and phasic smooth muscles. Journal of General Physiology. 1989;94:769–781. doi: 10.1085/jgp.94.4.769. [DOI] [PMC free article] [PubMed] [Google Scholar]
- Huxley AF. Muscle structure and theories of contraction. Progress in Biophysics and Biophysical Chemistry. 1957;7:255–318. [PubMed] [Google Scholar]
- Itoh T, Suzuki S, Suzuki A, Nakamura F, Naka M, Tanaka T. Effects of exogenously applied calponin on Ca2+-regulated force in skinned smooth muscle of the rabbit mesenteric artery. Pflügers Archiv. 1994;427:301–308. doi: 10.1007/BF00374538. [DOI] [PubMed] [Google Scholar]
- Jaworowski A, Anderson KI, Arner A, Engstrom M, Gimona M, Strasser P, Small JV. Calponin reduces shortening velocity in skinned taenia coli smooth muscle fibres. FEBS Letters. 1995;365:167–171. doi: 10.1016/0014-5793(95)00451-e. [DOI] [PubMed] [Google Scholar]
- Jensen PE, Gong MC, Somlyo AV, Somlyo AP. Separate upstream and convergent downstream pathways of G-protein- and phorbol ester-mediated Ca2+ sensitization of myosin light chain phosphorylation in smooth muscle. Biochemical Journal. 1996;318:469–475. doi: 10.1042/bj3180469. [DOI] [PMC free article] [PubMed] [Google Scholar]
- Jin JP, Walsh MP, Resek ME, McMartin GA. Expression and epitopic conservation of calponin in different smooth muscles and during development. Biochemistry and Cell Biology. 1996;74:187–196. doi: 10.1139/o96-019. [DOI] [PubMed] [Google Scholar]
- Kake T, Kimura S, Takahashi K, Maruyama K. Calponin induces actin polymerization at low ionic strength and inhibits depolymerization of actin filaments. Biochemical Journal. 1995;312:587–592. doi: 10.1042/bj3120587. [DOI] [PMC free article] [PubMed] [Google Scholar]
- Khromov AS, Somlyo AV, Somlyo AP. Nucleotide binding by actomyosin as a determinant of relaxation kinetics of rabbit phasic and tonic smooth muscle. Journal of Physiology. 1996;492:669–673. doi: 10.1113/jphysiol.1996.sp021336. [DOI] [PMC free article] [PubMed] [Google Scholar]
- Kitazawa T, Kobayashi S, Horiuti K, Somlyo AV, Somlyo AP. Receptor-coupled, permeabilized smooth muscle. Role of the phosphatidylinositol cascade, G-proteins, and modulation of the contractile response to Ca2+ Journal of Biological Chemistry. 1989;264:5339–5342. [PubMed] [Google Scholar]
- Kitazawa T, Takizawa N, Ikebe M, Eto M. Reconstitution of protein kinase C-induced contractile Ca2+ sensitization in Triton X-100-demembranated rabbit arterial smooth muscle. Journal of Physiology. 1999;520:139–152. doi: 10.1111/j.1469-7793.1999.00139.x. [DOI] [PMC free article] [PubMed] [Google Scholar]
- Lehman W. Calponin and the composition of smooth muscle thin filaments. Journal of Muscle Research and Cell Motility. 1991;12:221–224. doi: 10.1007/BF01745110. [DOI] [PubMed] [Google Scholar]
- Maglott DR, Katz KS, Sicotte H, Pruitt KD. NCBI’s Locuslink and RefSeq. Nucleic Acids Research. 2000;28:126–128. doi: 10.1093/nar/28.1.126. [DOI] [PMC free article] [PubMed] [Google Scholar]
- Malmqvist U, Arner A. Correlation between isoform composition of the 17 kDa myosin light chain and maximal shortening velocity in smooth muscle. Pflügers Archiv. 1991;418:523–530. doi: 10.1007/BF00370566. [DOI] [PubMed] [Google Scholar]
- Malmqvist U, Trybus KM, Yagi S, Carmichael J, Fay FS. Slow cycling of unphosphorylated myosin is inhibited by calponin, thus keeping smooth muscle relaxed. Proceedings of the National Academy of Sciences of the USA. 1997;94:7655–7660. doi: 10.1073/pnas.94.14.7655. [DOI] [PMC free article] [PubMed] [Google Scholar]
- Marston SB, Smith CW. The thin filaments of smooth muscles. Journal of Muscle Research and Cell Motility. 1985;6:669–708. doi: 10.1007/BF00712237. [DOI] [PubMed] [Google Scholar]
- Matthew JD, Khromov AS, Trybus KM, Somlyo AP, Somlyo AV. Myosin essential light chain isoforms modulate the velocity of shortening propelled by nonphosphorylated cross-bridges. Journal of Biological Chemistry. 1998;273:31289–31296. doi: 10.1074/jbc.273.47.31289. [DOI] [PubMed] [Google Scholar]
- Mezgueldi M, Fattoum A, Derancourt J, Kassab R. Mapping of the functional domains in the amino-terminal region of calponin. Journal of Biological Chemistry. 1992;267:15943–15951. [PubMed] [Google Scholar]
- Nigam R, Triggle CR, Jin JP. h1- and h2-calponins are not essential for norepinephrine- or sodium fluoride-induced contraction of rat aortic smooth muscle. Journal of Muscle Research and Cell Motility. 1998;19:695–703. doi: 10.1023/a:1005389300151. [DOI] [PubMed] [Google Scholar]
- Nusbaum C, Slonim D, Harris K, Birren B, Steen R, Stein L, Miller J, Dietrich W, Nahf R, Wang V, Merport O, Castle A, Husain Z, Farino G, Gray D, Anderson M, Devine R, Horton L, Ye W, Kouyoumjian V, Zemsteva I, Wu Y, Collymore A, Courtney D, Tam J, Cadman M, Haynes A, Heuston C, Marsland T, Southwell A, Trickett P, Strivens M, Ross M, Makalowski W, Xu Y, Boguski M, Carter N, Denny P, Brown S, Hudson T, Lander E. A YAC-based physical map of the mouse genome. Nature Genetics. 1999;22:388–393. doi: 10.1038/11967. [DOI] [PubMed] [Google Scholar]
- Obara K, Szymanski PT, Tao T, Paul RJ. Effects of calponin on isometric force and shortening velocity in permeabilized taenia coli smooth muscle. American Journal of Physiology. 1996;270:C481–487. doi: 10.1152/ajpcell.1996.270.2.C481. [DOI] [PubMed] [Google Scholar]
- Parker CA, Takahashi K, Tang JX, Tao T, Morgan KG. Cytoskeletal targeting of calponin in differentiated, contractile smooth muscle cells of the ferret. Journal of Physiology. 1998;508:187–198. doi: 10.1111/j.1469-7793.1998.187br.x. [DOI] [PMC free article] [PubMed] [Google Scholar]
- Parker CA, Takahashi K, Tao T, Morgan KG. Agonist-induced redistribution of calponin in contractile vascular smooth muscle cells. American Journal of Physiology. 1994;267:C1262–1270. doi: 10.1152/ajpcell.1994.267.5.C1262. [DOI] [PubMed] [Google Scholar]
- Payne AM, Yue P, Pritchard K, Marston SB. Caldesmon mRNA splicing and isoform expression in mammalian smooth-muscle and non-muscle tissues. Biochemical Journal. 1995;305:445–450. doi: 10.1042/bj3050445. [DOI] [PMC free article] [PubMed] [Google Scholar]
- Ruegg JC. Smooth muscle tone. Physiological Reviews. 1971;51:201–248. doi: 10.1152/physrev.1971.51.1.201. [DOI] [PubMed] [Google Scholar]
- Samaha FF, Ip HS, Morrisey EE, Seltzer J, Tang Z, Solway J, Parmacek MS. Developmental pattern of expression and genomic organization of the calponin-h1 gene. A contractile smooth muscle cell marker. Journal of Biological Chemistry. 1996;271:395–403. doi: 10.1074/jbc.271.1.395. [DOI] [PubMed] [Google Scholar]
- Shirinsky VP, Biryukov KG, Hettasch JM, Sellers JR. Inhibition of the relative movement of actin and myosin by caldesmon and calponin. Journal of Biological Chemistry. 1992;267:15886–15892. [PubMed] [Google Scholar]
- Sjuve R, Haase H, Morano I, Uvelius B, Arner A. Contraction kinetics and myosin isoform composition in smooth muscle from hypertrophied rat urinary bladder. Journal of Cellular Biochemistry. 1996;63:86–93. doi: 10.1002/(SICI)1097-4644(199610)63:1%3C86::AID-JCB7%3E3.0.CO;2-W. [DOI] [PubMed] [Google Scholar]
- Somlyo AP. Myosin isoforms in smooth muscle: how may they affect function and structure? Journal of Muscle Research and Cell Motility. 1993;14:557–563. doi: 10.1007/BF00141552. [DOI] [PubMed] [Google Scholar]
- Somlyo AP, Somlyo AV. Flash photolysis studies of excitation-contraction coupling, regulation, and contraction in smooth muscle. Annual Review of Physiology. 1990;52:857–874. doi: 10.1146/annurev.ph.52.030190.004233. [DOI] [PubMed] [Google Scholar]
- Somlyo AP, Somlyo AV. Signal transduction and regulation in smooth muscle. Nature. 1994;372:231–236. doi: 10.1038/372231a0. [DOI] [PubMed] [Google Scholar]
- Somlyo AP, Somlyo AV. Signal transduction by G-proteins, Rho-kinase and protein phosphatase to smooth muscle and non-muscle myosin II. Journal of Physiology. 2000;522:177–185. doi: 10.1111/j.1469-7793.2000.t01-2-00177.x. [DOI] [PMC free article] [PubMed] [Google Scholar]
- Szymanski PT, Tao T. Interaction between calponin and smooth muscle myosin. FEBS Letters. 1993;334:379–382. [PubMed] [Google Scholar]
- Takahashi K, Hiwada K, Kokubu T. Isolation and characterization of a 34,000-dalton calmodulin- and F-actin-binding protein from chicken gizzard smooth muscle. Biochemical and Biophysical Research Communications. 1986;141:20–26. doi: 10.1016/s0006-291x(86)80328-x. [DOI] [PubMed] [Google Scholar]
- Takahashi K, Hiwada K, Kokubu T. Occurrence of anti-gizzard P34K antibody cross-reactive components in bovine smooth muscles and non-smooth muscle tissues. Life Sciences. 1987;41:291–296. doi: 10.1016/0024-3205(87)90151-2. [DOI] [PubMed] [Google Scholar]
- Takahashi K, Hiwada K, Kokubu T. Vascular smooth muscle calponin. A novel troponin T-like protein. Hypertension. 1988;11:620–626. doi: 10.1161/01.hyp.11.6.620. [DOI] [PubMed] [Google Scholar]
- Uyama Y, Imaizumi Y, Watanabe M, Walsh MP. Inhibition by calponin of isometric force in demembranated vascular smooth muscle strips: the critical role of serine-175. Biochemical Journal. 1996;319:551–558. doi: 10.1042/bj3190551. [DOI] [PMC free article] [PubMed] [Google Scholar]
- Walsh MP. Calcium-dependent mechanisms of regulation of smooth muscle contraction. Biochemistry and Cell Biology. 1991;69:771–800. doi: 10.1139/o91-119. [DOI] [PubMed] [Google Scholar]
- Winder SJ, Allen BG, Clement-Chomienne O, Walsh MP. Regulation of smooth muscle actin-myosin interaction and force by calponin. Acta Physiologica Scandinavica. 1998;164:415–426. doi: 10.1111/j.1365-201x.1998.tb10697.x. [DOI] [PubMed] [Google Scholar]
- Winder SJ, Walsh MP. Smooth muscle calponin. Inhibition of actomyosin MgATPase and regulation by phosphorylation. Journal of Biological Chemistry. 1990;265:10148–10155. [PubMed] [Google Scholar]
- Yoshikawa H, Taniguchi SI, Yamamura H, Mori S, Sugimoto M, Miyado K, Nakamura K, Nakao K, Katsuki M, Shibata N, Takahashi K. Mice lacking smooth muscle calponin display increased bone formation that is associated with enhancement of bone morphogenetic protein responses. Genes to Cells. 1998;3:685–695. doi: 10.1046/j.1365-2443.1998.00214.x. [DOI] [PubMed] [Google Scholar]