

Abstract
We have investigated the mechanisms responsible for the changes of systolic Ca2+ that occur in voltage-clamped rat ventricular myocytes during acidosis produced by application of the weak acid butyrate (30 mM). Intracellular pH regulation was inhibited with dimethylamiloride (bicarbonate-free solution).
The application of butyrate produced an intracellular acidification of 0.33 pH units. This was accompanied by a decrease in systolic Ca2+ to about 50 % of control. However, within 2 min, systolic Ca2+ returned to control levels.
The decrease in systolic Ca2+ was accompanied by a decrease in the Na+-Ca2+ exchange current observed on repolarisation so that the calculated Ca2+ efflux on Na+-Ca2+ exchange was less than the entry on the L-type Ca2+ current. The magnitude of the Na+-Ca2+ exchange current recovered along with systolic Ca2+ until it equalled the Ca2+ entry on the L-type Ca2+ current.
From the measurement of Ca2+ fluxes, it was calculated that, during acidosis, the cell gains 121.6 ± 16.2 μmol l−1 of Ca2+. This is equal to the measured increase of sarcoplasmic reticulum (SR) calcium content obtained by applying caffeine (20 mM) and integrating the resulting Na+-Ca2+ exchange current.
We conclude that the recovery of the amplitude of the systolic Ca2+ transient is due to decreased SR calcium release, resulting in reduced Ca2+ efflux from the cell leading to increased SR calcium content.
Acidosis causes a rapid decrease in the contraction of cardiac muscle (Gaskell, 1880; Allen & Orchard, 1983). This is largely due to a decrease in the sensitivity of the contractile proteins to Ca2+ since the decrease of contraction can be accompanied by no change or even an increase in the magnitude of the systolic Ca2+ transient (Allen & Orchard, 1983; Orchard & Kentish, 1990). In addition, acidosis inhibits the ryanodine receptor (Xu et al. 1996), decreasing its sensitivity to trigger Ca2+ (Kentish & Xiang, 1997; Hulme & Orchard, 1998) so that Ca2+ release from the sarcoplasmic reticulum (SR) is depressed (Orchard et al. 1987; Orchard, 1987), which also contributes to the decrease in contractility (Orchard, 1987).
Following the initial decrease, there is often a partial recovery in the amplitude of contraction as a consequence of an increase in the systolic Ca2+ transient. This increase is associated with an increase in SR calcium content (Hulme & Orchard, 1998). This is unexpected, because measurements in intact cells show that the L-type Ca2+ current (ICa) does not change during acidosis (Hulme & Orchard, 1998), while SR calcium uptake is inhibited (Fabiato & Fabiato, 1978), which would be expected to decrease SR calcium content. One explanation is that an increase in intracellular [H+] activates Na+-H+ exchange, which increases intracellular [Na+]; this alters Na+-Ca2+ exchange activity (Bountra & Vaughan-Jones, 1989), causing an increase in intracellular [Ca2+] and SR calcium content. The increase in SR calcium content increases the amplitude of the Ca2+ transient despite the direct inhibitory effects of acidosis on SR calcium release (Hulme & Orchard, 1998). However, all experiments to date have only used qualitative estimates of SR calcium content using the increase in cytoplasmic [Ca2+] produced by caffeine, which might be distorted by acidosis-induced changes in cytoplasmic buffering.
Another possible explanation for the increase in SR calcium content is that described for other inhibitors of SR calcium release such as tetracaine (Overend et al. 1997, 1998; Györke et al. 1997). This hypothesis proposes that acidosis-induced inhibition of the ryanodine receptor (Xu et al. 1996) and hence of Ca2+-induced Ca2+ release (CICR; Kentish & Xiang, 1997) initially decreases SR calcium release. This results in an increase in SR calcium content and hence in a recovery of SR calcium release and the amplitude of the systolic Ca2+ transient towards control levels (even in the presence of a constant Ca2+ trigger and inhibition of the ryanodine receptor). In support of this hypothesis, the reported effects of acidosis on SR calcium release are similar to those of tetracaine: (i) inhibition of CICR (Fabiato & Fabiato, 1978; Kentish & Xiang, 1997); (ii) initial decrease and subsequent recovery of the amplitude of the Ca2+ transient during electrical stimulation (Harrison et al. 1992); (iii) increased SR calcium content (Harrison et al. 1992; Hulme & Orchard, 1998).
In the present study we have investigated whether this mechanism can play a role in the recovery of the Ca2+ transient observed during acidosis, by making quantitative measurements of sarcolemmal Ca2+ fluxes and SR calcium content during acidosis in the presence of an inhibitor of Na+-H+ exchange. The results show that the recovery of the amplitude of the Ca2+ transient is, indeed, accompanied by an increase of SR content due to inhibition of ryanodine receptor opening.
METHODS
Experiments were performed on single cardiac ventricular myocytes obtained from rats killed by stunning and cervical dislocation (Trafford et al. 1997).
Intracellular [Ca2+]i measurements
[Ca2+]i was measured as described previously, using epifluorescence microscopy with indo-1 (O’Neill et al. 1990). Indo-1 (Molecular Probes, OR, USA) was loaded as the cell-permeant acetoxymethyl ester (2.5 μM for 10 min). Cells were left for at least 30 min to allow dye de-esterification to occur before being placed in a recording chamber on the stage of an inverted microscope. Indo-1 was excited at 340 nm and the emitted fluorescence was measured at 400 and 500 nm.
The ratio of fluorescence emitted at 400 to that emitted at 500 nm was used as a measure of intracellular [Ca2+]. Calibration in terms of absolute values of [Ca2+]i was done using an in vitro calibration. The calibration parameters, Rmin, Rmax and β were determined as previously described (Grynkiewicz et al. 1985). In some cells, at the end of experiments, Rmin was measured in vivo by superfusing the cell with a calcium-free solution. Once a stable Rmin was obtained, the superfusing solution was switched to 5 mM Ca2+-containing solution and the cell was damaged by rupturing the cell membrane with the patch pipette and Rmax was obtained. The Rmin and Rmax values established in this manner were in close agreement with those determined in vitro. It must be recognised that, due to factors such as incomplete de-esterification (Luckhoff, 1986) and non-cytoplasmic location of some of the indicator (Highsmith et al. 1986) the use of an in vitro technique will not give precise measurements. For the present purposes, however, our major concern is that the values should be comparable within an experiment. In this context, a significant concern is that indo-1 fluorescence is sensitive to changes of pHi. The major effect is that acidosis increases the apparent Kd for Ca2+ binding to indo-1 with little effect on the maximum and minimum fluorescence (Lattanzio & Bartschat, 1991). Replotting their data shows that the apparent Kd for Ca2+ for indo-1 is a linear function of [H+] such that:
(where both Kd and [H+] are in nanomolar) and this equation has been used to correct for changes of pH.
Intracellular pH measurements
Changes in intracellular pH were measured as previously described using epifluorescence microscopy with SNARF-1 (Buckler & Vaughan-Jones, 1990). SNARF-1 (Molecular Probes) was loaded as the cell-permeant acetoxymethyl ester (2.5 μM for 30 min). Cells were left for at least 30 min to allow dye de-esterification to occur. SNARF-1 was excited at 540 nm and the emitted fluorescence was measured at 580 and 640 nm. The ratio of fluorescence emitted at 580 to that emitted at 640 nm was used as a measure of intracellular pH. The signal was calibrated in vitro using the free acid form of carboxy-SNARF-1. The calibration solution contained (mM): KCl, 140; MgSO4, 1.2; KH2PO4, 1.2; Hepes, 10; carboxy-SNARF-1, 0.02. pH was adjusted with KOH to 5.5, 6.0, 6.5, 7.0, 7.5, 8.0 and 8.5. Calibration parameters, pKa, Rmin, Rmax were determined as described before (Buckler & Vaughan-Jones, 1990).
Voltage clamp measurements
Voltage clamp control was achieved using the perforated patch technique (Horn & Marty, 1988) with amphotericin B. Due to the relatively high access resistance of the perforated patch we used the switch clamp facility of the Axoclamp 2B voltage clamp amplifier (Axon Instruments, CA, USA). Pipettes (1-3 MΩ) were filled with the following solution (mM): KCH3O3S, 125; KCl, 20; NaCl, 10; Hepes, 10; MgCl2, 5; titrated to pH 7.2 with KOH (final amphotericin concentration 240 μg ml−1). To reduce interference from outward currents, all voltage clamp experiments were done in the presence of 5 mM 4-aminopyridine and 0.1 mM BaCl2. Cells were bathed in a control solution of the following composition (mM): NaCl, 135; KCl, 4; Hepes, 10; glucose, 11; CaCl2, 0.5; MgCl2, 1 titrated to pH 7.4 with NaOH. All experiments were carried out at 23°C and in the presence of 20 μM dimethylamiloride (DMA) to inhibit Na+-H+ exchange. Intracellular acidosis was produced by the addition of 30 mM sodium butyrate (at constant external pH) to the bathing solution (substituted for NaCl). All data were digitised at 2 kHz using pCLAMP (Axon Instruments) and stored for subsequent analysis.
Measurement of SR calcium content and sarcolemmal Ca2+ influx and efflux
The SR calcium content was quantified in voltage-clamped cells by discharging SR calcium with 20 mM caffeine; 20 mM rather than 10 mM caffeine was used to ensure that all SR calcium was released even if acidosis decreased ryanodine receptor opening. The resulting Na+-Ca2+ exchange current was integrated as described previously (Varro et al. 1993). Ca2+ efflux during the systolic Ca2+ transient was measured from the integral of the Na+-Ca2+ exchange current upon repolarisation (Varro et al. 1993; Trafford et al. 1997). Integration was begun at the end of the capacity current upon repolarisation. The baseline current was measured after [Ca2+]i had fully recovered.
When quantifying SR calcium content and Ca2+ efflux, it is necessary to correct for that fraction of the efflux that is not produced by Na+-Ca2+ exchange and then relate the fluxes to cell volume. This is done by measuring the rate constant of decay of the caffeine response (i) under control conditions (kcont) and (ii) with the Na+-Ca2+ exchange inhibited by 10 mM Ni2+ (kNi). Multiplying the flux by kcont/(kcont – kNi) gives the corrected flux. As described in Results, this correction was obtained at both normal and acid pH. This correction assumes that the fractional contributions of Na+-Ca2+ exchange and sarcolemmal Ca2+-ATPase are constant over the range of [Ca2+]i encountered. Evidence supporting this has been published previously (Lamont & Eisner, 1996; Choi et al. 2000). Ca2+ influx on the L-type Ca2+ current was measured by integrating the Ca2+ current from the end of the capacity current upon depolarisation until the end of the pulse. The zero current level was taken as the current level 200 ms before depolarisation. Cell volume was calculated from the cell membrane capacitance and then converted to volume taking a value of 6.76 pF pl−1 (Satoh et al. 1996). It should be noted that, as in our previous work, the SR calcium content and Ca2+ efflux are expressed in relation to total cell volume and not SR or accessible cell volume.
Measurement of Ca2+ buffering and total calcium
This was done as described previously (Trafford et al. 1999). Briefly, Ca2+ is released from the SR using 20 mM caffeine. The corrected integral (see above) of the resulting Na+-Ca2+ exchange current gives a measure of changes of total calcium which can then be related to the simultaneously recorded free Ca2+. The buffering curve can then be used to calculate changes of total calcium from those of free Ca2+ in the same cell. Since this method provides no direct information about buffering properties at levels of [Ca2+]i below the resting level, we have expressed total calcium measurements in terms of changes above resting.
Statistics
All data are presented as the mean ± standard error of the mean for n cells. Unless otherwise indicated tests of significance have been performed using a paired t test.
RESULTS
The effect of acidosis on the systolic Ca2+ transient
In initial experiments (not shown) we found that the application of butyrate (30-60 mM) resulted in an immediate decrease of systolic [Ca2+]i followed by a recovery over the next minute. One possible explanation of this recovery (see Introduction) is that Na+-dependent pHi-regulating mechanisms produce an increase of [Na+]i which, in turn, increases SR calcium content. In order to investigate this possibility, we have performed experiments in which Na+-H+ exchange is inhibited with DMA. Since the experiments were also carried out in HCO3−-free solutions, recovery from acid loads would have been inhibited completely (Lagadic-Gossman et al. 1992).
Figure 1 shows the effects of 30 mM butyrate on intracellular pH (top) and intracellular Ca2+ transients (bottom) in representative ventricular myocytes stimulated at 0.2 Hz in the presence of the Na+-H+ exchange inhibitor DMA (20 μM). Butyrate caused a rapid decrease in intracellular pH from 7.35 to 6.87. On average (n = 6), pHi decreased from 7.25 ± 0.026 to 6.91 ± 0.07, a decrease of 0.334 ± 0.062 pH units. This acidification was sustained for the period of exposure to the acid (up to 3 min). The amplitude of the intracellular Ca2+ transient initially decreased in response to this acidosis, but recovered to control levels during continued exposure to butyrate. On washout, intracellular Ca2+ increased to levels greater than control, before recovering to the control level. Thus a sustained decrease in intracellular pH produced only a transient change in the amplitude of the Ca2+ transient. On average, the smallest Ca2+ transient in butyrate was 0.46 ± 0.04 μM, compared to 0.90 ± 0.09 μM in control (n = 7, P < 0.01). In the steady state in butyrate, the amplitude of the Ca2+ transient was 0.97 ± 0.10 μM, which was not significantly different from control (n = 7, P > 0.25). We have also looked at the rate constant of decay of the systolic Ca2+ transient. On average (n = 6), the rate constant of decay was 1.53 ± 0.18 s−1 in control and 1.56 ± 0.20 s−1 in the steady state in butyrate. These values are not significantly different (P > 0.4). This finding differs from previous work which has found a slowing of the decay attributed to inhibition of the SR Ca2+-ATPase (Hulme & Orchard, 1998).
Figure 1. The effect of butyrate (30 mM) on pHi (top) and [Ca2+]i (bottom) in representative rat ventricular myocytes.
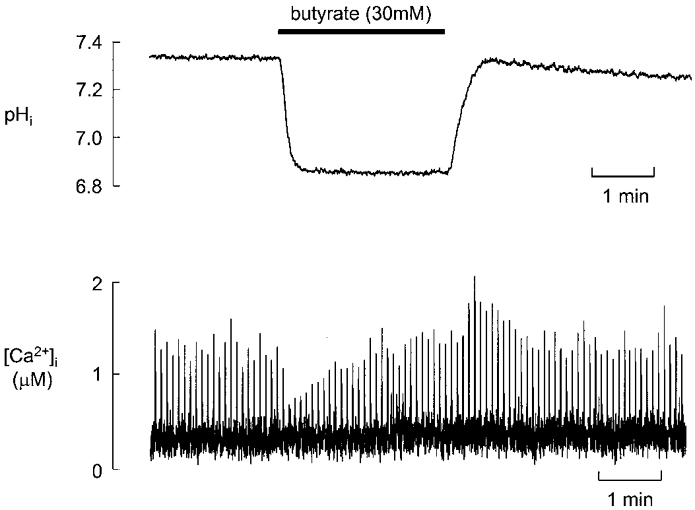
The cells were field stimulated at 0.2 Hz and exposed to butyrate for 2 min as shown above the traces. Different cells were used for the pH and [Ca2+]i measurements. In this (and all other) figures dimethylamiloride (20 μM) was present throughout to inhibit Na+-H+ exchange.
The effect of acidosis on transmembrane Ca2+ flux
In order to estimate Ca2+ efflux from the Na+-Ca2+ exchange current (INa-Ca), it is necessary to determine the fraction of the Ca2+ extruded from the cell that is carried by the electroneutral sarcolemmal Ca2+-ATPase (see Methods). This was estimated by determining the effect of inhibiting the Na+-Ca2+ exchanger, using Ni2+, on the rate of decline of the caffeine-induced Ca2+ transient. At control pH, Ni2+ decreased the rate constant of decline of the caffeine-induced Ca2+ transient from 0.191 ± 0.019 s−1 to 0.041 ± 0.004 s−1 which is 22.4 ± 1.7 % (n = 6) of control, suggesting that this percentage of the total calcium efflux is via the ATPase. This decreased to 14.5 ± 1.9 % during acidosis, from 0.113 ± 0.005 s−1 to 0.016 ± 0.002 s−1. That is, the ATPase was inhibited by acidosis to a greater extent than the Na+-Ca2+ exchanger. Therefore the total calcium flux in control (Na+-Ca2+ plus Ca2+-ATPase) is 1.3 times the flux through Na+-Ca2+ exchange whereas during acidosis the value is 1.16.
To investigate the mechanisms underlying the changes in the Ca2+ transient shown in Fig. 1, the effect of acidosis on Ca2+ influx (via ICa) and efflux (via INa-Ca) was investigated during 100 ms voltage clamp pulses from -40 to 0 mV at a frequency of 0.2 Hz (short pulses were used to minimise Ca2+ efflux during the clamp pulse). The top trace in Fig. 2A shows the time course of change of the Ca2+ transient. Representative Ca2+ transients are shown in Fig. 2B (top) along with their associated membrane currents (middle) and integrated Ca2+ movements (bottom). The current records show the L-type Ca2+ current on depolarisation and a Na+-Ca2+ exchange current on repolarisation. The Na+-Ca2+ exchange current can be seen more easily on the expanded trace in the inset. For the control case the Ca2+ influx and efflux are equal and the integral therefore returns to resting levels (trace a). In contrast, record b (obtained after 10 s at low pH) shows a small decrease in the amplitude and rate of inactivation of the L-type Ca2+ current and a profound decrease of Ca2+ efflux (see inset). This results in a calculated net gain of Ca2+. After 150 s exposure to butyrate (trace c) there was a small recovery in the amplitude of ICa, although the rate of inactivation remained slow. The Ca2+ transient had recovered to control levels. This was accompanied by an increase in tail current such that the corrected efflux now equals influx. On returning to control pH, the amplitude and time course of ICa and therefore its integral returned to control. However, there was a large increase in the amplitude of the Ca2+ transient and tail current such that transiently the efflux was larger than the influx (trace d). It seems likely that the change in the Ca2+ transient is due to an imbalance between Ca2+ influx and efflux causing an increase in the SR calcium content of the cell during acidosis. Mean data for the immediate and steady state effects, as well as the recovery data are given in Table 1.
Figure 2. The effect of butyrate on transmembrane Ca2+ fluxes.
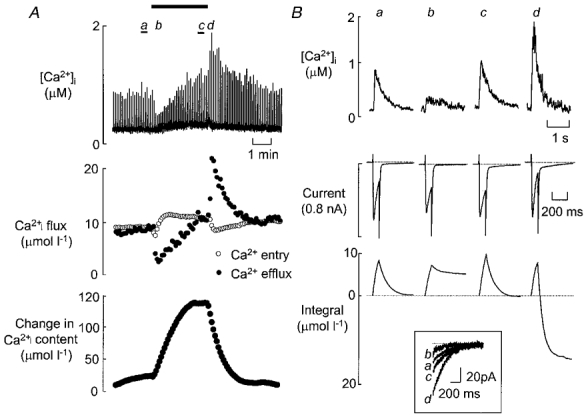
A, time course. The top trace shows measurements of [Ca2+]i. The middle trace shows the calculated Ca2+ movements per pulse calculated from the L-type Ca2+ current (○) and Na+-Ca2+ exchange (•). The bottom trace shows the calculated change of cell calcium content obtained by summing the fluxes. Pulses 100 ms in duration were applied from -40 to 0 mV at 0.2 Hz. Butyrate (30 mM) was applied for the time shown by the horizontal bar. B, specimen traces obtained at the times indicated on A. From top to bottom, traces show: [Ca2+]i, membrane current, integrated calcium movement. An upward deflection on the integral trace represents Ca2+ entry and a downward one, Ca2+ exit. The inset at the bottom shows the current on repolarisation.
Table 1.
Mean data for the effects of butyrate
| Control | Butyrate | Recovery | ||
|---|---|---|---|---|
| Initial effect | Steady state | |||
| Peak amplitude of Ca2+ current (pA) | 641 ± 48 | 559 ± 87** | 588 ± 92** | 629 ± 44 |
| Half time of inactivation of Ca2+ current (ms) | 23.2 ± 1.5 | 28.6 ± 2.1** | 31.0 ± 2.2** | 24.0 ± 1.3 |
| Ca2+ entry through Ca2+ current (μmol 1−1) | 7.03 ± 0.71 | 6.38 ± 0.053* | 8.66 ± 0.85* | 7.40 ± 0.66 |
| Ca2+ efflux through Na+-Ca2+ exchange (μmol 1−1) | 7.26 ± 0.64 | 2.18 ± 0.20** | 7.99 ± 0.69 | 7.36 ± 0.56 |
| Amplitude of systolic Ca2+ transient (μm) | 0.90 ± 0.09 | 0.46 ± 0.04** | 0.97 ± 0.10 | 0.88 ± 0.09 |
All data are means (± s.e.m.) from 7 cells. Significance is shown with respect to the control values (paired t test)
P < 0.05
P < 0.01. Other values are not significantly different from control.
The lower traces of Fig. 2A show beat to beat changes in the Ca2+ influx (ICa) and efflux (tail current, corrected for Ca2+ efflux via the electroneutral Ca2+-ATPase) integrals before, during and after exposure to butyrate, and the expected change in cell Ca2+ content, calculated from the difference between the influx and efflux integrals. This shows that before acidosis the cell was in a steady state, with no net gain or loss of Ca2+. On exposure to acidosis the Ca2+ content of the cell increased as a consequence of the initial decrease of Ca2+ efflux (above). As the Ca2+ content increased the amplitude of the systolic Ca2+ transient also increased until (after 2 min exposure to butyrate) Ca2+ efflux again equalled influx. On removal of the acidosis, the increased systolic Ca2+ transient produced greater Ca2+ efflux and thus a decrease of Ca2+ content until it regained a steady state. These changes of sarcolemmal fluxes predict an increase of cell Ca2+ content (bottom trace) of 121.6 ± 16.2 μmol l−1 (n = 6 cells). Subsequent experiments were designed, therefore, to obtain direct measurements of SR calcium content.
The effect of acidosis on SR calcium content and release
SR calcium content was determined using caffeine, as described in the Methods. Figure 3A shows the rise in cytoplasmic [Ca2+]i produced by caffeine (top), the Na+-Ca2+ exchange current (middle) and its integral corrected for extrusion via the sarcolemmal Ca2+-ATPase. Both the increase of [Ca2+]i and the integral of the Na+-Ca2+ exchange current were increased by exposure to butyrate. In six cells, SR calcium content increased from 91.1 ± 11.3 to 216.1 ± 10.9 μmol l−1 (P < 0.01) after 2 min exposure to butyrate. The mean increase of SR calcium content was 125.0 ± 13.9 μmol l−1. This is not significantly different (P > 0.43) from the increase estimated from the difference in influx and efflux integrals, for example as shown in Fig. 2, which gave an estimated increase of 121.6 ± 16.2 μmol l−1.
Figure 3. The effect of butyrate on sarcoplasmic reticulum calcium content.
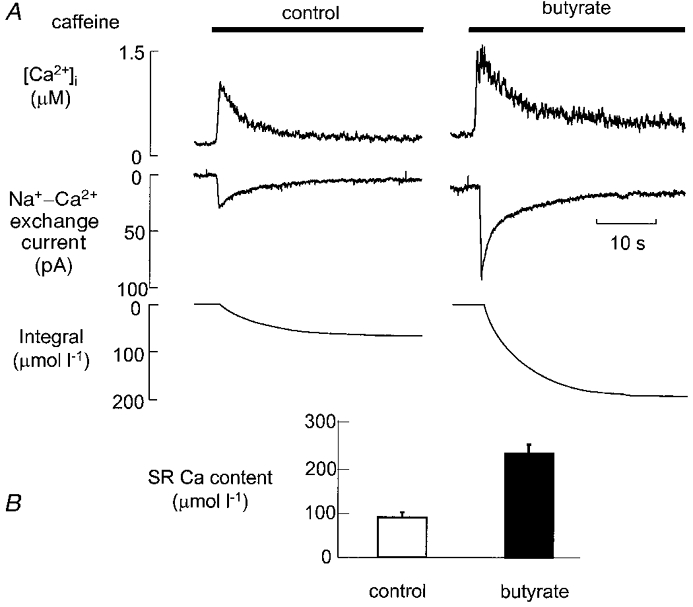
A, original data. Traces show, from top to bottom: [Ca2+]i, Na+-Ca2+ exchange current, and the integral of the Na+-Ca2+ exchange current. Caffeine was applied as shown by the horizontal bars. For the right-hand record butyrate (30 mM) was applied 2 min before the record began. B, mean data (6 cells) showing the effects of butyrate on SR calcium content.
The experiments described above show that acidosis produces an initial decrease of systolic Ca2+. There are two possible explanations for this decrease. (1) It could result from a decrease in the Ca2+ release from the SR, possibly due to a pH-dependent decrease of open probability of the ryanodine receptor (RyR; Xu et al. 1996). (2) It would also result if the cytoplasmic Ca2+ buffering power were to be increased by acidosis. This could occur if, for example, the Ca2+ affinity of high affinity buffers, which are saturated at resting [Ca2+]i, was decreased such that they could contribute to buffering. These two hypotheses can be distinguished by comparing the effects of acidosis on the systolic and caffeine-evoked Ca2+ release. On hypothesis (2) both these responses should be depressed by acidosis whereas, on (1), so long as all SR calcium is released, there is no reason to expect the caffeine response to be depressed. The experiment of Fig. 4 shows that, even when butyrate has decreased systolic [Ca2+]i to approximately 50 % of its initial value, the caffeine response is unaffected. The integrals of the Na+-Ca2+ exchange current show that the total amount of Ca2+ released by caffeine is not affected by acidosis. On average, in five experiments, butyrate decreased the systolic Ca2+ transient to 49 ± 3 % of control whereas the caffeine response was unaffected (102 ± 4 % of control; P > 0.5). The total amount of calcium released from the SR was also unaffected (113 ± 11 % of control; P > 0.2). This experiment therefore supports the hypothesis that the initial decrease in systolic [Ca2+]i produced by acidosis is due to a decreased release of Ca2+ from the SR. A quantitative measurement of Ca2+ buffering power is shown in Fig. 4C. The buffer curves were obtained from the records of Fig. 4B as described previously (Trafford et al. 1999). This shows that intracellular acidification has no effect on Ca2+ buffering. In five cells acidification for 10 s produced a small increase in the amplitude of the caffeine-evoked increase in [Ca2+]i (from 0.98 ± 0.06 to 1.15 ± 0.06 μM, P < 0.02), with no significant effect on the change in total calcium (115 ± 21 to 124 ± 20 μmol l−1). A rough measure of the mean buffering power can be obtained by dividing the change in total calcium (μmol l−1) by that in free Ca2+ (μM), which gives 121 ± 28 in control and 109 ± 19 after 10 s exposure to butyrate (P > 0.3). We therefore conclude that intracellular buffering power is not affected by butyrate and that changes of the amplitude of systolic [Ca2+]i reflect changes of SR calcium release.
Figure 4. Comparison of the effects of butyrate on systolic and caffeine-evoked Ca2+ transients.
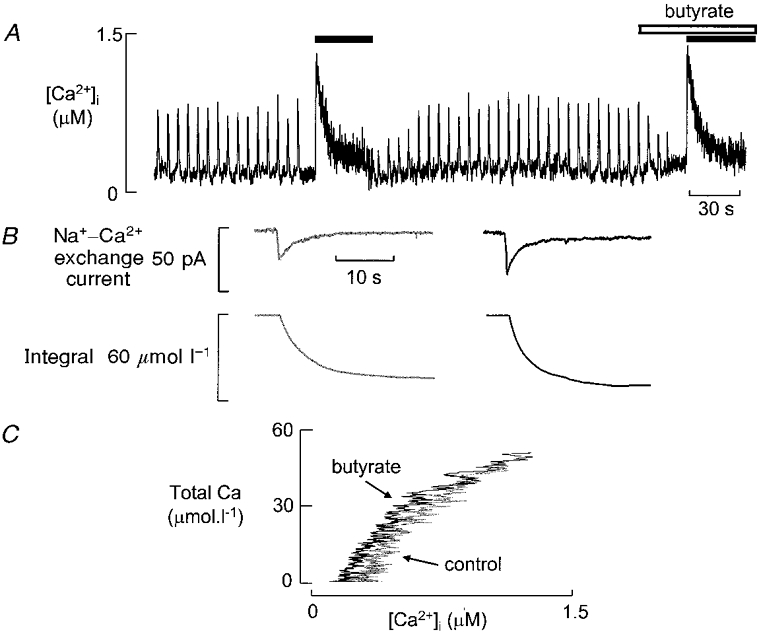
A, time course of effects on [Ca2+]i. The cell was stimulated with 100 ms duration depolarising pulses from -40 to 0 mV applied at 0.2 Hz. Stimulation was discontinued while caffeine was applied (black bar). Butyrate (30 mM) was applied for 20 s (open bar) before and during the second caffeine response. B, Na+-Ca2+ exchange current (top) and integral (bottom) produced by caffeine in control (left) and butyrate (right). C, Ca2+ buffering curves obtained in control and butyrate.
DISCUSSION
The data described in the present paper are compatible with the hypothesis that, in the absence of Na+-H+ exchange, the acidosis-induced changes in the amplitude of the Ca2+ transient are due to the following mechanism. (1) Acidosis-induced inhibition of CICR (Kentish & Xiang, 1997; Hulme & Orchard, 1998; Balnave & Vaughan-Jones, 2000) causes an initial decrease in the amplitude of the Ca2+ transient. (2) This results in decreased Ca2+ efflux from the cell (to a value less than the Ca2+ entry) and hence an increase in the Ca2+ content of the SR, which underlies the subsequent recovery of the Ca2+ transient. (3) SR calcium content and the Ca2+ transient increase until a new steady state is reached and Ca2+ efflux again matches influx. Because Ca2+ influx is relatively unchanged during acidosis, this occurs at the same Ca2+ transient amplitude as in control. Thus, when this steady state is reached, the inhibitory effect of acidosis on CICR is offset by an increase in SR calcium content. Therefore the same amount of Ca2+ is released as at control pH, although fractional release has decreased (Hulme & Orchard, 1998).
On returning to control pH, the Ca2+ transient increased markedly, before returning to control levels. This can be explained by the removal of the acidosis-induced inhibition of CICR while the SR has an increased Ca2+ content, resulting in a larger Ca2+ transient. However this large transient will stimulate Ca2+ efflux via the Na+-Ca2+ exchanger, causing the cell, and hence the SR, to lose Ca2+, and recover to control levels (i.e. the reverse of the events that occur during acidosis).
The above mechanism is identical to that presented previously to explain the fact that tetracaine (which decreases the open probability of the RyR; Xu et al. 1993) also produces a transient decrease in systolic Ca2+ (Overend et al. 1998). It is a further example of the observation that manoeuvres which affect the RyR have no maintained effects on systolic Ca2+ (Eisner et al. 1998; Trafford et al. 2000).
It is useful to compare the pH dependence of the systolic Ca2+ transient with that of the isolated RyR. In the present experiments acidification from pH 7.25 to 6.91 produced a twofold increase in SR calcium content and this was accompanied by the recovery of the systolic Ca2+ transient back to control levels. The initial Ca2+ transient in acid was about 50 % of that in control. Work on isolated cardiac RyRs found that a decrease in pH from 7.3 to 6.5 (i.e. more than twice that recorded in the present experiments) was required to decrease the open probability of the RyR twofold (Xu et al. 1996). This suggests that either the ryanodine receptor is more sensitive to pH in the cell or, alternatively, that perhaps due to Ca2+ from the SR feeding back on the release site (Spencer & Berlin, 1997), there is a non-linear relationship between the properties of individual ryanodine receptors and the net flux.
Previous studies of the effects of acidosis on SR calcium content have used the increase in cytoplasmic Ca2+ produced by caffeine as a qualitative index of an increase in SR calcium content (Harrison et al. 1992; Hulme & Orchard, 1998). As well as being qualitative, this method suffers potentially from uncertainties due to possible changes in cytoplasmic Ca2+ buffering. In the present work we present quantitative measurements of SR calcium and Ca2+ buffering. We also show that the measured increase in SR calcium content can be explained quantitatively by the changes in Na+-Ca2+ exchange current on repolarisation.
In this paper we have concentrated on the effects of acidosis on the RyR. It is important to note that other cellular properties will also be affected. We found only small effects on Ca2+ entry through the L-type Ca2+ current. This lack of any major effect is consistent with previous work using the perforated patch technique in cardiac muscle (Hulme & Orchard, 1998) but not with work using whole-cell techniques (Kurachi, 1982; Irisawa & Sato, 1986) (see Hulme & Orchard (1998) for a discussion of this point). At least as judged by the lack of effect on the rate constant of decay of the systolic Ca2+ transient, there is little effect on Ca2+ uptake into the SR. This contrasts with previous work showing a slowing of the rate of decay (Hulme & Orchard, 1998). Acidification decreased the rate of decay of the caffeine response, indicating a decrease in the rate of Ca2+ removal from the cell. One might expect that this would produce a maintained increase in the magnitude of the systolic Ca2+ transient. It is possible that this effect is lost in the inter-cell variability.
The above analysis can explain the recovery of the Ca2+ transient to control levels during acidosis when the Na+-H+ exchanger is inhibited, as in the present experiments. However, physiologically it is likely that the activity of this exchanger would modify the observed response. In particular, activation of this exchanger during acidosis, and the increase in [Na+]i and subsequent (via Na+-Ca2+ exchange) increase in [Ca2+]i (see Introduction) would be expected to increase the Ca2+ content of the cell further so that the amplitude of the Ca2+ transient would be expected to increase above control levels during acidosis (Bountra & Vaughan-Jones, 1989; Harrison et al. 1992). Nevertheless, inhibition of Ca2+ release through the RyR will make a major contribution to the increase in SR calcium content in acidosis.
In conclusion, the results of this paper show that both the initial decrease in the amplitude of the Ca2+ transient and its recovery to control levels can be explained by a single subcellular action: decreased opening of the RyR.
Acknowledgments
The authors would like to thank the British Heart Foundation and the Wellcome Trust for their support.
References
- Allen DG, Orchard CH. The effects of changes of pH on intracellular calcium transients in mammalian cardiac muscle. The Journal of Physiology. 1983;335:555–567. doi: 10.1113/jphysiol.1983.sp014550. [DOI] [PMC free article] [PubMed] [Google Scholar]
- Balnave CD, VaughanJones RD. Effect of intracellular pH on spontaneous Ca2+ spark frequency in rat ventricular myocytes. The Journal of Physiology. 2000;528:25–37. doi: 10.1111/j.1469-7793.2000.00025.x. [DOI] [PMC free article] [PubMed] [Google Scholar]
- Bountra C, VaughanJones RD. Effect of intracellular and extracellular pH on contraction in isolated mammalian cardiac tissue. The Journal of Physiology. 1989;418:163–187. doi: 10.1113/jphysiol.1989.sp017833. [DOI] [PMC free article] [PubMed] [Google Scholar]
- Buckler KJ, VaughanJones RD. Application of a new pH-sensitive fluoroprobe (carboxy-SNARF-1) for intracellular pH measurement in small, isolated cells. Pflügers Archiv. 1990;417:234–239. doi: 10.1007/BF00370705. [DOI] [PubMed] [Google Scholar]
- Choi HS, Trafford AW, Eisner DA. Measurement of calcium entry and exit in quiescent rat ventricular myocytes. Pflügers Archiv. 2000;440:600–608. doi: 10.1007/s004240000295. [DOI] [PubMed] [Google Scholar]
- Eisner DA, Trafford AW, Díaz ME, Overend CL, O’Neill SC. The control of Ca release from the cardiac sarcoplasmic reticulum: regulation versus autoregulation. Cardiovascular Research. 1998;38:589–604. doi: 10.1016/s0008-6363(98)00062-5. [DOI] [PubMed] [Google Scholar]
- Fabiato A, Fabiato F. Effects of pH on the myofilaments and the sarcoplasmic reticulum of skinned cells from cardiac and skeletal muscles. The Journal of Physiology. 1978;276:233–255. doi: 10.1113/jphysiol.1978.sp012231. [DOI] [PMC free article] [PubMed] [Google Scholar]
- Gaskell WH. On the tonicity of the heart and blood vessels. The Journal of Physiology. 1880;3:48–75. doi: 10.1113/jphysiol.1880.sp000083. [DOI] [PMC free article] [PubMed] [Google Scholar]
- Grynkiewicz G, Poenie M, Tsien RY. A new generation of Ca2+ indicators with greatly improved fluorescence properties. Journal of Biological Chemistry. 1985;260:3440–3450. [PubMed] [Google Scholar]
- Györke S, Lukyanenko V, Györke I. Dual effects of tetracaine on spontaneous calcium release in rat ventricular myocytes. The Journal of Physiology. 1997;500:297–309. doi: 10.1113/jphysiol.1997.sp022021. [DOI] [PMC free article] [PubMed] [Google Scholar]
- Harrison SM, Frampton JE, McCall E, Boyett MR, Orchard CH. Contraction and intracellular Ca2+, Na+, and H+ during acidosis in rat ventricular myocytes. American Journal of Physiology. 1992;262:C348–357. doi: 10.1152/ajpcell.1992.262.2.C348. [DOI] [PubMed] [Google Scholar]
- Highsmith S, Bloebaum P, Snowdowne KW. Sarcoplasmic reticulum interacts with the Ca2+ indicator precursor fura-2 AM. Biochemical and Biophysical Research Communications. 1986;138:1153–1162. doi: 10.1016/s0006-291x(86)80403-x. [DOI] [PubMed] [Google Scholar]
- Horn R, Marty A. Muscarinic activation of ionic currents measured by a new whole-cell recording method. Journal of General Physiology. 1988;92:145–159. doi: 10.1085/jgp.92.2.145. [DOI] [PMC free article] [PubMed] [Google Scholar]
- Hulme JT, Orchard CH. Effect of acidosis on Ca2+ uptake and release by sarcoplasmic reticulum of intact rat ventricular myocytes. American Journal of Physiology. 1998;275:H977–987. doi: 10.1152/ajpheart.1998.275.3.H977. [DOI] [PubMed] [Google Scholar]
- Irisawa H, Sato R. Intra and extracellular actions of proton on the calcium current of isolated guinea pig ventricular cells. Circulation Research. 1986;59:348–355. doi: 10.1161/01.res.59.3.348. [DOI] [PubMed] [Google Scholar]
- Kentish JC, Xiang JZ. Ca2+ and caffeine-induced Ca2+ release from the sarcoplasmic reticulum in rat skinned trabeculae: effects of pH and Pi. Cardiovascular Research. 1997;33:314–323. doi: 10.1016/s0008-6363(96)00217-9. [DOI] [PubMed] [Google Scholar]
- Kurachi Y. The effects of intracellular protons on the electrial activity of single ventricular cells. Pflügers Archiv. 1982;394:264–270. doi: 10.1007/BF00589102. [DOI] [PubMed] [Google Scholar]
- LagadicGossman D, Buckler KJ, VaughanJones RD. Role of bicarbonate in pH recovery from intracellular acidosis in the guinea-pig ventricular myocyte. The Journal of Physiology. 1992;458:361–384. doi: 10.1113/jphysiol.1992.sp019422. [DOI] [PMC free article] [PubMed] [Google Scholar]
- Lamont C, Eisner DA. The sarcolemmal mechanisms involved in the control of diastolic intracellular calcium in isolated rat cardiac trabeculae. Pflügers Archiv. 1996;432:961–969. doi: 10.1007/s004240050223. [DOI] [PubMed] [Google Scholar]
- Lattanzio FA, Bartschat DK. The effect of pH on rate constants, ion selectivity and thermodynamic properties of fluorescent calcium and magnesium indicators. Biochemical and Biophysical Research Communications. 1991;177:184–191. doi: 10.1016/0006-291x(91)91966-g. [DOI] [PubMed] [Google Scholar]
- Luckhoff A. Measuring cytosolic free calcium concentration in endothelial cells with indo-1: the pitfall of using the ratio of two fluorescence intensities recorded at different wavelengths. Cell Calcium. 1986;7:233–248. doi: 10.1016/0143-4160(86)90003-5. [DOI] [PubMed] [Google Scholar]
- O’Neill SC, Donoso P, Eisner DA. The role of [Ca2+]i and [Ca2+]i-sensitization in the caffeine contracture of rat myocytes: measurement of [Ca2+]i and [caffeine]i. The Journal of Physiology. 1990;425:55–70. doi: 10.1113/jphysiol.1990.sp018092. [DOI] [PMC free article] [PubMed] [Google Scholar]
- Orchard CH. The role of the sarcoplasmic reticulum in the response of ferret and rat heart muscle to acidosis. The Journal of Physiology. 1987;384:431–449. doi: 10.1113/jphysiol.1987.sp016462. [DOI] [PMC free article] [PubMed] [Google Scholar]
- Orchard CH, Houser SR, Kort AA, Bahinski A, Capogrossi MC, Lakatta EG. Acidosis facilitates spontaneous sarcoplasmic reticulum Ca2+ release in rat myocardium. Journal of General Physiology. 1987;90:145–165. doi: 10.1085/jgp.90.1.145. [DOI] [PMC free article] [PubMed] [Google Scholar]
- Orchard CH, Kentish JC. Effects of changes of pH on the contractile function of cardiac muscle. American Journal of Physiology. 1990;258:C967–981. doi: 10.1152/ajpcell.1990.258.6.C967. [DOI] [PubMed] [Google Scholar]
- Overend CL, Eisner DA, O’Neill SC. The effect of tetracaine on spontaneous Ca release and sarcoplasmic reticulum calcium content in rat ventricular myocytes. The Journal of Physiology. 1997;502:471–479. doi: 10.1111/j.1469-7793.1997.471bj.x. [DOI] [PMC free article] [PubMed] [Google Scholar]
- Overend CL, O’Neill SC, Eisner DA. The effect of tetracaine on stimulated contractions, sarcoplasmic reticulum Ca2+ content and membrane current in isolated rat ventricular myocytes. The Journal of Physiology. 1998;507:759–769. doi: 10.1111/j.1469-7793.1998.759bs.x. [DOI] [PMC free article] [PubMed] [Google Scholar]
- Satoh H, Delbridge LMD, Blatter LA, Bers DM. Surface:volume relationship in cardiac myocytes studied with confocal microscopy and membrane capacitance measurements: Species dependence and developmental effects. Biophysical Journal. 1996;70:1494–1504. doi: 10.1016/S0006-3495(96)79711-4. [DOI] [PMC free article] [PubMed] [Google Scholar]
- Spencer CI, Berlin JR. Calcium-induced release of strontium from the sarcoplasmic reticulum of rat cardiac ventricular myocytes. The Journal of Physiology. 1997;504:565–578. doi: 10.1111/j.1469-7793.1997.565bd.x. [DOI] [PMC free article] [PubMed] [Google Scholar]
- Trafford AW, Díaz ME, Eisner DA. A novel, rapid and reversible method to measure Ca buffering and timecourse of total sarcoplasmic reticulum Ca content in cardiac ventricular myocytes. Pflügers Archiv. 1999;437:501–503. doi: 10.1007/s004240050808. [DOI] [PubMed] [Google Scholar]
- Trafford AW, Díaz ME, Negretti N, Eisner DA. Enhanced calcium current and decreased calcium efflux restore sarcoplasmic reticulum Ca content following depletion. Circulation Research. 1997;81:477–484. doi: 10.1161/01.res.81.4.477. [DOI] [PubMed] [Google Scholar]
- Trafford AW, Díaz ME, Sibbring GC, Eisner DA. Modulation of CICR has no maintained effect on systolic Ca2+: simultaneous measurements of sarcoplasmic reticulum and sarcolemmal Ca2+ fluxes in rat ventricular myocytes. The Journal of Physiology. 2000;522:259–270. doi: 10.1111/j.1469-7793.2000.t01-2-00259.x. [DOI] [PMC free article] [PubMed] [Google Scholar]
- Varro A, Negretti N, Hester SB, Eisner DA. An estimate of the calcium content of the sarcoplasmic reticulum in rat ventricular myocytes. Pflügers Archiv. 1993;423:158–160. doi: 10.1007/BF00374975. [DOI] [PubMed] [Google Scholar]
- Xu L, Jones R, Meissner G. Effects of local anesthetics on single channel behavior of skeletal muscle release channel. Journal of General Physiology. 1993;101:207–233. doi: 10.1085/jgp.101.2.207. [DOI] [PMC free article] [PubMed] [Google Scholar]
- Xu L, Mann G, Meissner G. Regulation of cardiac Ca2+ release channel (Ryanodine receptor) by Ca2+, H+, Mg2+, and adenine nucleotides under normal and simulated ischemic conditions. Circulation Research. 1996;79:1100–1109. doi: 10.1161/01.res.79.6.1100. [DOI] [PubMed] [Google Scholar]