Abstract
The purpose of this study was to determine the relationship between the serum level of C-reactive protein (CRP) and lactation and health status. Blood samples were collected every 2 wk for 12 mo from 29 randomly selected dairy cattle on 3 farms. At the time the blood samples were collected, the stage of pregnancy, lactation status, breeding records, general health condition, reproductive status, and body condition score were recorded for each cow. Serum CRP was detected with sodium dodecyl sulfate polyacrylamide gel electrophoresis and western immunoblotting. C-reactive protein levels were measured with a densitometer and expressed as an optimal dose value. C-reactive protein levels were correlated with the body condition score, lactation status, and animal health (P < 0.05), but not with ambient temperature, animal age, or parity. C-reactive protein levels increased with milk production, peaking during high lactation (2 to 4 mo of pregnancy), and decreased when lactation ceased. In addition, the CRP level was highest during naturally occurring infections, such as mastitis and other tissue inflammation. Thus, the CRP level can confirm the presence of inflammation. The stress effect of taking blood samples as measured by the CRP level, was also examined. The CRP level became rapidly elevated 12 h after the blood samples were taken but returned to normal 36 h later. In conclusion, the stresses resulting from overall poor health, heavy lactation, and blood sampling caused the elevation of serum CRP. C-reactive protein is a marker or tool for evaluating the health status of a herd. C-reactive protein should also be considered as a useful criteria to assess the stress levels and may be useful in early surveillance of disease conditions in a dairy herd.
Introduction
First identified in 1930, C-reactive protein (CRP) is a non-glycosylated protein composed of 5 subunits that firmly bind to polysaccharides from Pneumococcus (1,2). It is one of the major acute phase proteins (APP) and is widely distributed in nearly all vertebrates (1). During infections and under stressful conditions, human and animal mononuclear series cells, including monocytes and macrophages, secrete cytokines; such as, IL-1; IL-6; tumor necrosis factor-a; and interferon, which stimulate the liver to rapidly synthesize large amounts of CRP (1,3,4). C-reactive protein is the serum APP that responds most quickly to infections. It recognizes phosphocholine on the cytoplasmic membrane of a cell, activates the complement cascade, and stimulates macrophages to engulf infectious agents (3). C-reactive protein can regulate the immune system during the early stage of an infection. C-reactive protein plays a role in destroying infectious agents, minimizing tissue damage, and facilitating tissue repair and regeneration (1,5).
The concentration of CRP in the blood of healthy human beings ranges from 0 to 1.0 mg/dL, but during acute inflammation, the CRP levels may increase 1000-fold (6). In humans, CRP level is an important indicator for the early, rapid diagnosis of a disease, especially for acute typhlitis, cholecystitis, and pancreatitis (7). Other diseases in humans that change the serum concentrations of CRP include meningitis, septicemia, pneumonia, tuberculosis, fracture, abscess, myocardial infection, pericarditis, acute pyelonephritis, septic arthritis, some carcinomas and sarcomas, and rheumatoid arthritis (8,9). Changes in the levels of APPs appear much earlier than humoral immunity. In addition, APPs are much more stable and exhibit high sensitivity and specificity (2,7,8). Recently, CRP has also been used as a marker for the early diagnosis and surveillance of cardiovascular diseases (10,11).
There has been little research on CRP in domestic animals. In swine, subcutaneous injections of turpentine elicited non-septic inflammation and a 6- to 8-fold increase in CRP concentrations within 48 hr (12). Swine inoculated with Actinobacillus pleuropneumoniae exhibited increased body temperature, acute respiratory inflammation, and a rapid and significant elevation of CRP levels (13). The CRP concentrations in cattle with bovine mastitis was more than 10-fold the concentration in healthy cattle. During an investigation of a dairy farm, the serum levels of CRP in cows with mastitis were much higher (1083 ± 93 ng/mL) than those of healthy cows (82 ± 66 ng/mg) (14). Very little research has been published regarding the effects of environmental stress, management practices, or common diseases on the CRP levels of dairy cattle.
In this study, we measured the CRP levels in 29 dairy cattle over 12 mo to determine its relationship to the stages of pregnancy (lactation status), environmental temperature, and animal health.
Materials and methods
Blood samples, farm classification, and health conditions
Ten dairy cattle from each of 3 farms were randomly selected for this study. Due to an acute bloat, 1 animal at the farm classified as good (see below), was removed from the study. Blood samples were collected every 2 wk from each of the remaining 29 cattle. A total of 575 blood samples were collected for this study. Serum samples were isolated following centrifugation at 3000 rotations per minute (rpm) for 5 min, and stored in a freezer at a temperature of −20°C.
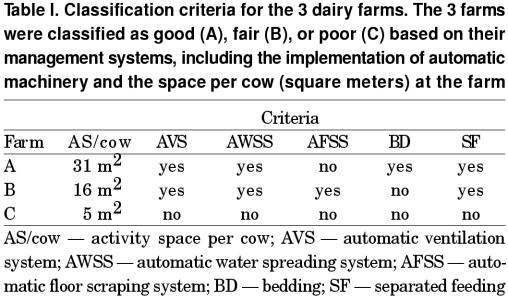
Each dairy farm was classified as good (A), fair (B), or poor (C) based on its environmental conditions, management, and hygiene (Table I). The specific criteria used to classify the farms were the installation of ventilation system, indoor automatic water sprinkling and automatic floor cleaning systems, the average space per cow in the barn, the management system at different lactation status, and the presence or absence of bedding. Each time blood samples were taken, the following information was collected: respiration rate, body temperature, appetite, physical appearance of feces, reproductive status, body condition score (BCS), specific diseases (if any), changes in the farm environment, and ambient temperature. The diseases were diagnosed mostly by clinical and physical examinations. California mastitis test (CMT) was used to confirm mastitis. Somatic cell counter (Foss Electric, Hillerod, Denmark) was used to count the somatic cells in the milk of suspected cases of mastitis (over 300,000 cells was positive).
Table I.
C-reactive protein and stress from blood sampling
Cattle on a 4th farm, classified as good (D) based on the criteria mentioned above (Table I), were used to assess the effect of sampling stress on CRP level. Nine clinically healthy dairy cows were selected based on their reproductive status and divided into 3 groups of 3 cows each. Cows in group 1 had given birth within the previous 2 wk; those in group 2 were 3 to 4 mo along in pregnancy in the high lactation period; and cows in group 3 were not lactating. Blood was collected from each of the 9 cows every 12 h for 4 d. Blood samples were processed as described above.
Sodium dodecyl sulfate polyacrylamide gel electrophoresis (SDS-PAGE) and western immunoblotting
Duplicate sodium dodecyl sulfate polyacrylamide gel electrophoresis (SDS-PAGE) gels were prepared. One mL of serum sample was mixed with 24 mL of reducing sample buffer and boiled for 5 min. After chilling with ice water at 0°C, the samples were electrophoresed at a 9% SDS-PAGE as described previously by Lee et al (15). After the SDS-PAGE, 1 gel from each sample was stained with Coomassie blue for 30 min and destained with Destain I and II. Another gel was transferred by capillary diffusion, following standard protocol, to Hybond-C extra membranes (Amersham, Buckinghamshire, England) and reacted with rabbit, anti-human CRP (Calbiocheng, Darmstadt, Germany) for 1 h. It was then thoroughly washed with 3% gelatin Tris-Twen 20 buffered saline (TTBS) (20 mM Tris-HCl, 0.05% Tween, 500 mM NaCl, pH 7.4), and reacted with goat, anti-rabbit immunoglobulin G (IgG) (Sigma, Saint Louis, Missouri, USA) for 1 h. The immune complexes were detected using an alkaline phosphatase conjugate substrate kit (Bio-Rad, Hercules, California, USA). The CRP level was determined with a densitometer (Molecular Dynamics, Hayward, California, USA), expressed as an optical density (OD) value and analyzed with Image Qua NT (Molecular Dynamics).
Body condition score
Dairy cattle were given a BCS ranging from 1 to 5, in increments of 0.5, using the methods and criteria described by Wildman et al (16). Very thin cows were given a BCS of 1.0 and fat cows were scored 5.0. Because the very thin and very fat animals were usually eliminated during routine practice in these farms, the scores we obtained in this experiment ranged from 2.0 to 4.5.
Statistical analysis
All data were analyzed with the general linear model (GLM) procedure using a statistical software package (SAS, version 6.12; SAS Institute Inc., Cary, North Carolina, USA) to estimate and compare least-square means. To compare herd difference, the individual cow was used as the experimental unit and it is assumed that every measurement (Yijk ) fits the following statistical model: Yijk = μ + α + εij + τk + (ατ)ik + eijk. The value Yijk is the kth measurement of the jth cow in the ith herd, μ is the grand mean, αi is the ith herd's effect, εij is the random effect of the jth cow in the ith herd, τk is the random effect kth date of measurement, (ατ)ik is the interaction between herd and date, and eijk is the residual random error. When comparing CRP under different BCS or seasonal situations, it is assumed that: Yijk = μ + αi + εij + τk +eijk. The value τk is the fixed effect kth BCS group (season). When comparing CRP fluctuations in the 3 groups (3 cows per group) from cows from the 4th farm, during the 96 h sampling period (12 measurements per cow), the data is assumed to fit the following statistical model: Yijk = μ +Gi + εij +Sk + (GS)ik + eijk, where Yijk is the kth measurement of the jth cow in the ith group, μ is the grand mean, Gi is the ith group's effect, εij is the random effect of the jth cow in the ith group, Sk is the kth sampling effect, (GS)ik is the interaction between group and sampling, and eijk is the residual random error.
Results
C-reactive protein level in relation to age, breeding status and BCS
All of the CRP values that are mentioned in the text are the least-square means. The average age of the 29 cows from 3 different farms was 5.7 ± 1.9 y (range, 3 to 9 y) and the average parity was 3.2 ± 1.5 (range, 1 to 6). The BCS averaged 3.3 ± 0.6 (range, 2.0 to 4.5) and the CRP level averaged 28.3 ± 32 (range, 0 to 295).
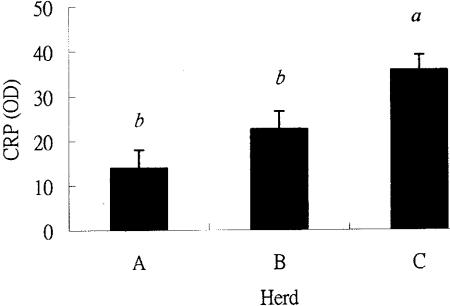
The CRP level correlated poorly with age and parity, but was closely correlated with BCS (P < 0.05). Cattle on farm A had the lowest CRP levels (13.9, n = 182), while those on farm B had slightly higher CRP levels (22.6, n = 178), and cattle on farm C had highest CRP levels (35.7, n = 215) (P < 0.05) (Figure 1).
Figure 1. Least-square means of C-reactive protein (CRP) levels (in OD value) of the cattle at different farms.
ab Herds with different letters are highly significantly different (P < 0.01).
A — good farm; B — fair farm; C — poor farm.
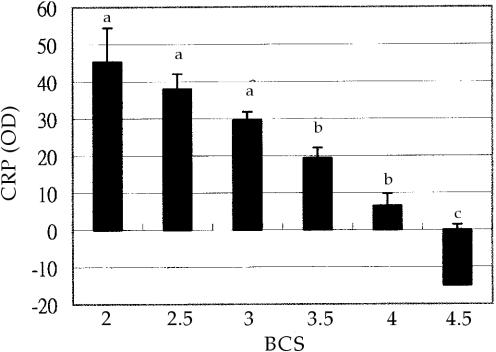
The CRP level was undetectable in cows with the highest BCS score (4.5). As the BCS decreased to 3.5, the average CRP level increased to 19.3 ± 2.8. The CRP was highest (43.5 ± 9.1 or 38.0 ± 4.0) at a BCS of 2.0 or 2.5. Typically, fat cows had lower CRP levels (Figure 2). The regression analysis found a linear relationship between the BCS score and the CRP levels. The estimated regression equation is Y = 84.3-21.0 X, where Y is the estimated CRP and X is the measured BCS scores. It shows that every point increase of BCS marks a decrease of 21.00 ± 3.07 in CRP.
Figure 2. The least-square means of C-reactive protein (CRP) levels (in OD value) of cattle in all farms are compared with body condition score (BCS).
ab BCS groups with different letters are significantly different (P < 0.05).
C-reactive protein and pregnancy
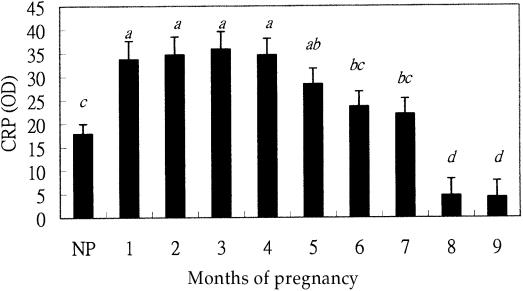
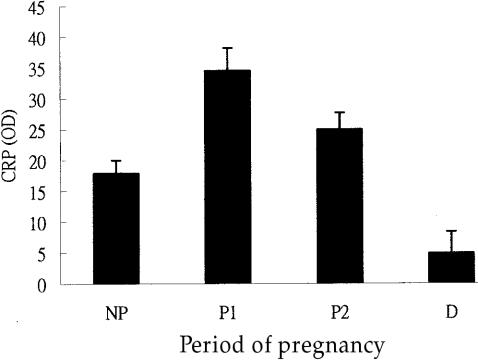
The average CRP level in clinically healthy, non-pregnant cows was 17.9 ± 2.1. The CRP level was highest during the first 1 to 4 mo of pregnancy (34.5 ± 3.7) in the high lactation period (P1 period), decreased during months 5 to 7 (P2 period), and was lowest (4.9 ± 3.5) during months 8 and 9 as animals were in the non-lactating period (D period) (Figures 3 and 4). Using the month of pregnancy as a covariate of CRP, the analysis of covariance revealed that the relationship between months of pregnancy and the CRP level could be expressed by the following polynomial regression equation: Yi = 15.2 + 7.76Xi + Xi2, where Yi is the predicted CRP of the cow with Xi pregnancy month.
Figure 3. The relationship between the least-square means of serum C-reactive protein (CRP) levels (in OD value) of cattle and different periods of pregnancy (months) or non-pregnancy (NP).
abcd Bars with different letters are significantly different (P <0.05).
Figure 4. The relationship between least-square means of C-reactive protein (CRP) levels (in OD value) of cattle and lactation periods. Lactation was divided into 4 periods, the non-pregnant (NP), 1 to 4 mo of pregnancy (P1), 5 to 7 mo of pregnancy (P2), and the dry period (D).
C-reactive protein and ambient temperature
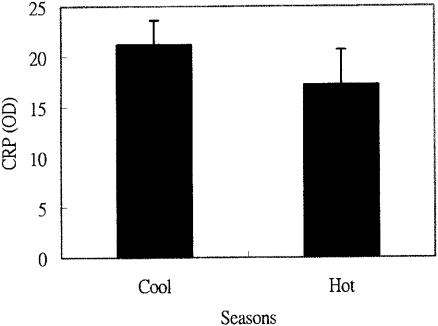
The range of temperatures experienced by dairy cattle in Taiwan is not large, so we designated November through April as the cold season (the average temperature was 17.7°C, with a range from 11.5 to 27.5°C) and May through October as the hot season (the average temperature was 26.2°C, with a range from 19.5 to 36.5°C). The average CRP from samples of all the clinically healthy cows was 21.2 ± 2.4 (n = 257) during the cold season and 17.2 ± 3.5 (n = 232) during the hot season, the difference between them is not significant (P > 0.05) (Figure 5).
Figure 5. The relationship between least-square means of C-reactive protein (CRP) (in OD value) of normal cattle in cool and hot seasons. The seasons of the year are arbitrarily classified as cold (from November to April) with an average temperature of 17.7°C and hot (from May to September) with an average temperature of 26.2°C. The seasonal difference was not significant (P > 0.05).
C-reactive protein and diseases
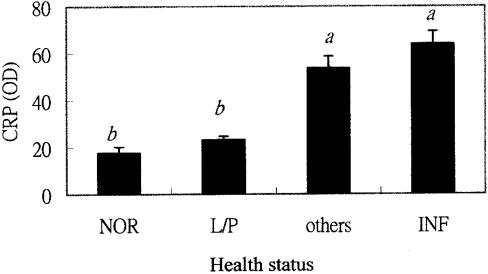
Diseases afflicting the 29 cows during the 12 mo study period were diagnosed clinically in the farm and divided into 2 groups. The inflammatory group included acute and chronic mastitis, foot rot, endometritis, and pneumonia. The rest of the diseases; including, abortion, reproductive disorders, stillbirth, and ovarian cysts, were grouped into others. The diseases were diagnosed by clinical and physical examination, including rectal palpation. The CRP levels increased dramatically in sick cows, especially those in the inflammatory group (Figure 6).
Figure 6. C-reactive protein (CRP) levels of cattle with different health status.
ab Bars with different letters are significantly different.
NOR — Normal; L/P — Lactation and pregnant; INF — Inflammatory group (Cattle with diseases of acute and chronic mastitis, foot rot, endometritis, and pneumonia); Others — Other group (Cattle with diseases of abortion, reproductive disorders, stillbirth, and ovarian cysts).
P < 0.05
C-reactive protein and sampling stress
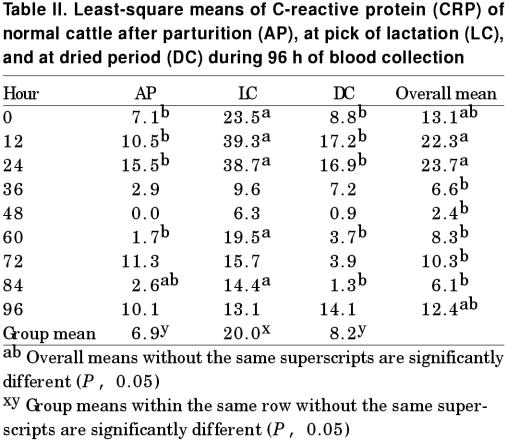
The CRP levels were elevated in all 3 groups of cows from the 4th farm 12 h after blood samples were collected, but returned to normal 36 h later (Table II). Thus, 48 h after blood samples were taken, the effect of sampling stress on the CRP level was undetectable. The average CRP level in group 2 cattle (3 to 4 mo of pregnancy) was the highest among the 3 groups (20.0 ± 3.3). The cattle in the postparturition group had the lowest CRP level (6.9 ± 1.5), while that of dried cattle was intermediate (8.2 ± 2.2).
Table II.
Discussion
C-reactive protein is one of the most abundant APPs in animal serum. The liver rapidly synthesizes CRP when animals are sick or under severe stress (1,3,4). We found that cattle on the farm with the best conditions and management had the lowest levels of CRP. Farm A had the best ventilation system and the most frequently changed animal bedding. The barn was dry and cool, cows were feeding separately during high lactation period, and had the greatest average space for each cow. An automatic water spreading system and automatic floor cleaning system was installed in the barn. In contrast, farm C was poorly managed and lacked ventilation, water spreading, and floor cleaning systems. There was no bedding and the space for each cow was only one-quarter the space available for each cow on farm A. The average CRP levels of cattle at farm C were higher than at the other 2 farms, and were double the average CRP levels of cattle at farm A. It was also found that even healthy cattle at farm C had higher CRP levels. Thus, we assume that the farm environment itself might influence the CRP levels in cattle. The adverse environmental conditions may increase the disease susceptibility of a cow, as evidenced by our findings, the highest number of clinical illness (63 cases) were diagnosed at farm C, while the lowest was at farm A (35 cases). The stress, induced by the poor management system at farm C, may be one of the predisposing factors causing disease in the cattle. However, other factors such as genetics or feeds may also be involved in disease susceptibility. The data showed a tendency for serum CRP levels to correlate with the health conditions of a dairy herd. Further studies are needed to explore the potential application of using the serum CRP level as an indicator of farm management environment or a marker for the level of stress experienced by dairy cows to suggest the health condition of a dairy herd.
Non-lactating cows gained weight and received high BCS numbers. However, during heavy lactation, cattle lost weight and their BCS numbers were larger. Thus, body condition was closely tied to lactation status. The fattest (BCS 4.5), healthy cattle had the lowest CRP levels. Most of these cattle were not lactating. In contrast, the highest CRP level was found in cattle during the period of peak lactation (months 1 to 4 of pregnancy) (BCS, 2.0 to 3.0). Therefore, lactation status was the most important factor affecting and linking BCS and serum CRP levels. The data from our 4th herd, in which heavy lactation cows had a higher CRP level, further confirms this relationship. The results from Neumann and Kruger (17) agree with our conclusion as well, although their data only covered the first 20 wk after delivery. The relationship of heavy lactation, high serum CRP, and stress deserves further study. Kruger and Neumann (18) also reported that cows with mastitis caused by Streptococcus uberis, had significantly elevated serum CRP levels, that were much higher than those of healthy, lactating cows. In our study, the serum CRP level of cattle with mastitis was about 100, which was 3-fold the level in healthy, lactating cattle (34.5 ± 3.7). In addition, the CRP levels were also elevated in cattle suffering from most other clinically diagnosed diseases, especially in the acute stage; such as, fever and pneumonia, which caused the CRP level to go up to 295. Diseases accelerate the synthesis and release of CRP from the liver to the bloodstream (19,20). Thus, when the serum CRP level in cows greatly increases, acute infection should be considered.
We verified that the elevation of serum CRP levels resulting from the stress of collecting blood samples was temporary. Serum CRP levels increased within the first 12 h after blood samples were collected, but gradually returned to normal within 48 h. Cattle were able to tolerate sampling stress or became accustomed to mild, consistent procedures over time.
In conclusion, as stress increases to a critical point, the liver rapidly synthesizes large amounts of CRP and releases it into the blood to provide immediate protection against stress. Diseases in a dairy herd elevated the serum CRP level. The serum CRP level was also correlated with milk production. The greater the milk production, the higher the level of serum CRP. Diseases, especially acute infections, induced much higher levels of CRP production than stress or lactation. Our data also shows an interesting trend that adverse environmental conditions, resulting from poor management, might cause the significant elevation of dairy cattle serum CRP levels. However, further research to determine the role of serum CRP in evaluating the adequacy of the dairy farm management system is certainly necessary. C-reactive protein levels increase rapidly in response to adverse conditions, which often are among the predisposing factors for disease infection, and are usually present in the serum before any clinical manifestation of disease. Thus, CRP can be used to evaluate the health of a herd and may be useful for early disease surveillance.
Footnotes
Acknowledgment
The authors thank the Council of Agriculture, The Executive Yuan, Taiwan, Republic of China (90-6.2.2-3-8), for their generous support.
Address all correspondence and reprint requests to Dr. Rea-Min Chu; 142 Chou-San Road, Taipei, Taiwan 106, Republic of China; telephone: 886 2 2368 6570; fax: 886 2 2365 5147; e-mail: redman@ms.cc.ntu.edu.tw
Received December 3, 2001. Accepted July 3, 2002.
References
- 1.Sarikaputi M, Morimatsu M, Syuto B, Saito M, Naiki M. A new purification procedure for bovine C-reactive protein and serum amyloid P component. Int J Biochem 1991;23:1137–1142. [DOI] [PubMed]
- 2.Clyne B, Olshaker JS. Clinical laboratory in emergency medicine. The C-reactive protein. J Emergency Med 1999;17:1019–1025. [DOI] [PubMed]
- 3.Baumann H, Gauldie J. The acute phase response. Immunol Today 1994;15:74–80. [DOI] [PubMed]
- 4.Godson DL, Campos M, Attah-Poku SK, et al. Serum haptoglobin as an indicator of the acute phase response in bovine respiratory disease. Vet Immunol Immunopathol 1996;51:277–292. [DOI] [PMC free article] [PubMed]
- 5.Horadagoda NU, Knox KM, Gibbs HA, et al. Acute phase proteins in cattle: discrimination between acute and chronic inflammation. Vet Rec 1999;144:437–441. [DOI] [PubMed]
- 6.Pepys MB, Baltx ML. Acute phase protein with special reference to C-reactive protein and related proteins (pentaxins) and serum amyloid A protein. Adv Immunol 1983;34:141–212. [DOI] [PubMed]
- 7.Brian C, Otehaker JS. Clinical laboratory in emergency medicine: The C-reactive protein. J Emergency Med 1999;17:1019–1025.
- 8.Yentis SM, Soni N, Sheldon J. C-reactive protein as an indicator of resolution of sepsis in the intensive care unit. Intensive Care Med 1995;21:602–605. [DOI] [PubMed]
- 9.Aman S, Painiela L, Leirisalo-Repo M, et al. Prediction of disease progression in early rheumatoid arthritis by ICTP, RF and CRP. A comparative 3-year follow-up study. Rheumatology (Oxford) 2000;39:1009–1013. [DOI] [PubMed]
- 10.Thompson D, Milford-Ward A, Whicker JT. The value of acute phase protein measurements in clinical practice. Ann Clin Biochem 1992;29:123–131. [DOI] [PubMed]
- 11.Muir KW, Weir CJ, Alwan W, Squire IB, Lees KR. C-reactive protein and outcome after ischemic stroke. Stroke 1999;30:981–985. [DOI] [PubMed]
- 12.Lampreave F, González-Ramón N, MartÍnez-Ayensa S, et al. Characterization of the acute phase serum protein response in pigs. Electrophoresis 1994;15:672–676. [DOI] [PubMed]
- 13.Heegaard PM, Klausen J, Nielsen JP, et al. The porcine acute phase response to infection with Actinobacillus pleuropneumoniae. Haptoglobin, C-reactive protein, major acute phase protein and serum amyloid A protein are sensitive indicators of infection. Comp Biochem Physiol B Biochem Mol Bio 1998;119:365–373. [DOI] [PubMed]
- 14.Schrodl W, Kruger M, Hien TT, Fuldner M, Kunze R. C-reactive protein as a new parameter of mastitis. Tierarztl Prax 1995;23:337–341. [PubMed]
- 15.Lee WC, Lin KY, Chiu YT, et al. Substantial decrease of HSP 90 in ventricular tissue of two sudden death pigs with hypertrophic cardiomyopathy. FASEB J 1996;10:1198–1204. [DOI] [PubMed]
- 16.Wildman E, Jones PE, Wagner RL, Boman A. Dairy cow body condition scoring system and its relationship to selected production characteristics. J Dairy Sci 1982;65:495–501.
- 17.Neumann A, Kruger M. Effect of lactation state (lst–20th week of lactation) on dynamics of C-reactive protein (CRP) in initial quarter milk samples in relation to somatic cell count, lactose content and blood serum CRP levels. Tieraztl Prax Ausg G Grosst Nutzt 1999;27:110–113. [PubMed]
- 18.Kruger M, Neumann A. Investigations on the behavior of C-reactive protein, cell count, lactose content as well as electric conductivity in quarter milk samples of subdinically diseased quarters of the udders in relation to bacteriologic results. Tierarztl Prax Ausg G Grosst Nutzt 1999;27:164–167. [PubMed]
- 19.Caspi D, Snel FW, Batt RM, et al. C-reactive protein in dogs. Am J Vet Res 1987;48:919–921. [PubMed]
- 20.Tejani NR, Chonmaitree T, Rassin DK, Howie VM, Owen MJ, Goldman AS. Use of C-reactive protein in differentiation between acute bacterial and viral otitis media. Pediatrics 1995;95:664–669. [PubMed]


