

Abstract
Objective
Presence of the JAK2V617F mutation in only 40-60% of patients with Essential Thrombocythemia (ET) underscores the heterogeneity of this myeloproliferative disorder (MPD). Several distinct mutations, either in JAK2 (exon 12) or in c-Mpl (W515L) have been described in subsets of other MPDs, Polycythemia vera (PV) and Idiopathic Myelofibrosis (IMF). Analogous to JAK2V617F, these mutations cause constitutive JAK2 and STAT activation. It has therefore been proposed that constitutive activation of the JAK/STAT pathway underlies the molecular etiology of all MPDs. We investigated the alternative hypothesis that distinct alterations, separate from the JAK/STAT signal transduction pathway, underlie a subset of JAK2V617F-negative ET.
Methods
cDNA microarrays and qRT-PCR were used to compare gene expression in 40 ET patients with and without the JAK2V617F mutation.
Results
Unsupervised clustering of gene expression patterns in ET patients revealed two distinct subclasses of patients. These subclasses differed in presence or absence of the JAK2V617F mutation. Patients lacking the JAK2V617F mutation displayed significantly lower expression of the JAK/STAT target genes Pim-1 and SOCS2. In addition, JAK2V617F-negative patients showed lower levels of STAT3 phosphorylation.
Conclusions
These data demonstrate that a large proportion of JAK2V617F–negative ET patients do not display constitutive JAK/STAT signaling. Hence, we propose that alterations in different signal transduction pathways can lead to the clinical phenotype of ET. Elucidation of novel ET-inducing changes will facilitate both a molecular classification of ET and the development of rationally designed therapies.
Keywords: Essential Thrombocythemia, myeloproliferation, microarrays, signal transduction
INTRODUCTION
Essential Thrombocythemia (ET) is characterized by persistently elevated platelet counts in the context of a normal red cell mass [1]. Several diagnostic algorithms for this disorder have been proposed [2-4]. However, irrespective of the criteria employed for diagnosis, patients with ET comprise a heterogeneous group. Heterogeneity is manifested both by the variation in clinical course observed, and by the variable presence of cellular and molecular markers. For example, the ability to form erythroid colonies in the absence of erythropoietin (endogenous erythroid colonies, EECs), overexpression of the PRV-1 mRNA and reduced expression of c-MPL, are detected only in a subset of ET patients [5-8]. Similarly, the recently described point mutation in the JAK2 kinase (JAK2V617F), is present in only around 50% of ET patients [9, 10]. Because introduction of the JAK2V617F mutation into a murine bone marrow transplantation model recapitulates many features of myeloproliferative disorders, including, in some cases, thrombocythemia, it appears intimately involved in the molecular etiology of disease development [11, 12]. This observation raises the obvious question, which molecular alterations underlie the etiology of non-JAK2V617F carrying ET.
Scott et al. recently described novel JAK2 mutations in JAK2V617F –negative polycythemia vera (PV) patients [13]. Affected individuals carry a variety of alterations in exon 12, involving amino acids 538-543. Similar to JAK2V617F, exon 12 mutations result in a gain of function, cause constitutive STAT phosphorylation and evoke erythrocytosis and thrombocytosis in a mouse model [13]. Likewise, the c-MplW515L mutation, which can occur in isolation or in the context of the JAK2V617F mutation, leads to constitutive JAK/STAT signaling [14-16].
These observations compel the intriguing hypothesis that all MPDs may arise from alterations in the JAK/STAT pathways, albeit from mutations in different participating signal transduction molecules. The alternative model proposes that changes in different signal transduction pathways can lead to the clinical presentation defined as Essential Thrombocythemia. We investigated these two alternative hypotheses by comparing gene expression in JAK2V617F and non-JAK2V617F ET patients.
PATIENTS AND METHODS
Patients
Peripheral blood samples were obtained from 40 ET patients, fulfilling the PVSG criteria for diagnosis, and from buffy coats of healthy volunteer blood donors. 16 patients were entered into the microarray analysis, 16 into the q-RT-PCR and 8 into the Western Blot analysis. The study protocol was approved by the local ethics committee and informed consent was obtained from all patients. Each patient was assigned a unique patient number (UPN), which was used thereafter for the protection of privacy.
Separation of Cells
Granulocytes cells were purified from peripheral blood samples by dextran sedimentation followed by Ficoll-Paque (Pharmacia, Freiburg, Germany) separation and erythrocyte lysis, as previously described [17].
RNA Preparation
For microarray analysis, freshly prepared granulocytes were homogenized in 4 M guanidinium isothiocyanate containing 0.5% N-Laurylsarcosine, 25 mM sodium citrate and 0.72% beta-mercaptoethanol using a 20G syringe. Total RNA was subsequently purified by cesium chloride density gradient centrifugation. For qRT-PCR, RNA was isolated using TRIZOL (Gibco-BRL) at the manufacturer’s recommendation.
JAK2 Genotyping
The percentage of JAK2V617F mutant allele was determined precisely as previously described [18].
Microarrays
cDNA microarrays were produced and processed in the Freiburg Genomics Core Facility according to the Stanford protocol described by Eisen and Brown [19]. 7,497 annotated genes from the RZPD (Resource Center and Primary Database, Berlin, Germany) were obtained as bacterial stocks. Plasmids were purified using the Qiagen 96-well Turbo Kit (Qiagen, Hilden, Germany), and inserts were purified by polymerase chain reaction (PCR) using vector primers flanking the individual inserts (5’-CTG CAA GGC GAT TAA GTT GGG TAA C-3’ and 5’-GTG AGC GGA TAA CAA TTT CAC ACA GGA AAC AGC-3’). PCR products were purified by ethanol precipitation and resuspended in ddH2O. Aliquots were transferred into 384-well plates, dried, and resuspended in 3× standard saline citrate (SSC) or 10 % dimethyl sulfoxide (DMSO) to a final concentration of approximately 40 ng/μL. Printing was performed on aminosilane-coated slides (CMT-GAP II Slides, Corning, NY), using an arrayer that was assembled according to specifications by the Stanford group with software provided by J. de Risi (http://cmgm.stanford.edu/pbrown).
Hybridization
A pool of RNA extracted from isolated granulocytes of 50 healthy controls was produced and used as a reference RNA in each hybridization. Each patient RNA was hybridized together with this control pool to two arrays. Duplicates were performed with dye-swap to control for possible differences in the incorporation rate of the two flourochromes (first slide: patient cDNA labeled with Cy3; control cDNA labeled with Cy5; second slide: patient cDNA labeled with Cy5; control cDNA labeled with Cy3). Per slide, 12 μg of patient and control pool RNA each were reverse transcribed into cDNA in the presence of Cy3- or Cy5-labeled dUTP, using Superscript II reverse transcriptase (RT) (Invitrogen, Carlsbad, CA). A PCR-purification kit (Qiagen, Hilden, Germany) was used for cDNA purification after dye labeling.
The subsequent procedures were performed according to the protocol published by P. Brown et al. (http://cmgm.stanford.edu/pbrown for details). Briefly, the microarray slides were pre-hybridized for 20 minutes at 65°C in pre-hybridization buffer (3.5 × SSC; 0,1% SDS; 10 mg/ml BSA). After rinsing with water, the slides were hybridized to 24 μg of labeled cDNAs resuspended in hybridization solution (3.4 × SSC, 0.3 % SDS, 18 μg poly adenylic acid potassium salt, 18 μg tRNA, 18 μg Cot-1 DNA; Sigma, Steinheim, Germany) for 16 to 20 h at 62 to 65 °C in chambers (Monterey Industries, Richmond, CA). After hybridization the slides were washed for 2 minutes in 1 × SSC and 0.03 % SDS, followed by 5 minutes in 0.2 × SSC. After a final washing step for 5 minutes in 0.05 × SSC the slides were dried by centrifugation and stored in the dark until analysis.
Data Analysis
Signal intensities were measured by an Axon 4000A scanner using GenePix 3.0 software (Axon Instruments Inc., Union City, CA). Image and data files, array layout, as well as all relevant information according to the MIAME guidelines (Minimum Information About a Microarray Experiment [20]) were transferred into the Expressionist Refiner Array (Genedata AG, Basel, Switzerland). To exclude artefacts near background range, all spots were eliminated when sample or reference intensity was less than 50 or less than the local background. Local background was subtracted from all spot intensities. Normalization was performed with the Lowess (Locally weighted scatter plot smoother) sub-grid normalization method [21]. In contrast to global normalization, sub-grid normalization calculates the normalization factor for each of the 16 subgrids independently and is therefore relatively insensitive to local variations on the array [21].
For each spot, the logarithm to the base of two of the Cy3 to Cy5 ratio was computed (LogRatio).
For analysis of the genes discriminating between ET carrying JAK2V617F and those without the mutation, a two-sample t test was used after application of the above mentioned normalization and filtering criteria. To control for multiple testing the obtained p-values were adjusted by calculating the false discovery rate (fdr) using the method by Storey and Tibshirani, a modification of Benjamini and Hochberg [22, 23]. Differential expression was defined by p-values below 0.05 (fdr). Agglomerative hierarchical clustering was performed using the Genedata Analyst software (Genedata, AG).
Quantitative RT-PCR Assays
Quantitative RT-PCR experiments were performed using Assay on demand (Applied Biosystems) products for gene expression analysis:
Human SOCS-2 Assay on demand (#Hs00919620_m1)
Human Pim-1 Assay on demand (#Hs00171473_m1).
Human 18S Pre-Developed TaqMan Assay Reagents (4310893E)
Reverse Transcription of 500 ng of total granulocyte RNA was performed using the TaqMan Reverse Transcription Kit (Applied Biosystems).
All measurements were performed in duplicate according to the manufacturers instructions in an ABI PRISM® 7000 Cycler. A plasmid standard curve containing defined copy numbers was included in each experiment. Using this reference, gene expression was determined and is reported in copy number per 1,000,000 copies of 18S rRNA.
Western Blot
Total granulocyte cell extracts were prepared using the Trizol reagent at the manufacturer’s recommendation. Isolated proteins were resuspended in 1% SDS supplemented with 2 × Complete (Roche), 2× Phosphatase Inhibitor Cocktail II (Calbiochem) and 1× Phosphatase Inhibitor Cocktail I (Sigma). Cell extracts (30 μg) were boiled in Laemmli sample buffer and subjected to SDS-PAGE and Western Blotting. Primary polyclonal antibodies against pSTAT3 (Tyr 705, #9131), STAT3 (#9132), p-p42/44 ERK 1/2 (Tyr 202/Tyr 204; #9101), p42/44 ERK1/2 (#9102), pAKT (Ser 473; #9271) and AKT (#9272) were all obtained from Cell Signalling. Bound antibody was decorated with peroxidase conjugated secondary antibody (donkey anti-rabbit IgG, Amersham). The immunocomplexes were detected using ECL Western blotting reagents (Amersham, Freiburg, Germany). Exposure to Kodak XAR-5 films was performed for 5-10 s.
RESULTS
In order to determine gene expression profiles in patients with ET, cDNA microarray analyses were conducted (Fig. 1). RNA from peripheral granulocytes of 16 ET patients (9 carrying the JAK2V617F mutation, 7 without the mutation) was individually hybridized to a pool of healthy control granulocyte cDNA. For each patient, these data depict genes over- or underexpressed relative to healthy controls. In order to test the hypothesis that alterations in different signal transduction pathways underlie the clinical presentation of ET, we analyzed the data for genes whose expression differs between patients with and without JAK2V617F. 27 transcripts were differentially expressed between the two groups of ET patients (p< 0.05). Hierarchical clustering reveals that these genes clearly discriminate between ET patients with and without the JAK2V617F mutation (Fig. 2). Interestingly, patient 1193, who carries the JAK2V617F mutation (JAK2V617F 15% of total JAK2), but clusters with the JAK2V617F-negative patients, does not overexpress PRV-1.
Figure 1. Experimental Design.
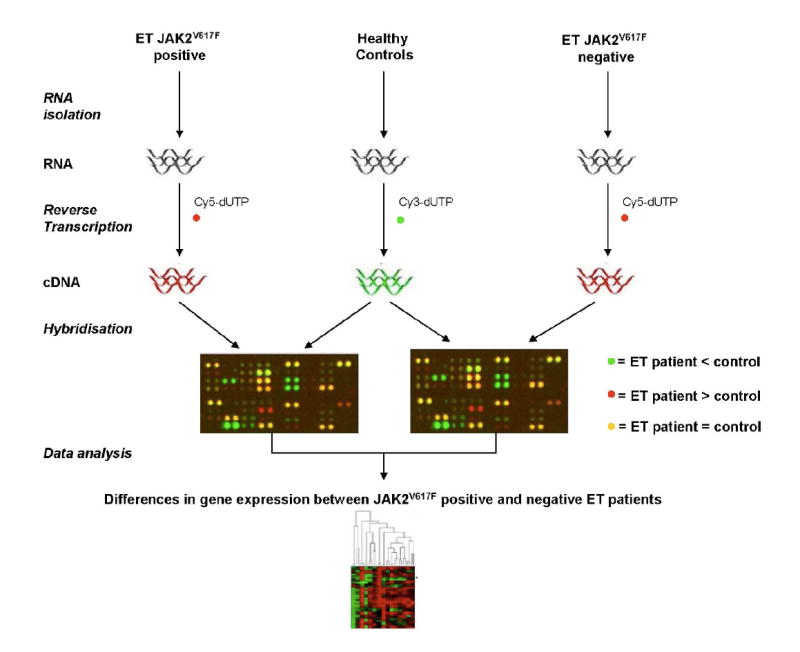
RNA was isolated from purified granulocytes of individual ET patients. Presence of the JAK2V617F mutation was determined for each patient by qRT-PCR. A control pool was generated consisting of RNA from isolated granulocytes of 50 healthy volunteers. Individual patient RNA, labeled with one fluorochrome, together with this control pool, labeled with a second flurochrome, was hybridized to cDNA arrays. Data analysis reveals genes whose expression is increased or decreased in ET patients relative to healthy controls. A two-sample t-test used to identify genes, which are differentially expressed between patients bearing the JAK2V617F mutation and those which do not (see Fig. 2).
Fig. 2. Gene Expression Profiling in Patients with ET.
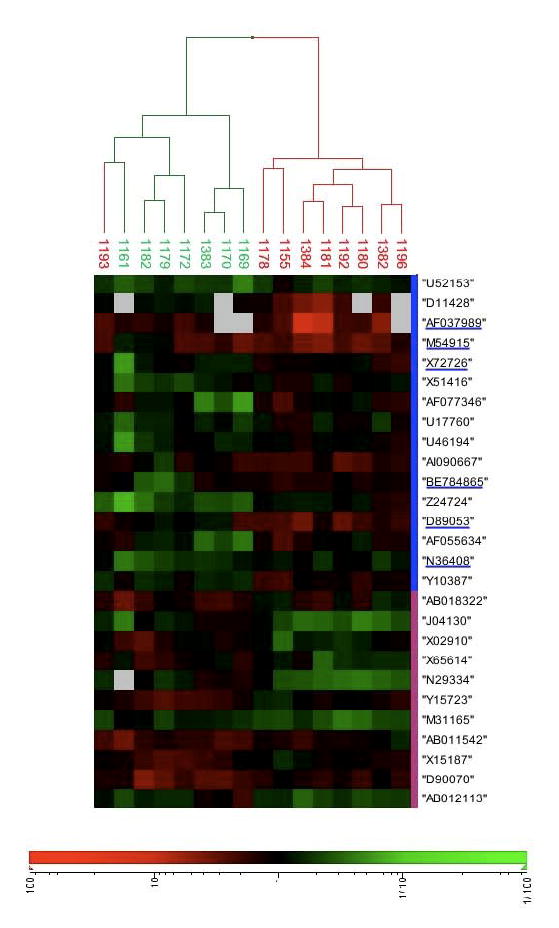
A cohort of 16 ET patients was analyzed for gene expression by cDNA microarray, as detailed in Fig. 1. A two-sample t-test was used to identify genes, which are differentially expressed between patients bearing the JAK2V617F mutation (shown in red) and those negative for JAK2V617F (shown in green). To control for multiple testing the obtained p-values are adjusted for the false discovery rate (fdr) [22, 23]. Differential expression was defined by p<0.05 (fdr corrected). Agglomerative hierarchical clustering was used to generate the dendrogram [37]. Columns represent individual patients and rows represent specific cDNAs identified by accession number. Gene expression is depicted according to the color scale shown below the figure. “1” indicates no difference in expression between patient and healthy controls, whereas “10” and “100” or “1/10” and “1/100” indicate the fold over- or underexpression respectively. White squares depict missing data points. Accession numbers of genes, whose transcription is regulated by the JAK7STAT pathway are underlined.
Characterization of the genes which discriminate between patients with and without JAK2V617F showed that 6 of the 27 are targets of the JAK/STAT pathway (Fig. 2) [24-28]. Interestingly, while these genes were overexpressed in JAK2V617F patients relative to healthy controls, this was not the case in non-V617F patients. This observation suggested that JAK/STAT signaling may be constitutively active in only a subset of ET patients, most notably those carrying the JAK2V617F mutation. In order to substantiate this hypothesis, we quantitated expression of two JAK/STAT target genes, the serine/threonine kinase Pim-1, which regulates cell cycle checkpoints by phosphorylating cell division cycle phosphatases and the suppressor of cytokine signaling-2 (SOCS-2), which regulates JAK/STAT signaling. A novel cohort of 16 ET patients, not previously analyzed by microarray, 8 expressing JAK2V617F and 8 without JAK2V617F , was examined. In ET patients not carrying the JAK2V617F mutation, Pim-1 was expressed at levels identical to those found in healthy controls, while SOCS-2 expression was slightly elevated (Fig. 3a and b). In contrast, both JAK/STAT targets were significantly overexpressed in ET patients carrying the JAK2V617F mutation. These data argue strongly that JAK/STAT pathways are selectively activated in JAK2V617F patients, but not in JAK2V617F-negative ET patients. We tested this conclusion directly by probing the posphorylation status of STAT3 in ET granulocytes. While all patients carrying the JAK2V617F mutation displayed constitutive STAT3 phosphorylation, none of the non-JAK2V617F patients did (Fig. 4a). Because these data argue strongly that other signal transduction pathways, besides JAK/STAT must be altered in JAK2V617F–negative patients, we probed the phosphorylation status of two additional signal transducers, AKT and p42/44 ERK1/2. While these kinases were consitutively phosphorylated in all JAK2V617F patients, their phosphorylation status differed among the JAK2V617F–negative patients tested (Figures 4 b and c).
Figure 3. Validation of gene expression in JAK2V617F and JAK2wt ET patients by Quantitative RT-PCR.
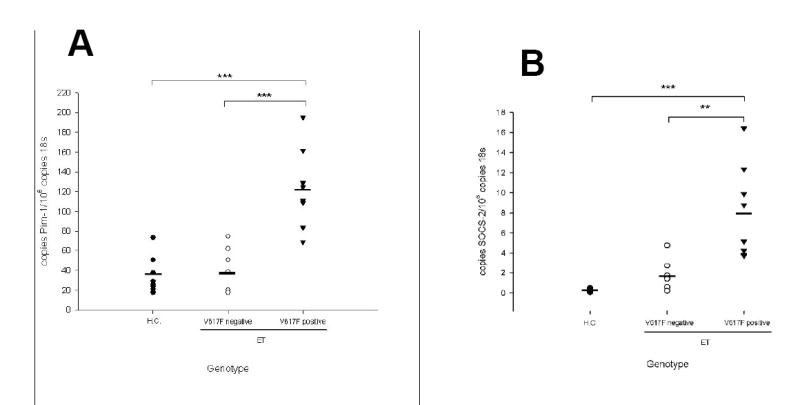
RNA was isolated from purified granulocytes of JAK2V617F-positive or JAK2V617F-negative ET patients and healthy controls as indicated and subjected to quantitative RT-PCR analysis for (A) Pim-1 and (B) SOCS-2 expression. A standard curve with known copy numbers of Pim-1 (A) or SOCS-2 (B) respectively and 18S rRNA was included on each plate. Sample copy numbers of target genes and 18S rRNA were determined from the standard curve and are expressed as relative ratios (molecules target gene per 106 18S molecules). The median is depicted by a vertical line; **, p< 0.001, *** p< 0.0001
Figure 4. Protein Phosphorylation in ET Patients with and without the JAK2V617F mutation.
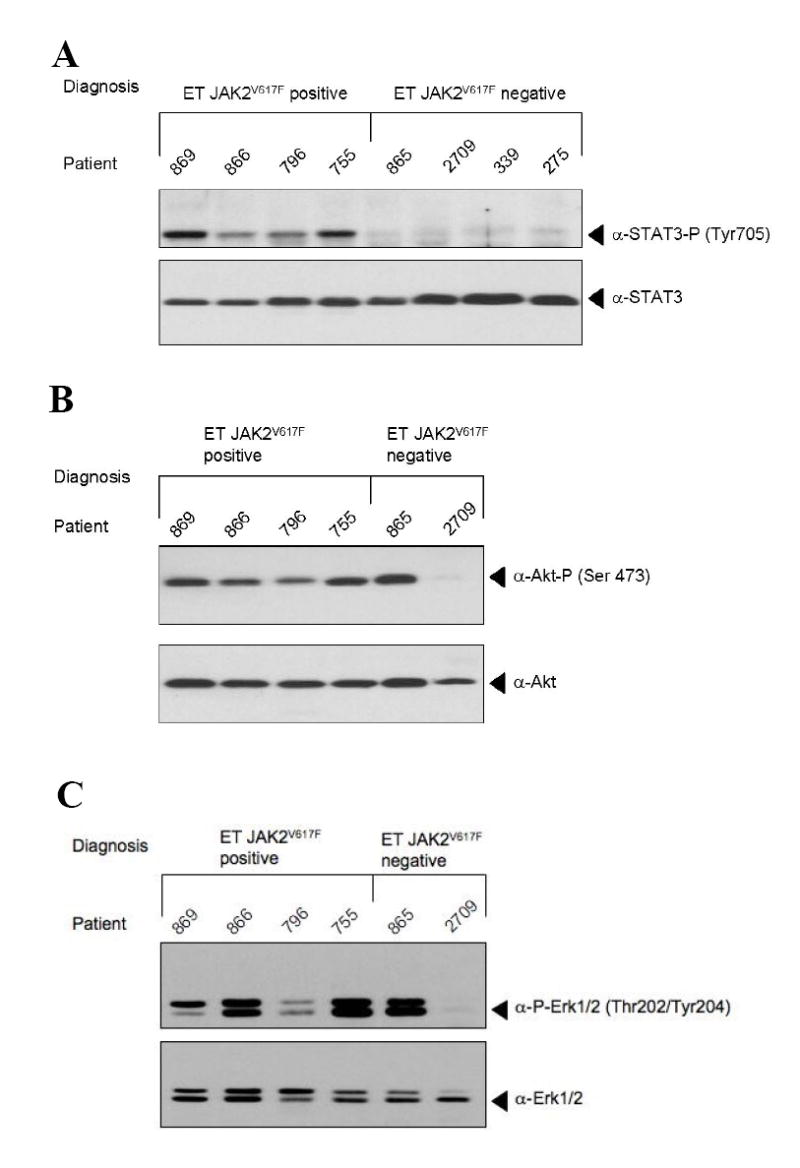
Total cellular protein was isolated from purified granulocytes of 8 ET patients, not previously used for microarray analysis. 30 μg of protein were subjected to Western Blot and hybridized with an antibody against (A) phospho STAT3 (top) or total STAT3 (bottom) (B) phospho AKT (top) or total AKT (bottom) or (C) phospho ERK1/2 p44/p42 MAP kinases (top) or total ERK1/2 p44/p42 MAP kinases (bottom).
DISCUSSION
The discovery of a point mutation in the JAK2 kinase (JAK2V617F) in only a subset of patients with ET highlighted the clinical observation that this disease comprises a heterogeneous group of disorders. While several recent observations in patients with polycythemia vera suggest that the JAK2V617F mutation is neither the sole nor the initial change leading to the development of this myeloproliferative disorder, its discovery nonetheless poses a significant increase in our understanding of molecular disease etiology [29-33]. For those remaining 8 – 10% of PV patients, as well as for the 50 % of ET patients, who do not carry the JAK2V617F mutation, however, the molecular cause of disease evolutions remains unclear. Recent data from Scott et al., describing mutations in exon 12 of the JAK2 kinase in non-JAK2V617F PV patients, raised the intriguing possibility that all MPDs arise from mutations within the JAK/STAT signaling pathway, albeit perhaps at different locations or in different proteins [13].
If this hypothesis were true, a limited number of proteins would be candidates for carrying mutations in MPD patients. In this case, high-throughput screening approaches with large numbers of MPD patients should rapidly reveal most alterations contributing to disease development. In fact, such projects are currently under way. Because receptors activating JAK/STAT molecules were included in the genes selected for analysis, a mutation in the thrombopoietin receptor, c-Mpl (MPLW515L), was discovered in a proportion (9%) of IMF patients [16]. However, to date, in the majority of non-V617F patients, no molecular alterations have been described.
If the converse hypothesis were true, namely, that mutations in molecules other than those participating in JAK/STAT signaling pathways, are involved in the molecular etiology of large proportions of non-JAK2V617F MPDs, alternative strategies to high-throughput screens should concurrently be employed to reveal novel candidates. Our data support this alternative hypothesis, by demonstrating that non-JAK2V617F ET patients both express lower levels of several JAK/STAT target genes and do not display constitutive STAT3 phosphorylation (Figs. 3 and 4a). Teofili et al. have recently investigated STAT3 phosphorylation in BM biopsies of ET patients. Similar to data presented here, these authors found that ET patients display heterogeneous STAT3 phosphorylation, some patients staining weakly and other strongly for phospho-STAT3 [34].
Our data do not entirely exclude the possibility that alterations in molecules more distantly affiliated with JAK2, for example, the negative regulators SOCS or CIS, are altered in nonJAK2V617F patients. Such changes may lead to upregulation of a discrete and much smaller subset of JAK/STAT targets, which may exclude those genes investigated by us. We consider this less likely since none of the 6 JAK/STAT target genes investigated were strongly up-regulated relative to healthy controls in non-JAK2V617F patients (Fig. 2). Rather, we propose that a large proportion of nonJAK2V617F patients carry alterations in yet unidentified molecules which act separately from JAK/STAT signaling. Analysis of large cohorts of non-JAK2V617F ET patients is required to determine whether this subset consists of patients with diverse molecular alterations.
These observations suggest two immediate implications. Firstly, it appears unlikely that non-JAK2V617F ET patients will respond therapeutically to the various JAK2 inhibitors currently being developed for trials in MPD. Secondly, more profound biological and cellular investigations are required in non-JAK2V617F patients to locate potential candidates for molecular disease etiology. Two questions in particular remain important: can non-JAK2V617F ET be further subdivided into specific molecular sub-groups, each with its own molecular alteration? Gene expression analyses, such as those presented here, conducted on larger cohorts of patients, will be able to answer this question. Secondly, which molecules or pathways are affected in this/these groups? Data from Dr. Axelrad’s laboratory has long suggested that growth factor hypersensitivity in MPD patients is mutually exclusive. For example, patients acquire either a hypersensitivity to IGF-1 or to TPO, but not both [35, 36]. Once ET patients can be assigned to molecular subgroups by gene expression analysis, it will be important to assess whether growth factor hypersensitivity and transcriptional profile correlate. If so, the combination of growth factor hypersensitivity and alterations in gene expression may quickly yield novel candidates in the search for molecular causes of non-JAK2V617F MPD.
Table 1. Genes Differentially Expressed between JAK2V617F and non-JAK2V617F ET Patients.
For each gene, the following information is given: GenBank Accession Number; the fold change in expression versus healthy controls, stratified by JAK2V617F and nonJAK2V617F patients; the difference in fold expression between JAK2V617F and non-JAK2V617F; p-Value for the difference between JAK2V617F and non-JAK2V617F; Gene Name; Gene Function and Homology; Category of Cellular Process in which the gene is involved. Sources for Gene Annotation: http://source.stanford.edu/cgi-bin/source/sourceSearch and http://www.ncbi.nlm.nih.gov/sites/entrez (OMIM)
| Acc.No. | Fold Change vs HC | Difference Jak2V617F vs non-Jak2V617F | p-Value | Name | Function/Homology | Category | |
|---|---|---|---|---|---|---|---|
| Jak2V617F | non-Jak2V617F | ||||||
| AF037989 | 3,91 | 1,12 | 3,48 | 0,047 | Suppressor of cytokine signalling 2 | regulation of JAK/STAT and IGF1R mediated cell signalling | signal-transduction |
| D11428 | 1,82 | 0,63 | 2,89 | 0,01 | Peripheral myelin protein 22 | involved in growth regulation | signal-transduction |
| Z24724 | 0,91 | 0,40 | 2,25 | 0,032 | H.sapiens poly A site DNA (chromosome = 3) | hydrolysis of ATP | cation transport |
| D89053 | 2,09 | 1,10 | 1,90 | 0,002 | Acetyl-CoA synthetase long chain family member 3 | activation of long-chain fatty acids for both the synthesis of cellular lipids and their degradation via beta-oxidation | fatty acid metabolism |
| AF055634 | 1,28 | 0,69 | 1,86 | 0,007 | Unc-5 homolog (C.elegans) | mediate the repellent response to netrin and acts as a dependence receptor required for apoptosis induction when not associated with netrin ligand | cell surface receptor |
| AF077346 | 1,31 | 0,73 | 1,79 | 0,017 | Interleukin 18 receptor accessory protein | required for high affinity binding of interleukin 18 (IL-18) to its receptor | signal-transduction |
| X72726 | 1,21 | 0,74 | 1,64 | 0,022 | Hypoxia-inducible factor 1, alpha subunit | essential role in cellular and systemic homeostatic responses to hypoxia | transcription factor |
| Y10387 | 1,32 | 0,82 | 1,62 | 0,017 | 3’-phosphoadenosine 5’-phosphosulfate synthase 1 | synthesis of 3’-phosphoadenylylsulfate from adenosinetriphosphate | sulfur metabolism |
| N36408 | 0,86 | 0,53 | 1,62 | 0,008 | Fos-like antigen 2 | cell proliferation, differentiation, and transformation | transcription |
| X51416 | 1,02 | 0,64 | 1,60 | 0,014 | Steroid hormone receptor hERR1 | steroid hormone receptor | nuclear receptor |
| M54915 | 2,63 | 1,70 | 1,55 | 0,044 | Pim-1 oncogene | cell proliferation and survival | kinase |
| BE784865 | 1,30 | 0,84 | 1,54 | 0,017 | Thrombomodulin | activation of protein C after binding of thrombin | cell surface receptor |
| U46194 | 1,06 | 0,69 | 1,53 | 0,029 | Renal tumor antigen | high similarities to kinase domain of diverse MAP- Kinases | signal transduction |
| U17760 | 1,04 | 0,68 | 1,52 | 0,046 | Human laminin S B3 chain | encodes the b 3 subunit of laminin 5, promotes gap junctional communication | signal transduction |
| U52153 | 0,71 | 0,47 | 1,51 | 0,028 | Potassium channel Kir3.2 | K+ channel | signal transduction |
| AI090667 | 1,79 | 1,19 | 1,5 | 0,04 | Lamin B1 | framework for the nuclear evelope and interaction with chromatin | nucleus stability |
| N29334 | 0,44 | 0,90 | 0,48 | 0,0008 | Topoisomerase (DNA) II alpha 170 kDa | controls and alters the topologic states of DNA during transcription | transcription |
| J04130 | 0,45 | 0,91 | 0,49 | 0,032 | Chemokine (C-C motif) ligand 4 (CCL4) | secreted protein with chemokinetic properties | signal-transduction |
| X02910 | 0,79 | 1,49 | 0,53 | 0,003 | Tumor necrosis factor alpha | cytokine | signal-transduction |
| D90070 | 1,39 | 2,45 | 0,56 | 0,004 | Phorbol-12-myristate- 13-acetat-induced protein 1 | contains the BH3 motif of the anti-apoptotic protein BCl2 | apoptosis |
| M31165 | 0,44 | 0,75 | 0,58 | 0,0006 | Tumor necrosis factor alpha induced protein 6 (TNFAIP6) | member of the hyaluronan-binding protein family, function unkown | |
| AB012113 | 0,56 | 0,95 | 0,59 | 0,04 | CC PARC precursor (CCL18) | chemotactic properties | chemokine |
| Y15723 | 1,08 | 1,82 | 0,59 | 0,001 | Guanylate cyclase 1, soluble, alpha 3 | catalyzes the conversion of GTP to the second messenger cGMP and functions as the main receptor for nitric oxide | signal transduction |
| X15187 | 1,07 | 1,72 | 0,62 | 0,006 | Heat shock protein 90kDa beta, member 1 | molecular chaperone that functions in the processing and transport of secreted proteins | protein synthesis |
| X65614 | 0,82 | 1,29 | 0,63 | 0,036 | S100 calcium binding protein P | Ca binding | calcium binding |
| AB018322 | 1,14 | 1,79 | 0,63 | 0,032 | Transmembrane and coiled-coil domain family 1 (TMCC1) | unkown | |
| AB011542 | 1,31 | 1,97 | 0,66 | 0,03 | Multiple EGF-like domains 9 | mediating of cell-attachment, -migration and - organization | extracellular matrix |
Acknowledgments
Our first and foremost thanks go to the patients who consented to be included in this study. Our gratitude extends to their physicians and nurses, whose contribution is pivotal to this endeavor. We sincerely thank Prof. Dr. K. K. Geiger for his continued support.
This work was supported by grants from the National Cancer Insitute (1 PO1 CA108671 to HLP) and the Else-Kröner-Fresenius-Stiftung (P 42-01 to HLP). BW holds a fellowship from the German José Carreras Leukemia Foundation. BA and HLP are members of the MPD Research Consortium.
Footnotes
Publisher's Disclaimer: This is a PDF file of an unedited manuscript that has been accepted for publication. As a service to our customers we are providing this early version of the manuscript. The manuscript will undergo copyediting, typesetting, and review of the resulting proof before it is published in its final citable form. Please note that during the production process errors may be discovered which could affect the content, and all legal disclaimers that apply to the journal pertain.
References
- 1.Gisslinger H. Update on diagnosis and management of essential thrombocythemia. Seminars in thrombosis and hemostasis. 2006;32:430–436. doi: 10.1055/s-2006-942764. [DOI] [PubMed] [Google Scholar]
- 2.Pearson TC. Diagnosis and classification of erythrocytoses and thrombocytoses. Baillieres Clinical Haematology. 1998;11:695–720. doi: 10.1016/s0950-3536(98)80035-8. [DOI] [PubMed] [Google Scholar]
- 3.Murphy S. Diagnostic criteria and prognosis in polycythemia vera and essential thrombocythemia. Semin Hematol. 1999;36:9–13. [PubMed] [Google Scholar]
- 4.Finazzi G, Harrison C. Essential thrombocythemia. Seminars in hematology. 2005;42:230–238. doi: 10.1053/j.seminhematol.2005.05.022. [DOI] [PubMed] [Google Scholar]
- 5.Weinberg RS. In vitro erythropoiesis in polycythemia vera and other myeloproliferative disorders. Seminars in hematology. 1997;34:64–69. [PubMed] [Google Scholar]
- 6.Griesshammer M, Klippel S, Strunck E, et al. PRV-1 mRNA expression discriminates two types of Essential Thrombocythemia. Annals of hematology. 2004;83:364–370. doi: 10.1007/s00277-004-0864-9. [DOI] [PubMed] [Google Scholar]
- 7.Horikawa Y, Matsumura I, Hashimoto K, et al. Markedly reduced expression of platelet c-mpl receptor in essential thrombocythemia. Blood. 1997;90:4031–4038. [PubMed] [Google Scholar]
- 8.Goerttler PS, Dörner E, Johansson PL, et al. Thrombotic Complications in four subpopulations of patients with ET defined by c-Mpl protein expression and PRV-1 mRNA levels. Haematologica. 2005 [PubMed] [Google Scholar]
- 9.Baxter EJ, Scott LM, Campbell PJ, et al. Acquired mutation of the tyrosine kinase JAK2 in human myeloproliferative disorders. Lancet. 2005;365:1054–1061. doi: 10.1016/S0140-6736(05)71142-9. [DOI] [PubMed] [Google Scholar]
- 10.Levine R, Wadleigh M, Cools J, et al. Activating mutation in the tyrosine kinase JAK2 in polycythemia vera, essential thrombocythemia, and myeloid metaplasia with myelofibrosis. Cancer Cell. 2005;7:387–397. doi: 10.1016/j.ccr.2005.03.023. [DOI] [PubMed] [Google Scholar]
- 11.Wernig G, Mercher T, Okabe R, Levine RL, Lee BH, Gilliland DG. Expression of Jak2V617F causes a polycythemia vera-like disease with associated myelofibrosis in a murine bone marrow transplant model. Blood. 2006;107:4274–4281. doi: 10.1182/blood-2005-12-4824. Epub 2006 Feb 4214. [DOI] [PMC free article] [PubMed] [Google Scholar]
- 12.Lacout C, Pisani DF, Tulliez M, Moreau Gachelin F, Vainchenker W, Villeval JL. JAK2V617F expression in murine hematopoietic cells leads to MPD mimicking human PV with secondary myelofibrosis. Blood. 2006;108:1652–1660. doi: 10.1182/blood-2006-02-002030. [DOI] [PubMed] [Google Scholar]
- 13.Scott LM, Tong W, Levine RL, et al. JAK2 exon 12 mutations in polycythemia vera and idiopathic erythrocytosis. The New England journal of medicine. 2007;356:459–468. doi: 10.1056/NEJMoa065202. [DOI] [PMC free article] [PubMed] [Google Scholar]
- 14.Lasho TL, Pardanani A, McClure RF, et al. Concurrent MPL515 and JAK2V617F mutations in myelofibrosis: chronology of clonal emergence and changes in mutant allele burden over time. British journal of haematology. 2006;135:683–687. doi: 10.1111/j.1365-2141.2006.06348.x. [DOI] [PubMed] [Google Scholar]
- 15.Pardanani AD, Levine RL, Lasho T, et al. MPL515 mutations in myeloproliferative and other myeloid disorders: a study of 1182 patients. Blood. 2006;108:3472–3476. doi: 10.1182/blood-2006-04-018879. [DOI] [PubMed] [Google Scholar]
- 16.Pikman Y, Lee BH, Mercher T, et al. MPLW515L is a novel somatic activating mutation in myelofibrosis with myeloid metaplasia. PLoS medicine. 2006;3:e270. doi: 10.1371/journal.pmed.0030270. [DOI] [PMC free article] [PubMed] [Google Scholar]
- 17.Goerttler PS, Kreutz C, Donauer J, et al. Gene expression profiling in polycythaemia vera: overexpression of transcription factor NF-E2. British journal of haematology. 2005;129:138–150. doi: 10.1111/j.1365-2141.2005.05416.x. [DOI] [PubMed] [Google Scholar]
- 18.Steimle C, Lehmann U, Temerinac S, et al. Biomarker analysis in polycythemia vera under interferon-alpha treatment: clonality, EEC, PRV-1, and JAK2 V617F. Annals of hematology. 2007;86:239–244. doi: 10.1007/s00277-006-0214-1. [DOI] [PubMed] [Google Scholar]
- 19.Eisen MB, Brown PO. DNA arrays for analysis of gene expression. Methods in enzymology. 1999;303:179–205. doi: 10.1016/s0076-6879(99)03014-1. [DOI] [PubMed] [Google Scholar]
- 20.Brazma A, Hingamp P, Quackenbush J, et al. Minimum information about a microarray experiment (MIAME)-toward standards for microarray data. Nat Genet. 2001;29:365–371. doi: 10.1038/ng1201-365. [DOI] [PubMed] [Google Scholar]
- 21.Workman C, Jensen LJ, Jarmer H, et al. A new non-linear normalization method for reducing variability in DNA microarray experiments. Genome Biol. 2002;3:0048.0041–0048.0016. doi: 10.1186/gb-2002-3-9-research0048. [DOI] [PMC free article] [PubMed] [Google Scholar]
- 22.Storey JD, Tibshirani R. Methods in molecular biology. Vol. 224. Clifton, NJ: 2003. Statistical methods for identifying differentially expressed genes in DNA microarrays; pp. 149–157. [DOI] [PubMed] [Google Scholar]
- 23.Benjamini Y, Hochberg Y. Controlling the false discovery rate: a practical and powerful approach to multiple testing. J Royal Stat Soc. 1995;57:289–295. [Google Scholar]
- 24.Liu H, Ge N, Yu KT, Krolikowski D, Zilberstein A, Hahn CS. Prediction of IFN-gamma regulated gene transcription. In silico biology. 2004;4:489–505. [PubMed] [Google Scholar]
- 25.Dauer DJ, Ferraro B, Song L, et al. Stat3 regulates genes common to both wound healing and cancer. Oncogene. 2005;24:3397–3408. doi: 10.1038/sj.onc.1208469. [DOI] [PubMed] [Google Scholar]
- 26.Xu Q, Briggs J, Park S, et al. Targeting Stat3 blocks both HIF-1 and VEGF expression induced by multiple oncogenic growth signaling pathways. Oncogene. 2005;24:5552–5560. doi: 10.1038/sj.onc.1208719. [DOI] [PubMed] [Google Scholar]
- 27.Mikkers H, Nawijn M, Allen J, et al. Mice deficient for all PIM kinases display reduced body size and impaired responses to hematopoietic growth factors. Molecular and cellular biology. 2004;24:6104–6115. doi: 10.1128/MCB.24.13.6104-6115.2004. [DOI] [PMC free article] [PubMed] [Google Scholar]
- 28.Zimmerer J, Lesinski G, Kondadasula S, et al. IFN-{alpha}-Induced Signal Transduction, Gene Expression, and Antitumor Activity of Immune Effector Cells Are Negatively Regulated by Suppressor of Cytokine Signaling Proteins. J Immunol. 2007;178:4832–4845. doi: 10.4049/jimmunol.178.8.4832. [DOI] [PubMed] [Google Scholar]
- 29.Cario H, Goerttler PS, Steimle C, Levine RL, Pahl HL. The JAK2V617F mutation is acquired secondary to the predisposing alteration in familial polycythaemia vera. Br J Haematol. 2005;130:800–801. doi: 10.1111/j.1365-2141.2005.05683.x. [DOI] [PubMed] [Google Scholar]
- 30.Kralovics R, Teo SS, Li S, et al. Acquisition of the V617F mutation of JAK2 is a late genetic event in a subset of patients with myeloproliferative disorders. Blood. 2006;4:4. doi: 10.1182/blood-2005-11-009605. [DOI] [PubMed] [Google Scholar]
- 31.Theocharides A, Boissinot M, Girodon F, et al. Leukemic blasts in transformed JAK2-V617F positive myeloproliferative disorders are frequently negative for the JAK2-V617F mutation. Blood. 2007 doi: 10.1182/blood-2006-12-062125. Epub:ahead of print. [DOI] [PubMed] [Google Scholar]
- 32.Ishii T, Bruno E, Hoffman R, Xu M. Involvement of various hematopoietic-cell lineages by the JAK2V617F mutation in polycythemia vera. Blood. 2006;108:3128–3134. doi: 10.1182/blood-2006-04-017392. [DOI] [PubMed] [Google Scholar]
- 33.Nussenzveig RH, Swierczek SI, Jelinek J, et al. Polycythemia vera is not initiated by JAK2V617F mutation. Experimental hematology. 2007;35:32–38. doi: 10.1016/j.exphem.2006.11.012. [DOI] [PubMed] [Google Scholar]
- 34.Teofili L, Martini M, Cenci T, et al. Different STAT-3 and STAT-5 phosphorylation discriminates among Ph-negative chronic myeloproliferative diseases and is independent of the V617F JAK-2 mutation. Blood. 2007;110:354–359. doi: 10.1182/blood-2007-01-069237. [DOI] [PubMed] [Google Scholar]
- 35.Axelrad AA, Eskinazi D, Correa PN, Amato D. Hypersensitivity of circulating progenitor cells to megakaryocyte growth and development factor (PEG-rHu MGDF) in essential thrombocythemia. Blood. 2000;96:3310–3321. [PubMed] [Google Scholar]
- 36.Correa PN, Eskinazi D, Axelrad AA. Circulating erythroid progenitors in polycythemia vera are hypersensitive to insulin-like growth factor-1 in vitro: studies in an improved serum-free medium. Blood. 1994;83:99–112. [PubMed] [Google Scholar]
- 37.Kaufman L, Rousseeuw P. Finding Groups in Data: An Introduction to Cluster Analysis. New York: John Wiley & Sons; 1990. [Google Scholar]