

Abstract
Nicotine dependence is one of the world’s leading causes of preventable death. To discover genetic variants that influence risk for nicotine dependence, we targeted over 300 candidate genes and analyzed 3713 single nucleotide polymorphisms (SNPs) in 1050 cases and 879 controls. The Fagerström test for nicotine dependence (FTND) was used to assess dependence, in which cases were required to have an FTND of 4 or more. The control criterion was strict: control subjects must have smoked at least 100 cigarettes in their lifetimes and had an FTND of 0 during the heaviest period of smoking. After correcting for multiple testing by controlling the false discovery rate, several cholinergic nicotinic receptor genes dominated the top signals. The strongest association was from an SNP representing CHRNB3, the β3 nicotinic receptor subunit gene (P = 9.4 × 10⁻⁵). Biologically, the most compelling evidence for a risk variant came from a non-synonymous SNP in the α5 nicotinic receptor subunit gene CHRNA5 (P = 6.4 × 10⁻⁴). This SNP exhibited evidence of a recessive mode of inheritance, resulting in individuals having a 2-fold increase in risk of developing nicotine dependence once exposed to cigarette smoking. Other genes among the top signals were KCNJ6 and GABRA4. This study represents one of the most powerful and extensive studies of nicotine dependence to date and has found novel risk loci that require confirmation by replication studies.
INTRODUCTION
The World Health Organization estimates that if current trends continue, the annual number of deaths from tobacco-related diseases will double from five million in the year 2000 to 10 million in 2020 (1,2). Nicotine, a naturally occurring alkaloid found in tobacco, mimics acetylcholine, and nicotine’s ability to bind to nicotinic cholinergic receptors (nAChRs) underlies the molecular basis of nicotine dependence [susceptibility to tobacco addiction (MIM 188890)]. Chronic nicotine exposure produces long-lasting behavioral and physiological changes that include increased synaptic strength, altered gene expression and nAChR up-regulation (3). Although nAChRs are expressed throughout the central nervous system, the addictive effects of nicotine are thought to be mediated through mesocorticolimbic dopamine (DA) pathways (4). It is believed that the interplay among glutamate, dopamine and gamma-aminobutyric acid (GABA) systems is critical for the reinforcing effects of nicotine (3,5). Cigarettes are the predominant form of tobacco used worldwide (6), and genetic factors are important to the etiology of nicotine dependence, with estimates of the heritability ranging from 44 to 60% (7).
Efforts to identify susceptibility loci influencing cigarette smoking behavior through association studies have used a candidate gene approach with both case–control and family-based designs. Several candidate genes that may influence smoking have been studied, including nicotinic receptors (8-10), nicotine metabolizing genes (11-13), dopamine system receptors (14-17), GABA receptors (18) and other neurotransmitters and receptors (19-21). There appears to be very little concordance among linkage findings and association findings in candidate genes (reviewed in 22). The only genome-wide association study (GWAS) to date is by the companion paper by Bierut et al. (23) which was conducted in parallel with our study and used the same case–control sample.
Our approach was to target an extensive set of candidate genes for single nucleotide polymorphism (SNP) genotyping to detect variants associated with nicotine dependence using a case–control design. We targeted over 300 genes for genotyping, with a design that allowed for approximately 4000 SNPs. These included the gene families encoding nicotinic receptors, dopaminergic receptors and GABA receptors, which are known to be part of the biological pathways involved in dependence. This was done in conjunction with a GWAS conducted in the companion paper by Bierut et al. (23). Both studies used a large sample of cases and controls of European descent. The 1050 nicotine dependent cases were contrasted with a unique control sample of 879 individuals who are non-dependent smokers. The size of the sample and strict control criteria should provide ample power to detect variants influencing nicotine dependence, but the depth of the coverage of known candidate genes is ambitious and requires delicate handling to deal with the complex issue of multiple testing. We used the false discovery rate (FDR) to limit the effects of multiple testing (24,25) and to report on the top FDR-controlled list of associations.
RESULTS
Our list of candidate genes initially numbered 448 and was divided into categories ‘A’ and ‘B’. All 55 category A genes were targeted for SNP genotyping, but because it was beyond our resources to target all of the remaining 393 category B genes, these were prioritized for SNP genotyping according to the results of the pooled genotyping in the parallel GWAS (23). Table 1 shows a summary of the results of the pooled genotyping in the candidate genes. Out of the 393 category B genes considered for SNP selection, 296 were targeted for individual genotyping in our candidate gene study. These were chosen using the lowest corrected minimum P-values, as defined in Eq. (1), where the cutoff was approximately P ≤ 0.95. We individually genotyped 4309 SNPs in these candidate genes, and after quality control filtering, 3713 SNPs were tested for association. There were 515 SNPs tested for 52 category A genes and 3198 SNPs tested for 296 category B genes.
Table 1.
Results of the pooled genotyping in the candidate genes from the parallel GWAS
| Category | Candidate genes | Genes tested | SNPs tested | Corrected minimum | P-value (Pcorr) | |
|---|---|---|---|---|---|---|
| Min | Max | μ ± σa | ||||
| A | 55 | 52 | 1 604 | 0.0017 | 0.94 | 0.33 ± 0.28 |
| B | 393 | 367 | 29 071 | 0.0021 | 0.99 | 0.41 ± 0.28 |
| Total | 448 | 419 | 30 675 | |||
A total of 2 177 718 SNPs passed quality control (QC) measures and were tested for association. The results were used to rank the category B genes for SNP selection. The ‘genes tested’ and ‘SNPs tested’ columns show the number of genes and number of SNPs in those genes that passed QC and were tested for association. The minimum P-value over all SNPs tested for association in the pooled genotyping within a gene is corrected for the number of tests according to Eq. (1).
Mean ± standard deviation.
In the individual genotyping for the candidate genes, the 10 smallest P-values from our primary association analysis ranged from 9.36 × 10⁻⁵ to 1.22 × 10⁻³. There were 39 SNPs with an FDR <40%, indicating the presence of about 24 true signals (Tables 2 and 3; Fig. 1). These top 39 signals were dominated by nicotinic receptor genes (Figs 2 and 3). The top five FDR values corresponded to the genes CHRNB3, CHRNA3 and CHRNA5 and ranged from 0.056 to 0.166. Our best evidence was that four of these five signals were from genuine associations and were not due to random effects. The permutation FDR estimates were roughly the same as the FDR, differing by not more than 0.02, with a minimum permutation FDR of 0.07 at the SNP rs6474413. After selecting a single SNP from each linkage disequilibrium (LD) bin, three of these 39 SNPs showed significant evidence of a non-multiplicative model (Table 4) and several SNPs were found to have a significant gender by genotype interaction (Table 5; also see Supplementary Material, Table S1 for a list of all SNPs from Table 2 showing gender by genotype P-values and gender-specific odds ratios).
Table 2.
Top associations with nicotine dependence where the weighted FDR is <40%
| SNP | Gene | Function | Category | Chr | Pos (bp) | LD Bin ID | Min (r2) | Risk allele | Primary P-value | Rank | FDR |
|---|---|---|---|---|---|---|---|---|---|---|---|
| rs6474413 | CHRNB3 | FP | A | 8 | 42,670,221 | 8–19 | 0.991 | T (0.81/0.76) | 9.36E-05 | 1 | 0.056 |
| rs10958726 | CHRNB3 | LD BIN | A | 8 | 42,655,066 | 8–19 | 0.991 | T (0.81/0.76) | 1.33E-04 | 2 | 0.056 |
| rs578776 | CHRNA3 | UTR | A | 15 | 76,675,455 | – | – | G (0.78/0.72) | 3.08E-04 | 3 | 0.086 |
| rs6517442 | KCNJ6 | FP | B | 21 | 38,211,816 | – | – | C (0.34/0.28) | 5.62E-04 | 4 | 0.344 |
| rs16969968a | CHRNA5 | NONSYN | A | 15 | 76,669,980 | 15–13 | 0.989 | A (0.38/0.32) | 6.42E-04 | 5 | 0.134 |
| rs3762611 | GABRA4 | FP | B | 4 | 46,838,216 | 4–71 | 0.939 | G (0.93/0.91) | 9.22E-04 | 6 | 0.344 |
| rs1051730 | CHRNA3 | SYNON | A | 15 | 76,681,394 | 15–13 | 0.989 | A (0.38/0.32) | 9.93E-04 | 7 | 0.166 |
| rs10508649b,c | PIP5K2A | SYNON | B | 10 | 22,902,288 | – | – | T (1.00/0.99) | 1.02E-03 | 8 | 0.344 |
| rs17041074b | DAO | INTRON | B | 12 | 107,794,340 | – | – | A (0.27/0.26) | 1.12E-03 | 9 | 0.344 |
| rs3762607b | GABRA4 | FP | B | 4 | 46,837,266 | 4–71 | 0.939 | A (0.93/0.91) | 1.22E-03 | 10 | 0.344 |
| rs2767 | CHRND | UTR | A | 2 | 233,225,579 | 2–68 | 0.887 | G (0.39/0.34) | 1.50E-03 | 11 | 0.209 |
| rs6772197b | DOCK3 (GRM2) | INTRON | B | 3 | 51,126,839 | 3–46 | 0.923 | A (0.84/0.83) | 1.66E-03 | 12 | 0.384 |
| rs3021529b | AVPR1A | UTR | B | 12 | 61,831,947 | 12–10 | 0.842 | G (0.86/0.85) | 1.73E-03 | 13 | 0.384 |
| rs1206549 | CLTCL1 | INTRON | B | 22 | 17,590,414 | 22–5 | 0.996 | G (0.86/0.82) | 1.75E-03 | 14 | 0.384 |
| rs637137 | CHRNA5 | INTRON | A | 15 | 76,661,031 | 15–3 | 0.801 | T (0.81/0.76) | 2.82E-03 | 22 | 0.336 |
| rs3791729 | CHRND | INTRON | A | 2 | 233,220,802 | 2–68 | 0.887 | A (0.36/0.32) | 3.39E-03 | 25 | 0.344 |
| rs4531 | DBH | NONSYN | A | 9 | 133,538,924 | – | – | G (0.93/0.91) | 5.10E-03 | 30 | 0.344 |
| rs3025382a | DBH | INTRON | A | 9 | 133,531,875 | – | – | G (0.90/0.88) | 5.14E-03 | 31 | 0.344 |
| rs7877 | FMO1 | UTR | A | 1 | 167,986,548 | 1–60 | 0.890 | C (0.74/0.70) | 6.33E-03 | 38 | 0.344 |
| rs6320b | HTR5A | SYNON | A | 7 | 154,300,269 | – | – | T (0.72/0.71) | 6.50E-03 | 39 | 0.344 |
| rs4802100b | CYP2B6 | FP | A | 19 | 46,187,865 | 19–4 | 0.995 | G (0.10/0.08) | 6.76E-03 | 41 | 0.344 |
| rs2304297 | CHRNA6 | UTR | A | 8 | 42,727,356 | 8–52 | 0.830 | G (0.79/0.75) | 6.91E-03 | 42 | 0.344 |
| rs3760657 | CYP2B6 | FP | A | 19 | 46,187,273 | 19–4 | 0.995 | G (0.10/0.08) | 6.98E-03 | 43 | 0.344 |
| rs2276560 | CHRNG | LD BIN | A | 2 | 233,276,424 | 2–63 | 0.931 | T (0.77/0.74) | 7.42E-03 | 44 | 0.344 |
| rs742350 | FMO1 | SYNON | A | 1 | 167,981,702 | 1–7 | 0.971 | C (0.87/0.84) | 8.45E-03 | 48 | 0.344 |
| rs684513 | CHRNA5 | INTRON | A | 15 | 76,645,455 | 15–3 | 0.801 | C (0.82/0.78) | 8.72E-03 | 49 | 0.344 |
| rs510769a | OPRM1 | INTRON | A | 6 | 154,454,133 | – | – | T (0.27/0.24) | 9.84E-03 | 58 | 0.344 |
| rs4245150b | DRD2 | LD BIN | A | 11 | 112,869,857 | 11–8 | 0.998 | G (0.37/0.36) | 1.08E-02 | 61 | 0.344 |
| rs3743078 | CHRNA3 | INTRON | A | 15 | 76,681,814 | 15–3 | 0.801 | G (0.83/0.79) | 1.10E-02 | 63 | 0.344 |
| rs1657273b | HTR5A | LD BIN | A | 7 | 154,317,817 | 7–29 | 0.976 | G (0.69/0.68) | 1.11E-02 | 64 | 0.344 |
| rs17602038 | DRD2 | LD BIN | A | 11 | 112,869,901 | 11–8 | 0.998 | C (0.37/0.36) | 1.17E-02 | 69 | 0.344 |
| rs3813567 | CHRNB4 | FP | A | 15 | 76,721,606 | – | – | A (0.83/0.79) | 1.18E-02 | 70 | 0.344 |
| rs893109 | HTR5A | LD BIN | A | 7 | 154,330,522 | 7–29 | 0.976 | G (0.69/0.68) | 1.24E-02 | 73 | 0.344 |
| rs16864387 | FMO4 | UTR | A | 1 | 168,015,501 | 1–7 | 0.971 | T (0.87/0.84) | 1.28E-02 | 74 | 0.344 |
| rs6045733b | PDYN | LD BIN | A | 20 | 1,898,858 | 20–32 | 0.810 | G (0.66/0.65) | 1.55E-02 | 84 | 0.384 |
| rs4953 | CHRNB3 | SYNON | A | 8 | 42,706,816 | 8–13 | 1.000 | G (0.97/0.95) | 1.61E-02 | 85 | 0.384 |
| rs4952 | CHRNB3 | SYNON | A | 8 | 42,706,222 | 8–13 | 1.000 | C (0.97/0.95) | 1.63E-02 | 87 | 0.384 |
| rs6749955 | CHRNG | LD BIN | A | 2 | 233,263,422 | 2–63 | 0.931 | T (0.77/0.73) | 1.70E-02 | 91 | 0.384 |
| rs7517376 | FMO1 | SYNON | A | 1 | 167,983,945 | 1–7 | 0.971 | A (0.87/0.84) | 1.80E-02 | 95 | 0.384 |
SNPs from category A genes were weighted 10-fold more heavily than those from category B genes when estimating FDR. The signals are sorted by the primary two-degree-of-freedom P-value of adding the genotype term and the genotype by gender interaction term to the base model in the logistic regression. SNPs with function ‘FP’ are within the footprint of the gene, defined for display purposes as ±10 kb of the transcribed region. Those labeled LD BIN are outside of the footprint and were selected for genotyping for being in LD with SNPs near an exon. Genes in parentheses are the candidate genes for which the SNP was selected. The ‘LD Bin ID’ column identifies LD bins; SNPs with the same LD Bin ID effectively produce a single association signal. We report the minimum correlation between the tag and other SNPs in the bin in the ‘Min (r2)’ column. The rank is determined by the primary P-value in all 3713 genotyped SNPs. All alleles were reported from the positive strand. The frequency of the risk allele (the allele more frequent in cases than in controls) in cases p and controls q is reported with the notation p/q.
There is significant evidence for a non-multiplicative model (Table 4) (which shows one SNP per LD bin).
There is significant evidence for gender-specific risk (Table 5) (which shows one SNP per LD bin).
Very low minor allele frequency.
Table 3.
Details of all category A genes and any category B genes with SNPs among our top signals (i.e. SNPs that appear in Table 2)
| Gene | Chr | 5′ position (Mb) | Size (kb) | Strand | SNPs tested | SNPs tested per kb | SNPs in top signals |
|---|---|---|---|---|---|---|---|
| Category A | |||||||
| ADRBK2 | 22 | 24.286 | 159 | + | 5 | 0.0 | 0 |
| ANKK1 | 11 | 112.764 | 12.6 | + | 23 | 1.8 | 0 |
| ARRB2 | 17 | 4.561 | 11.0 | + | 3 | 0.3 | 0 |
| BDNF | 11 | 27.700 | 66.8 | − | 10 | 0.1 | 0 |
| CCK | 3 | 42.281 | 6.9 | − | 13 | 1.9 | 0 |
| CHRNA1 | 2 | 175.455 | 16.6 | − | 3 | 0.2 | 0 |
| CHRNA10 | 11 | 3.649 | 5.8 | − | 3 | 0.5 | 0 |
| CHRNA2 | 8 | 27.393 | 18.5 | − | 17 | 0.9 | 0 |
| CHRNA3 | 15 | 76.700 | 25.7 | − | 18 | 0.7 | 5 |
| CHRNA4 | 20 | 61.463 | 16.7 | − | 8 | 0.5 | 0 |
| CHRNA5 | 15 | 76.645 | 28.6 | + | 18 | 0.6 | 6 |
| CHRNA6 | 8 | 42.743 | 15.8 | − | 4 | 0.3 | 1 |
| CHRNA7 | 15 | 30.11 | 138.5 | + | 13 | 0.1 | 0 |
| CHRNA9 | 4 | 40.178 | 19.5 | + | 11 | 0.6 | 0 |
| CHRNB1 | 17 | 7.289 | 12.5 | + | 10 | 0.8 | 0 |
| CHRNB2 | 1 | 151.353 | 8.8 | + | 4 | 0.5 | 0 |
| CHRNB3 | 8 | 42.672 | 39.6 | + | 6 | 0.2 | 5 |
| CHRNB4 | 15 | 76.721 | 17.0 | − | 14 | 0.8 | 5 |
| CHRND | 2 | 233.216 | 9.3 | + | 3 | 0.3 | 2 |
| CHRNE | 17 | 4.747 | 5.3 | − | 3 | 0.6 | 0 |
| CHRNG | 2 | 233.23 | 6.0 | + | 6 | 1.0 | 4 |
| CNR1 | 6 | 88.912 | 5.5 | − | 9 | 1.6 | 0 |
| COMT | 22 | 18.304 | 27.2 | + | 13 | 0.5 | 0 |
| CYP2A6 | 19 | 46.048 | 6.9 | − | 3 | 0.4 | 0 |
| CYP2B6 | 19 | 46.189 | 27.1 | + | 14 | 0.5 | 2 |
| DBH | 9 | 133.531 | 23.0 | + | 10 | 0.4 | 2 |
| DDC | 7 | 50.386 | 85.7 | − | 30 | 0.4 | 0 |
| DRD1 | 5 | 174.804 | 3.1 | − | 4 | 1.3 | 0 |
| DRD2 | 11 | 112.851 | 65.6 | − | 29 | 0.4 | 2 |
| DRD3 | 3 | 115.38 | 50.2 | − | 8 | 0.2 | 0 |
| DRD5 | 4 | 9.460 | 2.0 | + | 4 | 2.0 | 0 |
| FAAH | 1 | 46.572 | 19.5 | + | 5 | 0.3 | 0 |
| FMO1 | 1 | 167.949 | 37.5 | + | 14 | 0.4 | 4 |
| FMO3 | 1 | 167.792 | 26.9 | + | 23 | 0.9 | 0 |
| GABRB2 | 5 | 160.908 | 254.3 | − | 14 | 0.1 | 0 |
| GPR51 | 9 | 98.551 | 421.1 | − | 29 | 0.1 | 0 |
| HTR1A | 5 | 63.293 | 1.3 | − | 5 | 3.9 | 0 |
| HTR2A | 13 | 46.368 | 62.7 | − | 20 | 0.3 | 0 |
| HTR5A | 7 | 154.3 | 13.6 | + | 13 | 1.0 | 3 |
| MAOA | 23 | 43.272 | 90.7 | + | 5 | 0.1 | 0 |
| MAOB | 23 | 43.498 | 115.8 | − | 10 | 0.1 | 0 |
| NPY | 7 | 24.097 | 7.7 | + | 22 | 2.9 | 0 |
| OPRD1 | 1 | 28.959 | 51.6 | + | 1 | 0.0 | 0 |
| OPRK1 | 8 | 54.327 | 22.2 | − | 12 | 0.5 | 0 |
| OPRM1 | 6 | 154.453 | 80.1 | + | 12 | 0.1 | 1 |
| PDYN | 20 | 1.923 | 15.3 | − | 11 | 0.7 | 1 |
| PENK | 8 | 57.521 | 5.1 | − | 6 | 1.2 | 0 |
| POMC | 2 | 25.303 | 7.7 | − | 2 | 0.3 | 0 |
| SLC6A3 | 5 | 1.499 | 52.6 | − | 5 | 0.1 | 0 |
| SLC6A4 | 17 | 25.587 | 37.8 | − | 8 | 0.2 | 0 |
| TH | 11 | 2.150 | 7.9 | − | 6 | 0.8 | 0 |
| TPH1 | 11 | 18.019 | 19.8 | − | 14 | 0.7 | 0 |
| Category B | |||||||
| AVPR1A | 12 | 61.833 | 6.4 | − | 15 | 2.4 | 1 |
| CLTCL1 | 22 | 17.654 | 112.2 | − | 15 | 0.1 | 1 |
| DAO | 12 | 107.776 | 20.8 | + | 7 | 0.3 | 1 |
| FMO4 | 1 | 168.015 | 27.7 | + | 12 | 0.4 | 4 |
| GABRA4 | 4 | 46.837 | 74.7 | − | 29 | 0.4 | 2 |
| GRM2 | 3 | 51.718 | 9.1 | + | 2 | 0.2 | 1 |
| KCNJ6 | 21 | 38.211 | 291.9 | − | 18 | 0.1 | 1 |
| PIP5K2A | 10 | 23.043 | 177.7 | − | 15 | 0.1 | 1 |
The column ‘SNPs tested’ refers to the number of SNPs tested for association and the column ‘SNPS in top signals’ refers to the SNPs that appear in Table 2. Some SNPs represent multiple genes, particularly when two genes are near each other; hence there is overlap between genes for the SNPs represented by these two columns. Genes with SNPs in our top signals are shown in boldface.
Figure 1.
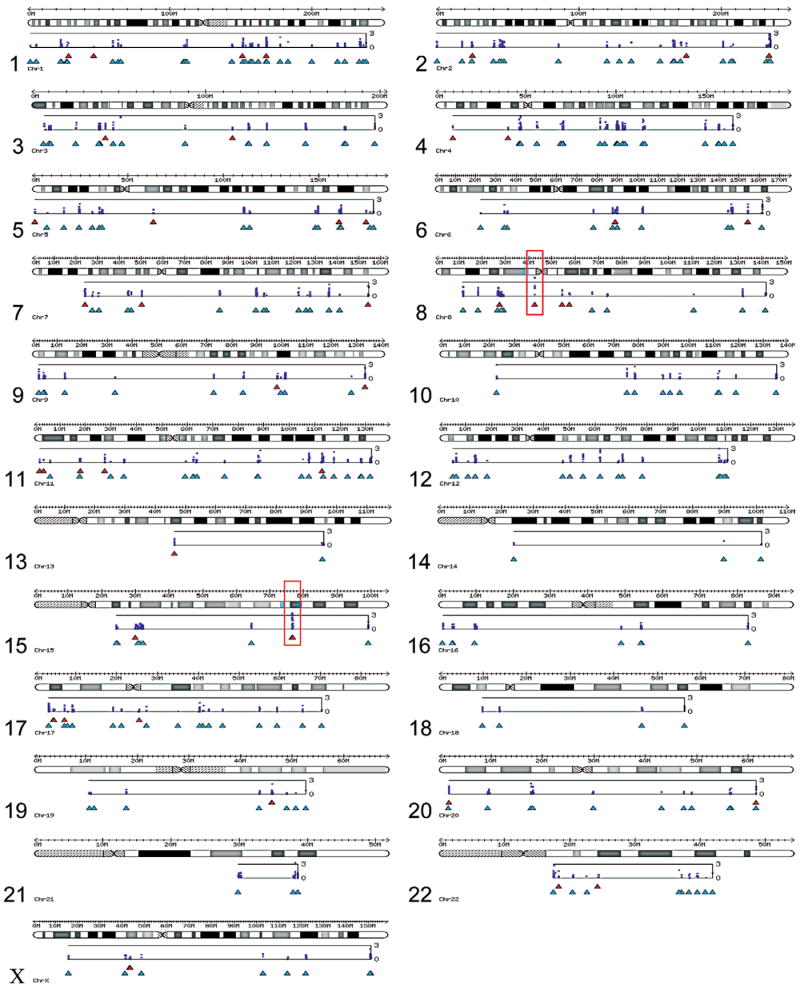
Results of the candidate gene association analysis. The P-values from the primary analysis are plotted for each chromosome below an ideogram using the −log10(P) transformation. The bottom axis is P = 1 and the top axis is P = 10−3. Category A genes are shown below the plots in red and category B genes are shown in cyan below the category A genes. Regions on chromosomes 8 and 15, which are shown in more detail in Figure 2, are highlighted in red.
Figure 2.

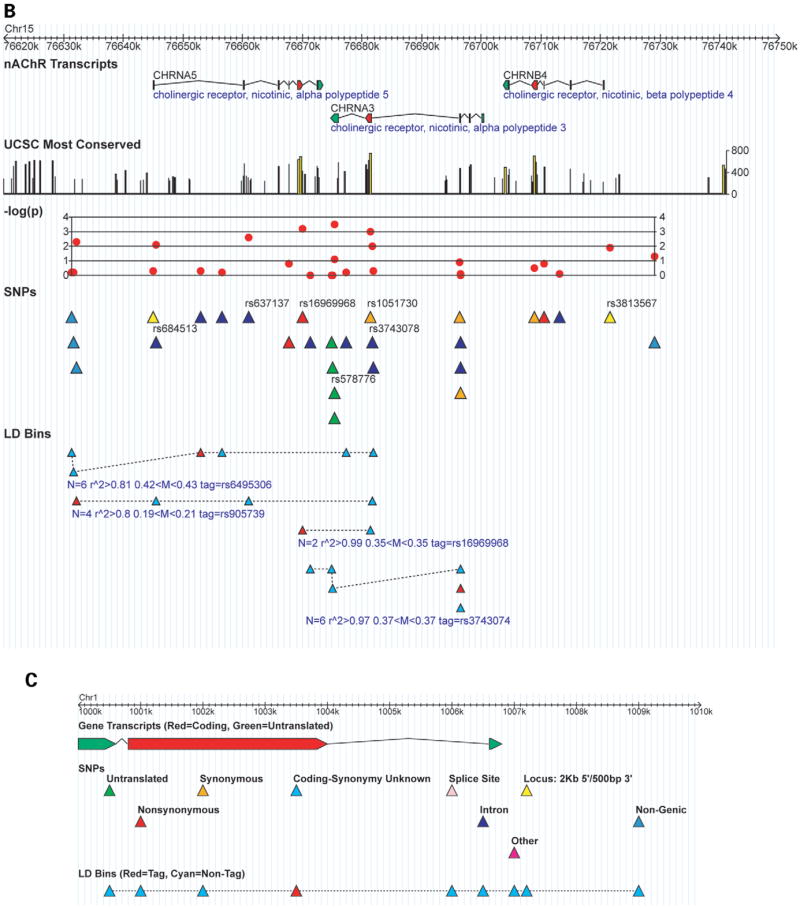
Detailed results for the top association signals. (A) The top two signals are near the CHRNB3 nicotinic receptor gene on chromosome 8. (B) The Non-synonymous SNP rs16969968 and the CHRNA5-CHRNA3-CHRNB4 cluster of nicotinic receptor genes on chromosome 15. SNPs that appear in Table 2 are labeled with dbSNP rs IDs. The track ‘UCSC Most Conserved’ (http://genome.ucsc.edu, May 2004 build, table ‘phastConsElements17way’) highlights regions conserved between human and other species including the mouse, rat and chicken; the maximum conservation score is 1000. Primary P-values are plotted in red using the –log(P) transformation. The ‘LD Bins’ track displays the distribution of SNPs from the ‘SNPs’ track into LD bins where all SNPs have r2 ≥ 0.8 in both cases and controls with the tag SNP. Only bins with more than two SNPs are shown, and bins are annotated with number of SNPs N, the minimum r2 of the tag with the other SNPs in the bin, the range of allele frequencies in the bin and the tag SNP. (C) A legend indicating the color scheme.
Figure 3.
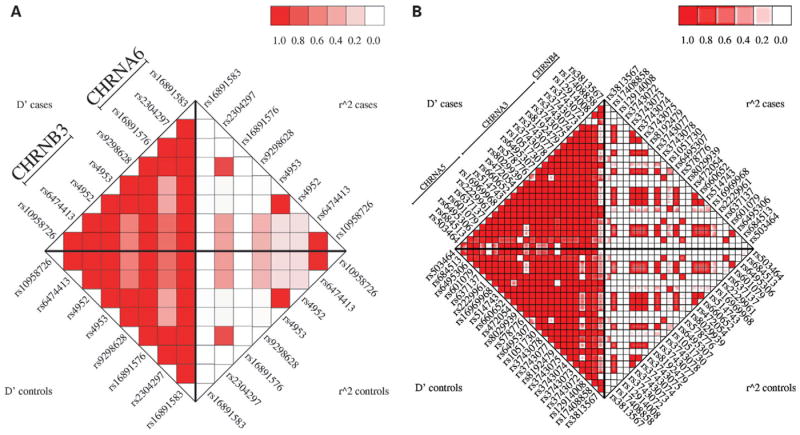
LD between markers in (A) the CHRNB3-CHRNA6 and (B) CHRNA5-CHRNA3-CHRNB4 clusters of nicotinic receptor genes.
Table 4.
SNPs exhibiting significant deviation from a multiplicative genetic model
| SNP | Gene | Non-multiplicative P-value | One risk allele odds ratio | Two risk alleles odds ratio |
|---|---|---|---|---|
| rs16969968 | CHRNA5 | 4.04E-02 | 1.1 (0.9–1.4) | 1.9 (1.4–2.6) |
| AG/GG | AA/GG | |||
| rs3025382 | DBH | 2.24E-02 | 0.6 (0.3–1.3) | 0.9 (0.4–2.0) |
| AG/AA | GG/AA | |||
| rs510769 | OPRM1 | 4.16E-04 | 1.5 (1.3–1.9) | 1.0 (0.7–1.4) |
| CT/CC | TT/CC |
The SNP with the smallest primary P-value was selected from each LD bin in Table 6. The multiplicative P-value is from the one degree of freedom test for the significance of the heterozygote term H in Eq. (3). We only show SNPs with P < 0.05. The last two columns show the odds ratios and 95% confidence intervals for the relative risk between genotypes. The SNP rs16969968 clearly follows a recessive pattern where individuals carrying two copies of the A allele are nearly twice as likely to have symptoms of nicotine dependence compared with those with zero or one copy.
Table 5.
Gender-specific odds ratios and 95% confidence intervals for SNPs in Table 2
| SNP | Gene | Primary P-value | Rank | Gender * genotype P-value | Male odds ratio | Female odds ratio |
|---|---|---|---|---|---|---|
| rs10508649 | PIP5K2A | 1.02E-03 | 8 | 1.09E-02 | 9.7 (2.1–44.2) | 1.0 (0.3–3.1) |
| rs17041074 | DAO | 1.12E-03 | 9 | 3.70E-04 | 0.8 (0.6–1.0) | 1.3 (1.1–1.6) |
| rs3762607 | GABRA4 | 1.22E-03 | 10 | 3.43E-02 | 2.2 (1.4–3.3) | 1.2 (0.9–1.6) |
| rs6772197 | DOCK3 (GRM2) | 1.66E-03 | 12 | 6.35E-04 | 1.6 (1.2–2.2) | 0.9 (0.7–1.1) |
| rs3021529 | AVPR1A | 1.73E-03 | 13 | 8.96E-04 | 0.8 (0.5–1.0) | 1.5 (1.1–1.9) |
| rs6320 | HTR5A | 6.50E-03 | 39 | 1.61E-03 | 0.7 (0.6–1.0) | 1.2 (1.0–1.5) |
| rs4802100 | CYP2A7P1 | 6.76E-03 | 41 | 2.82E-02 | 0.9 (0.6–1.4) | 1.6 (1.2–2.1) |
| rs4245150 | DRD2 | 1.08E-02 | 61 | 2.79E-03 | 0.8 (0.6–1.0) | 1.2 (1.0–1.4) |
| rs1657273 | HTR5A | 1.11E-02 | 64 | 3.06E-03 | 0.8 (0.6–1.0) | 1.2 (1.0–1.5) |
| rs6045733 | PDYN | 1.55E-02 | 84 | 4.25E-03 | 1.3 (1.1–1.7) | 0.9 (0.7–1.0) |
Only SNPs where the gender by genotype interaction was significant (P < 0.05) are shown, and the SNP with the most significant primary P-value was selected from each LD bin. The odds ratios are based on the coefficient of the genotype term G in Eq. (2) and represent the increase in risk for every unit increase in G; i.e. the risk follows a log-linear model (Tables 8 and 9).
The β3 nicotinic receptor subunit gene CHRNB3, located on chromosome 8, accounted for the two strongest signals from our analysis: rs6474413 and rs10958726 (Fig. 2A). These two SNPs effectively contributed to a single signal because they were in very high LD with an r2 correlation ≥ 0.99. They are in the putative 5′ promoter region: the SNP rs6474413 is within 2 kb of the first 5′ promoter and the SNP rs10958726 is an additional 15 kb upstream. Two other SNPs in CHRNB3, rs4953 and rs4952, were also among the top signals. These are synonymous SNPs in exon 5 and are the only known coding SNPs for CHRNB3 (dbSNP build 125, http://www.ncbi.nlm.nih.gov/snp). Again, these represent a single signal as their genotypes were completely correlated.
The next group of SNPs among our top signals is in the CHRNA5–CHRNA3–CHRNB4 cluster of nicotinic receptor genes on chromosome 15 (Fig. 2B). The third most significant signal was the SNP rs578776 in the 3′-untranslated region (UTR) of CHRNA3, the α3 nicotinic receptor subunit gene (Fig. 2B). Approximately 5 kb downstream from CHRNA3 is our fifth strongest signal rs16969968, a non-synonymous coding SNP in exon 5 of CHRNA5, the α5 nicotinic receptor subunit gene. This SNP was in very strong LD with rs1051730, a synonymous coding SNP in CHRNA3, with an r2 correlation ≥0.99.
The most interesting signal appears to be the non-synonymous SNP rs16969968 in CHRNA5. As discussed earlier, it is completely correlated with an SNP in the CHRNA3 gene (Fig. 2B). Allele A of rs16969968 has a frequency of 38% in cases and 32% in controls. There is convincing evidence for a recessive mode of inheritance for this SNP (Table 4). Compared to having no copies, the odds ratios for having one copy and two copies of the A allele were 1.1 (95% CI 0.9–1.4) and 1.9 (95% CI 1.4–2.6), respectively. That is, compared with individuals with other genotypes, individuals with the AA genotype were nearly twice as likely to have symptoms of nicotine dependence.
DISCUSSION
Nicotine addiction from tobacco smoking is responsible for over three million deaths annually, making it the leading cause of preventable mortality in the world (1). In the USA in 2003, 21.6% of adults were smokers, where 24% of men and 19% of women were smokers (26). Previous association studies have been limited to narrowly focussed candidate gene studies. Our candidate gene study was more extensive, genotyping 3713 SNPs for 348 candidates in 1050 nicotine-dependent cases and 879 non-dependent smokers, where our control group definition was particularly strict.
Our top FDR-controlled findings were dominated by nicotinic receptor genes. Our positive association findings for the α5 and β3 nicotinic receptor subunits are novel. To date, most human genetic and biological studies of the nicotinic receptors and nicotine dependence have focussed on the α4 and β2 subunits because they co-occur in high-affinity receptors and are widely expressed in the brain (27). However, mouse studies have demonstrated that of the α4β2 containing receptors that mediate dopamine release, a substantial proportion contain α5 as well (28). This is consistent with our evidence for an important role of α5 in nicotine dependence susceptibility. Furthermore, in a brain α4β2 receptor, an α5 or β3 subunit can take the fifth position in the pentamer, corresponding to β1 of muscle. Although neither α5 nor β3 is thought to participate in forming binding sites, they are able to affect channel properties and influence agonist potency because they participate in the conformational changes associated with activation and desensitization (27).
The most compelling biological evidence of a risk factor for nicotine dependence is from the non-synonymous SNP rs16969968 in CHRNA5. This SNP causes a change in amino acid 398 from asparagine (encoded by the G allele) to aspartic acid (encoded by A, the risk allele), which results in a change in the charge of the amino acid in the second intracellular loop of the α5 subunit (29). The risk allele appeared to act in a recessive mode, in which individuals who were homozygous for the A allele are at a 2-fold risk to develop nicotine dependence. Although the α5 subunit has not been studied extensively and there are no reports of known functional effects of this polymorphism, it is striking that a non-synonymous charge-altering polymorphism in the corresponding intracellular loop of the α4 nAChR subunit has been shown to alter nAChR function in mice in response to nicotine exposure (30-33). This variant is common in the populations of European descent (allele frequency of A allele ~42%), but uncommon in populations of Asian or African descent (<5%, data from International HapMap project, http://www.hapmap.org).
Also among the top 39 FDR-controlled signals were the genes KCNJ6 (also known as GIRK2) and GABRA4. These were the only other genes besides nicotinic receptors with SNPs that had P-values less than 0.001. KCNJ6 belongs to the inwardly rectifying potassium channel (GIRK) family of genes. GIRK provides a common link between numerous neurotransmitter receptors and the regulation of synaptic transmission (34). GABA is the major inhibitory neurotransmitter in the mammalian central nervous system and is critical for the reinforcing effects of nicotine (3,5). We found significant evidence that the risk due to genotype is much stronger in men than in women (Table 5), where the male odds ratio was 2.2 (95% CI 1.4–3.3).
Previously reported findings in other nicotinic receptors were not among our most significant findings. In prior studies of CHRNA4, nominal association with nicotine dependence measures was reported for the SNPs rs2236196 and rs3787137 in African-American families and rs2273504 and rs1044396 in European-Americans, but only rs2236196 in African-Americans remained after multiple testing correction (9). Also in CHRNA4, rs1044396 and rs1044397 were associated with both Fagerström test for nicotine dependence (FTND) score and qualitative nicotine dependence in a family-based sample of Asian male smokers (8). In our sample of European descent, we tested 11 SNPs for CHRNA4 including the above-mentioned SNPs except rs2273504, which did not pass our stringent quality control standards. The lowest primary P-value across all 11 SNPs was 0.026 for rs2236196 (study-wide rank = 132); this particular result may be considered a single test given the specific prior finding for this SNP, thus providing modest evidence for replication. The remaining four previously reported SNPs that we analyzed showed P-values greater than 0.8. Contrasts in these results are possibly due in part to the different ethnicities of the respective samples.
A recent study of smoking initiation and severity of nicotine dependence in Israeli women (10) analyzed 39 SNPs in 11 nicotinic receptor subunit genes. Their single SNP analyses also did not detect association with SNPs in α4, including rs2236196, rs1044396 and rs1044397, although finding nominal significance in the α7, α9, β2 and β3 subunits. Their study did not include the same SNPs in the β3 subunit and α5–α3–β4 cluster comprising our four strongest associations in nicotinic receptor genes; they did analyze our fifth ranking nicotinic receptor SNP, rs1051730, and found a suggestive P-value of 0.08 when comparing ‘high’ nicotine-dependent subjects with ‘low’ nicotine-dependent subjects in a much smaller sample than ours.
Our study was unable to corroborate reported association findings of Beuten et al. (18) for the β2 subunit of the GABAB receptor GABBR2 (also known as GABABR2, GABAB2 and GPR51). We genotyped 32 SNPs in GABBR2 including five SNPs reported by Beuten et al. (18), three of which were the most significant in European-Americans by at least one test in that study. The primary P-value in our study was greater than 0.07 for all 32 SNPs and greater than 0.3 for the five previously reported SNPs.
Similarly, we do not find evidence for nominal association in our primary test of the 31 SNPs we genotyped for the DDC gene, which includes an SNP previously reported significant in European-Americans (35). And of the 11 SNPs covering the gene BDNF, three (rs6265, rs2030324 and rs7934165) were previously reported as associated in European-American males (21); these three were not significant in our sample (primary P = 0.86, 0.088 and 0.12, respectively), and the lowest primary P-value among the remaining eight SNPs was 0.02, which does not survive correction for the six LD bins covering the gene. Note that our primary test uses a log-additive model, whereas previous reports sometimes found their strongest results under other models (e.g. recessive and dominant); however, for these previously reported associations, our tests for departure from the log-additive model did not find evidence for improvement under alternative modes of inheritance.
Our primary association analysis was a two-degree-of-freedom test of the significance of adding genotype and genotype by gender interaction terms to the base predictors sex and site. This approach helps to ensure that we detect associations that are significantly influenced by gender. The disadvantage is that the extra degree of freedom makes associations with insignificant gender interaction appears to be less significant overall.
Because our controls were highly selected and could even be considered ‘protected’ against susceptibility to nicotine dependence, interpretation of our results must consider the possibility that an association signal from our study may actually represent protective rather than risk effects. We used the allele more frequent in cases for reporting these data as a convention to facilitate comparison of the odds ratios among SNPs; this should not be viewed as a conclusion of how a particular variant influences the risk for nicotine dependence. The precise determination of the mechanism by which a variant alters risk can only come from functional studies.
We performed additional tests for association using only the individuals from the US sample to determine whether our primary conclusions still hold in this subset of 797 cases and 813 controls (the Australian sample alone is too small to test for association, with only 253 cases and 66 controls). We used the same logistic regression method as for the entire sample except for the omission of the term ‘site’. The Spearman rank-order correlation of the P-values between the two tests for association was 0.87. Supplementary Material, Table S2 shows the results of the US-only analysis for the 39 SNPs from our list of top associations (Table 2), with the original ordering and FDR filtering, side by side with results from the US sample. Supplementary Material, Table S3 describes the result of completely starting over and using only the US sample to order by P-value, filter by FDR <40% and compute LD bins. In this case, 30 of 39 (77%) SNPs in our original set of top signals (Table 2) appeared in the list of top signals in the US-only analysis (Supplementary Material, Table S3), which includes the genes CHRNA5 and CHRNB3, the top genes from our initial analysis. Hence, although there were some changes in the order of the results, the primary conclusion of association with the nicotinic receptors CHRNB3 and CHRNA5 remains valid when the analysis is performed on the US subsample.
As a companion to the candidate gene study, a GWAS was carried out in parallel (23). Approximately 2.4 million SNPs were genotyped across the human genome in a two-stage design that began with pooled genotyping in a portion of the sample and followed with individual genotyping of the entire sample for the top 40 000 signals. The 21st strongest signal from the GWAS was due to an SNP 3 kb upstream of the first 5′ promoter of CHRNB3, the gene with the strongest signal from our candidate gene study. This signal came from the SNP rs13277254 (genotyped only for the GWAS and not for our candidate gene study) and had a P-value of 6.52 × 10⁻⁵. This convergence from two different study designs provides further support that the signals in this gene are not random effects.
In conclusion, we have identified several genetic variants as being associated with nicotine dependence in candidate genes, the majority of which are nicotinic receptor genes. One of the SNPs implicated has a number of biologically relevant consequences, making it a particularly plausible candidate for influencing smoking behavior. These variants should be considered potential sources of genetic risk. Additional research is required to establish replication and possibly its role in the pharmacogenetics of response to nicotine dosing as well as to treatments for nicotine dependence.
MATERIALS AND METHODS
Subjects
All subjects (Table 6) were selected from two ongoing studies. The Collaborative Genetic Study of Nicotine Dependence (US) recruited subjects from three urban areas in the USA and the Nicotine Addiction Genetics (Australian) study collected subjects of European ancestry from Australia. Both studies used community-based recruitment and equivalent assessments were performed. Subjects who were identified as being smokers, using the criteria that they had smoked 100 or more cigarettes in their lifetimes, were queried in more detail using the FTND questionnaire. The US samples were enrolled at sites in St Louis, Detroit and Minneapolis, where a telephone screening of community-based subjects was used to determine whether subjects met criteria for case (current FTND ≥4) or control status. The study participants for the Australian sample were enrolled at the Queensland Institute of Medical Research in Australia, where families were identified from two cohorts of the Australian twin panel, which included spouses of the older of these two cohorts, for a total of approximately 12 500 families with information about smoking. The ancestry of the Australian samples is predominantly Anglo-Celtic and Northern European. The Institutional Review Boards approved both studies and all subjects provided informed consent to participate. Blood samples were collected from each subject for DNA analysis and submitted, together with electronic phenotypic and genetic data for both studies, to the National Institute on Drug Abuse (NIDA) Center for Genetic Studies, which manages the sharing of research data according to the guidelines of the National Institutes of Health.
Table 6.
A summary of covariates and FTND scores in our sample: by definition, all control subjects scored 0 on the FTND (34)
| Cases | Controls | ||||
|---|---|---|---|---|---|
| USA | Australia | USA | Australia | ||
| Males | N | 351 | 114 | 251 | 17 |
| Age | |||||
| range | 25–44 | 30–82 | 25–44 | 34–82 | |
| μ ± σa | 36.8 ± 5.3 | 39.4 ± 9.8 | 35.3 ± 5.5 | 55.1 ± 15.4 | |
| FTND | |||||
| range | 4–10 | 4–10 | – | – | |
| μ ± σ | 6.4 ± 1.7 | 6.1 ± 1.6 | – | – | |
| Females | N | 446 | 139 | 562 | 49 |
| Age | |||||
| range | 25–45 | 27–79 | 25–44 | 27–78 | |
| μ ± σ | 37.1 ± 5.2 | 40.4 ± 10.3 | 35.9 ± 5.5 | 46.4 ± 14.0 | |
| FTND | |||||
| range | 4–10 | 4–10 | – | – | |
| μ ± σ | 6.4 ± 1.8 | 6.0 ± 1.6 | – | – | |
| Combined | N | 797 | 253 | 813 | 66 |
| Total | 1050 | 879 |
Mean ± SD.
Case subjects were required to score 4 or more on the FTND (36) during the heaviest period of cigarette smoking (the largest possible score is 10). This is a common criterion for defining nicotine dependence. Control subjects must have smoked 100 or more cigarettes in their lifetimes, yet never exhibited symptoms of nicotine dependence: they were smokers who scored 0 on the FTND during the heaviest period of smoking. By selecting controls that had a significant history of smoking, the genetic effects that are specific to nicotine dependence can be examined. Additional data from the Australian twin panel support this designation of a control status (23). In the US study, using the sample of 15 086 subjects who were determined to be smokers (smoked 100 or more cigarettes in their lifetimes) during the screening process, the prevalence of ‘nicotine dependence’ (FTND ≥ 4) was 46.4% and the prevalence of ‘smoking without nicotine dependence’ (FTND = 0) was 20.1%.
Candidate gene selection
The criteria for the selection of the candidate genes were based on known biology, correlations between nicotine dependence and other phenotypes and previous reports on the genetics of nicotine dependence and related traits. Genes were nominated by an expert committee of investigators from the NIDA Genetics Consortium (http://zork.wustl.edu/nida), with expertise in the study of nicotine and other substance dependence. These included classic genes that respond to nicotine, such as the nicotinic receptors, and other genes involved in the addictive process.
In total, 448 genes were considered for SNP genotyping. The genes were divided into two categories: A and B. Category A genes, which included the nicotinic and dopaminergic receptors, were considered to have a higher prior probability of association and were guaranteed to be targeted for genotyping. As our study design allowed for individual genotyping of approximately 4000 SNPs, the category B genes were too numerous to receive adequate SNP coverage once the A genes had been sufficiently covered. We therefore prioritized the category B genes using the results of the pooled genotyping from the companion GWAS study (23). Genes exhibiting the most evidence for association with nicotine dependence were prioritized for coverage. Some genes are larger than others and, therefore, may receive more SNPs. These genes may therefore appear more significant because of the increased number of tests performed. Hence, we corrected for multiple testing as follows. For a given candidate gene on the B list, if Pmin is the minimum P-value found in the pooled genotyping of stage I of the GWAS for all the SNPs genotyped in the gene and N is the number of SNPs tested, then we computed the corrected minimum P-value Pcorr using the formula
| (1) |
As roughly 50% of the SNPs in any chromosomal region are in high LD (37), we used (N + 1)/2 as the exponent. The category B genes were then ranked by these corrected minimum P-values and SNPs were selected from the top of the ranked list until our resources were exhausted.
SNP selection
We chose all SNPs within exons, regardless of the allele frequency, and all SNPs within ±2 kb of annotated gene promoters where the European-American minor allele frequency was at least 4%. We then chose tag SNPs for all European-American LD bins (38) crossing the exons of the candidate genes, with two SNPs for each bin with three or more SNPs. SNPs meeting these criteria were chosen first from those selected for individual genotyping in the companion pooled study (23) and then to cover the physical regions as uniformly as possible if there was choice available for the other SNPs. In addition, we included specific SNPs that have been reported in the literature as being associated with nicotine dependence (8,9,18,34).
Pooled genotyping
See the companion paper by Bierut et al. (23) for a description of the pooled genotyping.
Individual genotyping
For individual genotyping, we designed custom high-density oligonucleotide arrays to interrogate SNPs selected from candidate genes, as well as quality control SNPs. Each SNP was interrogated by 24 25mer oligonucleotide probes synthesized on a glass substrate. The 24 features comprise four sets of six features interrogating the neighborhoods of SNP reference and alternate alleles on forward and reference strands. Each allele and strand is represented by five offsets: −2, −1, 0, 1 and 2, indicating the position of the SNP within the 25mer, with 0 being at the 13th base. At offset 0, a quartet was tiled, which includes the perfect match to reference and alternate SNP alleles and the two remaining nucleotides as mismatch probes. When possible, the mismatch features were selected as purine nucleotide substitution for a purine perfect match nucleotide and as a pyrimidine nucleotide substitution for a pyrimidine perfect match nucleotide. Thus, each strand and allele tiling consisted of six features comprising five perfect match probes and one mismatch.
Individual genotype cleaning
Individual genotypes were cleaned using a supervised prediction algorithm for the genotyping quality, compiled from 15 input metrics that describe the quality of the SNP and the genotype. The genotyping quality metric correlates with a probability of having a discordant call between the Perlegen platform and outside genotyping platforms (i.e. non-Perlegen HapMap project genotypes). A system of 10 bootstrap aggregated regression trees was trained using an independent data set of concordance data between Perlegen genotypes and HapMap project genotypes. The trained predictor was then used to predict the genotyping quality for each of the genotypes in this data set (see Supplementary Material for more information regarding cleaning).
Population stratification analysis
In order to avoid false positives due to population stratification, we performed an analysis using the STRUCTURE software (39). This program identifies subpopulations of individuals who are genetically similar through a Markov chain Monte Carlo sampling procedure using markers selected across the genome. Genotype data for 289 high performance SNPs were analyzed across all 1929 samples. This analysis revealed no evidence for population admixture.
Genetic association analysis
An ANOVA analysis testing the predictive power of various phenotypes indicated that gender and site (USA or Australia) were the most informative and that age and other demographic variables did not account for significant additional trait variance (Table 7). Our primary method of analysis was based on a logistic regression: if P is the probability of being a case, then our linear logistic model has the form
Table 7.
ANOVA analysis of covariates
| Model | ANOVA evaluated covariate | χ2 (1 df) | P-value |
|---|---|---|---|
| Gender | Gender | 40.0 | 4.2 × 10⁻¹⁰ |
| Gender + age | Age | 10.3 | 1.3 × 10−03 |
| Gnder + site | Site | 100.4 | 1.2 × 10⁻²³ |
| Gnder + site + age | Age | 0.25 | 0.62 |
| Gnder + site + gender*site | Gender*site | 0.84 | 0.36 |
Logistic regression, modeling the probability of being a case, was performed for the indicated covariates. The χ2 statistic is from the formula −2(Δ log L), where Δ log L is the change in likelihood in the logistic regression. The variable site has two levels: USA and Australia.
| (2) |
where α is the intercept, g the gender coded 0 or 1 for males or females, respectively, and s the site coded as 0 or 1 for USA or Australia, respectively. The variable G represents genotype and is coded as the number of copies of the risk allele, defined as the allele more common in cases than in controls. It follows from Eq. (2) that the risk due to genotype is being modeled using a log-linear (i.e. multiplicative) scale rather than an additive scale. Maximum likelihood estimates for the coefficients and confidence intervals for odds ratios were computed using the SAS software package (40).
The predictors of our base model were gender and site. We then tested whether the addition of genotype and gender by genotype interaction to the base model significantly increased the predictive power and used the resulting two-degree-of-freedom χ2 statistic to rank the SNPs by the corresponding P-values. Table 8 shows the formulas for the odds ratios in terms of the coefficients.
Table 8.
Coding of the gender term g and the genotype term G used in the primary logistic regression model
| Genotype | g | G | Odds ratio |
|---|---|---|---|
| AA | 0 | 0 | – |
| aA | 0 | 1 | eβ3 |
| aa | 0 | 2 | e2β3 |
| AA | 1 | 0 | – |
| aA | 1 | 1 | eβ3 eβ4 |
| aa | 1 | 2 | e2β3 e2β4 |
The allele a is the risk allele, the allele more common in cases than in controls. The variable G is defined as the number of copies of the risk allele, and g is 0 or 1 for male or female, respectively. The last column shows the expression for the gender-specific odds ratio for a given genotype compared with the AA genotype, which follows directly from the logistic regression model in Eq. (2).
Following these primary analyses, we further analyzed the top ranked SNPs for significant evidence of dominant or recessive mode of inheritance. This was done using a logistic regression of the form
| (3) |
where H is 1 for heterozygotes and 0 otherwise. When H is significant, the interpretation is that the genetic effect deviates significantly from the log-linear model. We then compute odds ratios for dominant and recessive models, as described in Table 9.
Table 9.
Codings used for the secondary logistic regression model
| Genotype | G | H | Odds ratio |
|---|---|---|---|
| AA | 0 | 0 | – |
| aA | 1 | 1 | eβ3 eβ4 |
| aa | 2 | 0 | e2β3 |
The odds ratios follow directly from Eq. (3). Note that for a dominant model, the two odds ratios are equal, and for a recessive model, the odds ratio for aA is 1.
Linkage disequilibrium
We estimated r2 correlation separately in cases and controls for all pairs of SNPs within 1 Mb windows using an EM algorithm as implemented in the computer program Haploview (version 3.2, http://www.broad.mit.edu/mpg/haploview) (41). Our final measure of LD is the minimum r2 from the two samples. Following the algorithm in Hinds et al. (38) and Carlson et al. (42), SNPs were grouped into bins, where every bin contains at least one ‘tag SNP’ satisfying min(r2) ≥ 0.8 with every SNP in the bin. The group of association signals from such an LD bin can be viewed essentially as a single signal.
Correcting for multiple testing
To account for multiple testing, we estimated the FDR (24,25) to control the proportion of false positives among our reported signals. As category A genes were considered to have a higher prior probability of association, we followed the recommendations of Roeder et al. (43) and weighted category A gene SNPs a moderate 10-fold more heavily. Therefore, the category B genes must have stronger association signals for inclusion in our list of FDR-filtered top signals. For each P-value, we computed a weighted P-value Pw using the formula
where w was defined so that the average of the weights is 1 (this depends on the number of SNPs selected for A and B genes). For every weighted P-value Pw0, we computed a q-value qw0 that has the property that the FDR is no greater than qw0 among all SNPs with qw < qw0 (25,44). This was done using the computer program QVALUE (version 1.1, http://faculty.washington.edu/jstorey/qvalue) (45). Our estimates of the FDR are based on the q-values.
This method of estimating the FDR does not take into account LD. Therefore, as an additional measure to correct for multiple testing and to assess statistical significance, we estimated the FDR using permutations and P-values weighted for A and B genes, which preserves the LD structure. This was done by performing 1000 random permutations of the case–control status and testing the permuted data for association. The significance of a P-value from the original data was assessed by counting the number of times a more significant weighted P-value occurs in the random permutations, where the weights were the same as those used for the FDR estimates.
Acknowledgments
The authors wish to acknowledge the contributions of advisors to this project. The NIDA Genetics Consortium and two NCG committees were vital to the success of the research. The Candidate Gene Committee helped review and finalize the list of candidate genes to be genotyped with individual SNP genotyping. In addition to the authors, committee members included Andrew Bergen, Joseph Cubells, Ken Krauter, Mary Jeanne Kreek, Sharon Murphy, Huijin Ring, Ming Tsuang and Kirk Wilhelmsen. The Data Analysis Committee helped oversee analyses for the candidate gene and genome-wide association studies and investigated methodological issues in association analyses. Further, the committee assisted in data management and data sharing functions. In addition to the authors, committee members included Andrew Bergen, Gerald Dunn, Mary Jeanne Kreek, Huijun Ring, Lei Yu and Hongyu Zhao. At Perlegen Sciences, we would like to acknowledge the work of Laura Stuve, Curtis Kautzer, the genotyping laboratory, Laura Kamigaki, the sample group and John Blanchard, Geoff Nilsen and the bioinformatics and data quality groups for excellent technical and infrastructural support for this work performed under NIDA Contract HHSN271200477471C. Figures 1 and 2 were generated with the Generic Genome Browser (version 1.64, http://www.gmod.org) (46). In memory of Theodore Reich, founding Principal Investigator of COGEND, we are indebted to his leadership in the establishment and nurturing of COGEND and acknowledge with great admiration his seminal scientific contributions to the field. This work was supported by the NIH grants CA89392 from the National Cancer Institute, DA12854 and DA015129 from the National Institute on Drug Abuse and the contract N01DA-0-7079 from NIDA.
Footnotes
SUPPLEMENTARY MATERIAL Supplementary Material is available at HMG Online.
Data access: Phenotypes and genotypes are available through the NIDA Genetics consortium (http://nidagenetics.org) to the scientific community at time of publication.
Conflict of Interest statement. D.G.B. and K.K. are employed by Perlegen Sciences, Inc. With the exception of D.G.B. and K.K., none of the authors or their immediate families are currently involved with, or have been involved with, any companies, trade associations, unions, litigants or other groups with a direct financial interest in the subject matter or materials discussed in this manuscript in the past 5 years.
References
- 1.World Health Organization. World Health Statistics 2006. WHO Press; 2006. [accessed 14 December, 2006]. http://www.who.int/whosis/whostat2006/en/index.html. [Google Scholar]
- 2.Warren CW, Jones NR, Eriksen MP, Asma S. Global Tobacco Surveillance System (GTSS) collaborative group. Patterns of global tobacco use in young people and implications for future chronic disease burden in adults. Lancet. 2006;367:749–753. doi: 10.1016/S0140-6736(06)68192-0. [DOI] [PubMed] [Google Scholar]
- 3.Tapper AR, Nashmi R, Lester HA. Neuronal nicotinic acetylcholine receptors and nicotine dependence. In: Madras BK, Colvis CM, Pollock JD, Rutter JL, Shurtleff D, von Zastrow M, editors. Cell Biology of Addiction. Cold Spring Harbor Laboratory Press; Cold Spring Harbor, NY: 2006. [Google Scholar]
- 4.Laviolette SR, Van de Kooy D. The neurobiology of nicotine addiction: bridging the gap from molecules to behavior. Nat Rev Neurosci. 2004;5:55–65. doi: 10.1038/nrn1298. [DOI] [PubMed] [Google Scholar]
- 5.Corrigall WA, Coen KM, Adamson KL. Self-administered nicotine activates the mesolimbic dopamine system through the ventral tegmental area. Brain Res. 1994;653:278–284. doi: 10.1016/0006-8993(94)90401-4. [DOI] [PubMed] [Google Scholar]
- 6.World Health Organization. [accessed 19 June, 2006];The Tobacco Atlas. Types of Tobacco Use. 2006 http://www.who.int/tobacco/resources/publications/tobacco_atlas.
- 7.Lessov CN, Martin NG, Statham DJ, Todorov AA, Slutske WS, Bucholz KK, Heath AC, Madden PA. Defining nicotine dependence for genetic research: evidence from Australian twins. Psychol Med. 2004;34:865–879. doi: 10.1017/s0033291703001582. [DOI] [PubMed] [Google Scholar]
- 8.Feng Y, Niu T, Xing H, Xu X, Chen C, Peng S, Wang L, Laird N, Xu X. A common haplotype of the nicotine acetylcholine receptor alpha 4 subunit gene is associated with vulnerability to nicotine addiction in men. Am J Hum Genet. 2004;75:112–121. doi: 10.1086/422194. [DOI] [PMC free article] [PubMed] [Google Scholar]
- 9.Li MD, Beuten J, Ma JZ, Payne TJ, Lou XY, Garcia V, Duenes AS, Crews KM, Elston RC. Ethnic- and gender-specific association of the nicotinic acetylcholine receptor alpha4 subunit gene (CHRNA4) with nicotine dependence. Hum Mol Genet. 2005;14:1211–1219. doi: 10.1093/hmg/ddi132. [DOI] [PubMed] [Google Scholar]
- 10.Greenbaum L, Kanyas K, Karni O, Merbl Y, Olender T, Horowitz A, Yakir A, Lancet D, Ben-Asher E, Lerer B. Why do young women smoke? I. Direct and interactive effects of environment, psychological characteristics and nicotinic cholinergic receptor genes. Mol Psychiatr. 2006;11:312–322. doi: 10.1038/sj.mp.4001774. [DOI] [PubMed] [Google Scholar]
- 11.Boustead C, Taber H, Idle JR, Cholerton S. CYP2D6 genotype and smoking behaviour in cigarette smokers. Pharmacogenetics. 1997;7:411–414. doi: 10.1097/00008571-199710000-00012. [DOI] [PubMed] [Google Scholar]
- 12.Pianezza ML, Sellers EM, Tyndale RF. Nicotine metabolism defect reduces smoking. Nature. 1998;393:750. doi: 10.1038/31623. [DOI] [PubMed] [Google Scholar]
- 13.Cholerton S, Boustead C, Taber H, Arpanahi A, Idle JR. CYP2D6 genotypes in cigarette smokers and non-tobacco users. Pharmacogenetics. 1996;6:261–263. doi: 10.1097/00008571-199606000-00010. [DOI] [PubMed] [Google Scholar]
- 14.Comings DE, Ferry L, Bradshaw-Robinson S, Burchette R, Chiu C, Muhleman D. The dopamine D2 receptor (DRD2) gene: a genetic risk factor in smoking. Pharmacogenetics. 1996;6:73–79. doi: 10.1097/00008571-199602000-00006. [DOI] [PubMed] [Google Scholar]
- 15.Shields PG, Lerman C, Audrain J, Bowman ED, Main D, Boyd NR, Caporaso NE. Dopamine D4 receptors and the risk of cigarette smoking in African-Americans and Caucasians. Cancer Epidemiol Biomarkers Prev. 1998;7:453–458. [PubMed] [Google Scholar]
- 16.Lerman C, Caporaso NE, Audrain J, Main D, Bowman ED, Lockshin B, Boyd NR, Shields PG. Evidence suggesting the role of specific genetic factors in cigarette smoking. Health Psychol. 1999;18:14–20. doi: 10.1037//0278-6133.18.1.14. [DOI] [PubMed] [Google Scholar]
- 17.Spitz MR, Shi H, Yang F, Hudmon KS, Jiang H, Chamberlain RM, Amos CI, Wan Y, Cinciripini P, Hong WK, Wu X. Case–control study of the D2 dopamine receptor gene and smoking status in lung cancer patients. J Natl Cancer Inst. 1998;90:358–363. doi: 10.1093/jnci/90.5.358. [DOI] [PubMed] [Google Scholar]
- 18.Beuten J, Ma JZ, Payne TJ, Dupont RT, Crews KM, Somes G, Williams NJ, Elston RC, Li MD. Single- and multilocus allelic variants within the GABA(B) receptor subunit 2 (GABAB2) gene are significantly associated with nicotine dependence. Am J Hum Genet. 2005;76:859–864. doi: 10.1086/429839. [DOI] [PMC free article] [PubMed] [Google Scholar]
- 19.Hu S, Brody CL, Fisher C, Gunzerath L, Nelson ML, Sabol SZ, Sirota LA, Marcus SE, Greenberg BD, Murphy DL, Hamer DH. Interaction between the serotonin transporter gene and neuroticism in cigarette smoking behavior. Mol Psychiatry. 2000;5:181–188. doi: 10.1038/sj.mp.4000690. [DOI] [PubMed] [Google Scholar]
- 20.Lerman C, Caporaso NE, Audrain J, Main D, Boyd NR, Shields PG. Interacting effects of the serotonin transporter gene and neuroticism in smoking practices and nicotine dependence. Mol Psychiatry. 2000;5:189–192. doi: 10.1038/sj.mp.4000672. [DOI] [PubMed] [Google Scholar]
- 21.Beuten J, Ma JZ, Payne TJ, Dupont RT, Quezada P, Huang W, Crews KM, Li MD. Significant association of BDNF haplotypes in European-American male smokers but not in European-American female or African-American smokers. Am J Med Genet B Neuropsychiatr Genet. 2005;139B:73–80. doi: 10.1002/ajmg.b.30231. [DOI] [PubMed] [Google Scholar]
- 22.Li MD. The genetics of nicotine dependence. Curr Psychiatry Rep. 2006;8:158–164. doi: 10.1007/s11920-006-0016-0. [DOI] [PubMed] [Google Scholar]
- 23.Bierut LJ, Madden PAF, Breslau N, Johnson EO, Hatsukami D, Pomerleau OF, Swan GE, Rutter J, Bertelsen S, Fox L, et al. Novel genes identified in a high-density genome wide association study for nicotine dependence. Hum Mol Genet. 2006;16:24–35. doi: 10.1093/hmg/ddl441. [DOI] [PMC free article] [PubMed] [Google Scholar]
- 24.Hochberg Y, Benjamini Y. More powerful procedures for multiple significance testing. Stat Med. 1990;9:811–818. doi: 10.1002/sim.4780090710. [DOI] [PubMed] [Google Scholar]
- 25.Storey JD. A direct approach to false discovery rates. J R Stat Soc B. 2002;64:479–498. [Google Scholar]
- 26.CDC. Annual smoking-attributable mortality, years of potential life lost, and productivity losses-United States. Morb Mortal Wkly Rep. 2005;54:625–628. [PubMed] [Google Scholar]
- 27.Lindstrom JM. Nicotinic acetylcholine receptors of muscles and nerves: comparison of their structures, functional roles, and vulnerability to pathology. Ann N Y Acad Sci. 2003;998:41–52. doi: 10.1196/annals.1254.007. [DOI] [PubMed] [Google Scholar]
- 28.Salminen O, Murphy KL, McIntosh JM, Drago J, Marks MJ, Collins AC, Grady SR. Subunit composition and pharmacology of two classes of striatal presynaptic nicotinic acetylcholine receptors mediating dopamine release in mice. Mol Pharmacol. 2004;65:1526–1535. doi: 10.1124/mol.65.6.1526. [DOI] [PubMed] [Google Scholar]
- 29.Cserzo M, Wallin E, Simon I, von Heijne G, Elofsson A. Prediction of transmembrane alpha-helices in prokaryotic membrane proteins: the dense alignment surface method. Protein Eng. 1997;10:673–676. doi: 10.1093/protein/10.6.673. [DOI] [PubMed] [Google Scholar]
- 30.Stitzel JA, Dobelis P, Jimenez M, Collins AC. Long sleep and short sleep mice differ in nicotine-stimulated 86Rb+ efflux and alpha4 nicotinic receptor subunit cDNA sequence. Pharmacogenetics. 2001;4:331–339. doi: 10.1097/00008571-200106000-00008. [DOI] [PubMed] [Google Scholar]
- 31.Dobelis P, Marks MJ, Whiteaker P, Balogh SA, Collins AC, Stitzel JA. A polymorphism in the mouse neuronal alpha4 nicotinic receptor subunit results in an alteration in receptor function. Mol Pharmacol. 2002;62:334–342. doi: 10.1124/mol.62.2.334. [DOI] [PubMed] [Google Scholar]
- 32.Butt CM, Hutton SR, Stitzel JA, Balogh SA, Owens JC, Collins AC. A polymorphism in the alpha4 nicotinic receptor gene (Chrna4) modulates enhancement of nicotinic receptor function by ethanol. Alcohol Clin Exp Res. 2003;27:733–742. doi: 10.1097/01.ALC.0000067973.41153.BC. [DOI] [PubMed] [Google Scholar]
- 33.Butt CM, King NM, Hutton SR, Collins AC, Stitzel JA. Modulation of nicotine but not ethanol preference by the mouse Chrna4 A529T polymorphism. Behav Neurosci. 2005;119:26–37. doi: 10.1037/0735-7044.119.1.26. [DOI] [PubMed] [Google Scholar]
- 34.Lewohl JM, Wilson WR, Mayfield RD, Brozowski SJ, Morrisett RA, Harris RA. G-protein-coupled inwardly rectifying potassium channels are targets of alcohol action. Nat Neurosci. 1999;12:1084–1090. doi: 10.1038/16012. [DOI] [PubMed] [Google Scholar]
- 35.Ma JZ, Beuten J, Payne TJ, Dupont RT, Elston RC, Li MD. Haplotype analysis indicates an association between the DOPA decarboxylase (DDC) gene and nicotine dependence. Hum Mol Genet. 2005;14:1691–1698. doi: 10.1093/hmg/ddi177. [DOI] [PubMed] [Google Scholar]
- 36.Heatherton TF, Kozlowski LT, Frecker RC, Fagerström KO. The Fagerström test for nicotine dependence: a revision of the Fagerström tolerance questionnaire. Br J Addict. 1991;86:1119–1127. doi: 10.1111/j.1360-0443.1991.tb01879.x. [DOI] [PubMed] [Google Scholar]
- 37.Saccone SF, Rice JP, Saccone NL. Power-based, phase-informed selection of single nucleotide polymorphisms for disease association screens. Genet Epidemiol. 2006;30:459–470. doi: 10.1002/gepi.20159. [DOI] [PubMed] [Google Scholar]
- 38.Hinds DA, Stuve LL, Nilsen GB, Halperin E, Eskin E, Ballinger DG, Frazer KA, Cox DR. Whole-genome patterns of common DNA variation in three human populations. Science. 2005;18:1072–1079. doi: 10.1126/science.1105436. [DOI] [PubMed] [Google Scholar]
- 39.Pritchard JK, Stephens M, Donnelly PJ. Inference of population structure using multilocus genotype data. Genetics. 2000;155:945–959. doi: 10.1093/genetics/155.2.945. [DOI] [PMC free article] [PubMed] [Google Scholar]
- 40.SAS Institute Inc. SAS Release 9.1.3. Cary, NC: 2004. [Google Scholar]
- 41.Barrett JC, Fry B, Maller J, Daly MJ. Haploview: analysis and visualization of LD and haplotype maps. Bioinformatics. 2005;15:263–265. doi: 10.1093/bioinformatics/bth457. [DOI] [PubMed] [Google Scholar]
- 42.Carlson CS, Eberle MA, Rieder MJ, Yi Q, Kruglyak L, Nickerson DA. Selecting a maximally informative set of single-nucleotide polymorphisms for association analyses using linkage disequilibrium. Am J Hum Genet. 2004;74:106–120. doi: 10.1086/381000. [DOI] [PMC free article] [PubMed] [Google Scholar]
- 43.Roeder K, Bacanu S-A, Wasserman L, Devlin B. Using linkage genome scans to improve power of association genome scans. Am J Hum Genet. 2006;78:243–252. doi: 10.1086/500026. [DOI] [PMC free article] [PubMed] [Google Scholar]
- 44.Benjamini Y, Hochberg Y. Controlling the false discovery rate: a practical and powerful approach to multiple testing. J R Stat Soc B. 1995;57:289–300. [Google Scholar]
- 45.Storey JD, Tibshirani R. Statistical significance for genomewide studies. Proc Natl Acad Sci. 2003;100:9440–9445. doi: 10.1073/pnas.1530509100. [DOI] [PMC free article] [PubMed] [Google Scholar]
- 46.Stein LD, Mungall C, Shu S, Caudy M, Mangone M, Day A, Nickerson E, Stajich JE, Harris TW, Arva A, et al. The generic genome browser: a building block for a model organism system database. Genome Res. 2002;12:1599–1610. doi: 10.1101/gr.403602. [DOI] [PMC free article] [PubMed] [Google Scholar]