

Abstract
Onset (On) neurons in the cochlear nucleus (CN), characterized by their prominent response to the onset followed by little or no response to the steady-state of sustained stimuli, have a remarkable ability to entrain (firing 1 spike per cycle of a periodic stimulus) to low-frequency tones up to 1000 Hz. In this article, we present a point-neuron model with independent, excitatory auditory-nerve (AN) inputs that accounts for the ability of On neurons to both produce onset responses for high-frequency tone bursts and entrain to a wide range of low-frequency tones. With a fixed-duration spike-blocking state after a spike (an absolute refractory period), the model produces entrainment to a broad range of low-frequency tones and an On response with short interspike intervals (chopping) for high-frequency tone bursts. To produce On response patterns with no chopping, we introduce a novel, more complex, active membrane model in which the spike-blocking state is maintained until the instantaneous membrane voltage falls below a transition voltage. During the sustained depolarization for a high-frequency tone burst, the new model does not chop because it enters a spike-blocking state after the first spike and fails to leave this state until the membrane voltage returns toward rest at the end of the stimulus. The model entrains to low-frequency tones because the membrane voltage falls below the transition voltage on every cycle when the AN inputs are phase-locked. With the complex membrane model, On response patterns having moderate steady-state activity for high-frequency tone bursts (On-L) are distinguished from those having no steady-state activity (On-I) by requiring fewer AN inputs. Voltage-gated ion channels found in On-responding neurons of the CN may underlie the hypothesized dynamic spike-blocking state. These results provide a mechanistic rationale for distinguishing between the different physiological classes of CN On neurons.
Keywords: refractory period, state-dependent spike discharge, voltage-gated ion channels, cochlear nucleus
1. Introduction
Onset discharge patterns are characterized by a prominent response to the onset of stimuli followed by little or no response in the steady-state. Such patterns are recorded from all three major cell types in the ventral cochlear nucleus (VCN)—stellate, bushy, and octopus cells—that differ in morphology (Rhode et al., 1983; Rouiller and Ryugo, 1984), electrical properties (Oertel, 1983; Wu and Oertel, 1984; Manis and Marx, 1991), and synaptic organization (Brawer et al., 1974; Liberman, 1991, 1993). Correspondingly, there is considerable heterogeneity within the class of onset (On) neurons despite their main source of input—auditory-nerve (AN) fibers—being relatively homogeneous. On neurons in the ventral cochlear nucleus (VCN) are most commonly divided into three groups based on the shape of their peri-stimulus time (PST) histograms for high-frequency tone bursts—ideal onset (On-I), onset with late activity (On-L), and onset with chopping (On-C) (Godfrey et al., 1975; Rhode and Smith, 1986). All three types of On neurons are capable of entraining to low-frequency tones up to 1000 Hz (Rhode and Smith, 1986), a capability lacking in AN fibers (Kiang et al., 1965; Johnson, 1980). In Kalluri and Delgutte (2003), we showed that a simple leaky-integrator model with a constant refractory period can produce On-C PST histograms and entrainment. However, this model could not explain the ability of On-I and On-L neurons to produce a spike on every cycle of a low-frequency tone while spiking only at the onset of high-frequency tone bursts.
In order to generate On PST histograms lacking chopping for high-frequency tone bursts (i.e., On-L and On-I PST histograms), a model must prevent short interspike intervals. However, if the model has to entrain over a broad frequency range, then it must allow short interspike intervals for low-frequency pure tones. These opposing constraints are not satisfied by an integrate-to-threshold model having a fixed refractory period because interspike intervals are either short or long for both high-frequency tone bursts and low-frequency tones but not different for the two stimuli.
In this article, we modify the characteristics of the leaky-integrator model from Kalluri and Delgutte (2003) such that the release from the spike-blocking (or refractory) state depends sharply on the amplitude of the synaptic input via the intervening membrane voltage.1 As a result, the duration of the spike-blocking state depends on the stimulus waveform (hence dynamic spike-blocking model), enabling interspike intervals to be short or long depending on whether the stimulus is a low-frequency tone or a high-frequency tone burst. The implementation of a spike-blocking state in our model resembles depolarization block, first proposed by Romand (1978) to account for On discharge patterns. To our knowledge, our model is the first to have implemented such a mechanism mathematically and examined its consequences quantitatively. It should be noted that our model is abstract, with no direct correspondence to biophysical processes. We have chosen such a model to show that a process resembling a dynamic spike-blocking state, regardless of its biophysical basis, can account for both entrainment and On-I/On-L PST histograms, while keeping the number of parameters manageable.
We focus on understanding how the characteristics of the dynamic spike-blocking state and the number and strength of independent AN inputs affect responses of the model. We show that the model can produce both entrainment to low-frequency tones and On-I/On-L PST histograms for high-frequency tone bursts. A preliminary report of this work has been presented (Kalluri and Delgutte, 2000).
2. Methods
2.1. Model for On Neurons
Apart from the modifications to the spike generator that result in a dynamic spike-blocking state, the model for On neurons is the same as described in detail in Kalluri and Delgutte (2003). Briefly, the model is a cascade of two stages, where the first stage simulates the response of AN fibers to sound and the second stage is an integrate-to-threshold model for a CN neuron. We first summarize the model of AN fibers and the leaky-integrator model and then describe in detail the modifications to the leaky-integrator model that lead to the dynamic spike-blocking model.
Discharge patterns on AN fibers were simulated with a computational model including cochlear bandpass filtering, fall of phase-locking with increasing frequency, adaptation of firing rate, and stochastic spike discharges (Carney, 1993).
The leaky integrate-to-threshold model has the components summarized below and schematized in Fig. 1. The operation of the model is determined by an intracellular voltage and a threshold. The voltage change due to the flow of synaptic current across the neural membrane is represented by a parallel resistor-capacitor electrical network with a time constant, τm, equal to R ·C. A spike discharge results when this membrane voltage exceeds a threshold, θ.
Figure 1.
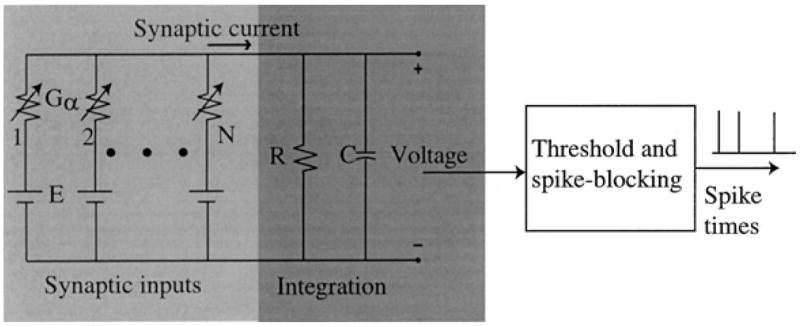
An integrate-to-threshold point-neuron model.
For a fixed refractory period, Tr, following a spike, the neuron cannot discharge because the threshold is infinite and the membrane voltage is zero. At the end of the 0.7 ms refractory period, the threshold is reset to its resting value, θ0.
All N synapses in the model are excitatory and driven by spikes from an equal number of independent model AN fibers (one fiber per synapse), all of which have 50 spikes/sec spontaneous discharge rates. An input spike causes a transient increment in synaptic conductance with a duration of approximately 0.5 ms. The magnitude of the conductance change, Gs, is the same for all synapses and is normalized by the unitary synaptic strength, G0 = 0.189 mS, which is the threshold amplitude of a synaptic conductance change that gives rise to a single output spike. This normalized synaptic strength is expressed as .
The model neuron has between 40 and 800 independent AN inputs, with characteristic frequencies (CFs) spanning a 1 octave range around 6000 Hz, as in Kalluri and Delgutte (2003).
2.1.1. The Dynamic Spike-Blocking Model
The synaptic inputs and the passive membrane models are identical for the leaky-integrator model and the dynamic spike-blocking model. Only the spike generator differs for the two models.
The dynamic spike-blocking model is summarized by the state-transition diagram in Fig. 2A and its key events are depicted in Fig. 2B. Model parameters are listed in Table 1. The model has two states, an integration state and a spike-blocking state. In the integration state, the model is a leaky integrator. It has a membrane voltage, υ(t), determined by low-pass filtering the synaptic current, and a threshold, θ. When υ(t) exceeds the fixed resting threshold θ0, a spike occurs and the model enters the spike-blocking state. As in the leaky-integrator model, the spike-blocking state includes an absolute refractory period during which no spikes are possible, indicated by an infinite threshold. Whereas υ(t) is clamped to its resting value during the absolute refractory period in the leaky-integrator model, it continues to assume the dynamics determined by the synaptic current in the dynamic spike-blocking model. At the end of the absolute refractory period, the leaky-integrator model resumes its integration of synaptic current. In contrast, the dynamic spike-blocking model only re-enters the integration state when the membrane voltage falls below a transition voltage, Vt .
Figure 2.

A: State transition diagram for the model with a dynamic spike-blocking state. Transition out of the spike-blocking state occurs when the membrane voltage, υ(t) falls below the transition voltage, Vt . Transition into the spike-blocking state occurs when υ(t) exceeds the threshold, θ0 (i.e., a spike occurs). B: (Top) Example traces of synaptic current, membrane voltage, spiking threshold, and spike times in the dynamic spike-blocking model for one presentation of a high-frequency (6000 Hz) tone burst, 50 dB above threshold. Vt = 0.4 is indicated with a dashed line. The spike-blocking state is extended indefinitely beyond the absolute refractory period until the membrane voltage repolarizes below Vt . (Bottom) A peri-stimulus time (PST) histogram, with binwidth of 0.2 milliseconds, for 250 presentations of the stimulus. C: The same for the constant-refractoriness model. For both models, the number of inputs, N, is 400 and the net synaptic strength, N · Gα, is 10.
Table 1.
Parameters of the dynamic spike-blocking model.
| Synaptic and input parameters | ||
| N | Number of AN inputs | 40–800 |
| N · Gα | Net synaptic excitation | 10, 8.75 |
| CF range of AN inputs | 1 octave | |
| τs | Time constant of synaptic conductance change | 0.1 milliseconds (ms) |
| E/θ0 | Synaptic reversal potential (normalized) | 8.57 |
| Spike generator parameters | ||
| τm = R · C | Membrane time constant | 0.125 ms |
| θ0 | Resting threshold | 1 |
| Vt | State transition voltage | 0–1 |
| Tr | Absolute refractory period | 0.7 ms |
The leaky-integrator model of Kalluri and Delgutte (2003) is called the constant-refractoriness model in the remainder of this article to emphasize how its refractory properties distinguish it from the dynamic spike-blocking model.
2.2. Characterization of Model Responses
The model responses were quantified using PST histograms and entrainment indices defined in Kalluri and Delgutte (2003). Our definition of an entrainment index (EI) is the number of interspike intervals smaller than 1.5 stimulus periods divided by the number of stimulus cycles. When the response perfectly entrains to the stimulus (i.e., fires 1 spike per cycle), EI is equal to 1. EI exceeds unity when the response hyper-entrains (more than 1 spike per cycle), while it is less than 1 if a spike does not occur on every cycle.
We classify responses to high-frequency tone bursts as either On or Sustained based on the criteria of Winter and Palmer (1995) given in our companion article (Kalluri and Delgutte, 2003). On responses are further divided into On-I, On-L, and On-C types based on PST histograms of responses at 50 dB above threshold. On-C responses have PST histograms with two or more clearly defined onset peaks. On PST histograms with no chopping and steady-state rate less than 10 spikes/second are On-I; otherwise, they are classified as On-L.
Finally, discharge rate versus level functions were determined by simulating responses to 20 presentations of CF tone bursts for stimulus levels between 0 dB SPL and 90 dB SPL in 2 dB steps. For some parameters, the model produced non-monotonic rate-level functions. We quantified the nonmonotonicity with a nonmono-tonicity index NI = 1 – Rh/Rmax, where Rmax is the maximum discharge rate over all levels and Rh is the minimum rate above the level of Rmax (Irvine and Gago, 1990).
3. Results
We first determine the parameters that are necessary for the dynamic spike-blocking model to produce realistic On-I PST histograms and entrainment. Then, we show that the model can also produce On-L discharge patterns for a different parameter range.
3.1. The Dynamic Spike-Blocking Model Gives Both Entrainment and On-I PST Histograms
Figure 2B and C shows the net synaptic current, the membrane voltage, the spiking threshold, and spike times for a high-frequency (6000 Hz) tone burst 50 dB above threshold for both the dynamic spike-blocking model and the constant-refractoriness model. Both models have the same number of inputs (N = 400) and net synaptic strength (N · Gα = 10), chosen such that entrainment extends up to 800 Hz. The net synaptic current in the two models for a single stimulus presentation is the same except for statistical variations. The current rises transiently to a maximum at the onset of the stimulus and then rapidly falls to a steady-state level. The fall to a lower steady-state level is due to adaptation of the discharge rate in the AN inputs. Fluctuations in the synaptic current are small because the random firings of AN fibers are averaged out by the summation of a large number of independent inputs.
Despite having the same synaptic input, spiking patterns for the two models are completely different. In Fig. 2C, the membrane voltage for the constant-refractoriness model reaches threshold several times during the stimulus, causing the model to produce several spikes. The resulting PST histogram shows chopping as well as too much steady-state activity for an On neuron. In contrast, the dynamic spike-blocking model produces an On-I discharge pattern, with only one spike at onset (Fig. 2B). After the membrane voltage reaches threshold and produces the first spike, the model enters the spike-blocking state indicated by elevation of the threshold to ∞. The spike-blocking state lasts until the membrane voltage repolarizes below the transition voltage Vt, an event that only happens at the end of the stimulus. As a result, the model produces only one spike at the stimulus onset and the PST histogram has an On-I shape. Thus, for the same synaptic current, the dynamic spike-blocking model produces an On-I PST histogram while the constant-refractoriness model produces a Sustained PST histogram with chopping.
Despite having completely different responses to high-frequency tone bursts, the responses of the two models to a low-frequency tone are similar. Figure 3A and B shows responses of the two models to a 700 Hz tone at 90 dB SPL. The net synaptic currents, which again are nearly identical, have oscillations at the frequency of the 700 Hz tone. These periodic oscillations occur because the discharges of AN fibers phase-lock to the low-frequency tone. The lower panel of B shows that the membrane voltage in the constant-refractoriness model reaches threshold and produces one spike for every stimulus cycle and hence entrains to the 700 Hz tone (EI = 1). The response of the dynamic spike-blocking model also entrains to the 700 Hz tone with an EI of 1. This is possible because, in contrast to the response to the high-frequency tone burst (Fig. 2B), the membrane voltage falls below Vt on each cycle, allowing exit from the spike-blocking state, and firing on the next cycle.
Figure 3.

Responses of the constant-refractoriness model and the dynamic spike-blocking model to 90 dB SPL low-frequency tones. A: A 20 millisecond segment of the response of the dynamic spike-blocking model to a 700 Hz tone, with Vt = 0.4. B: The same in the constant-refractoriness model. Both A and B are in the same format as Fig. 2B and C. C: The entrainment index (EI) as a function of frequency in the two models. N = 400 and N · Gα = 10.
Figure 3C summarizes the entrainment in the two models for low-frequency tones presented at 90 dB SPL. In both models, the upper frequency limit of entrainment extends to 800 Hz. For frequencies below 300 Hz, the dynamic spike-blocking model continues to entrain while the constant-refractoriness model hyper-entrains (more than one spike per stimulus cycle). At these low frequencies, the membrane voltage in the constant-refractoriness model reaches spiking threshold more than once during each stimulus cycle. In contrast, the membrane voltage in the dynamic spike-blocking model reaches spiking threshold only once during each cycle, because the model enters the spike-blocking state after the first spike in a cycle and does not exit this state until the membrane voltage falls below Vt at the end of the cycle.
In summary, the dynamic spike-blocking model produces both entrainment to a broad range of frequencies and On-I PST histograms for high-frequency tone bursts, while the constant-refractoriness model fails to produce any of these responses for comparable inputs. When N and Gα are chosen such that the model entrains to tones up to 800 Hz, the constant-refractoriness model produces PST histograms with chopping, too much steady-state activity for On-I neurons, and hyper-entrainment at very low frequencies. The short interspike intervals that are necessary to produce entrainment to 800 Hz also occur during high-frequency tone bursts (chopping) and very low-frequency tones (hyper-entrainment). We showed in Kalluri and Delgutte (2003) that if Gα is reduced so that there are no short interspike intervals (chopping) for high-frequency tone bursts, then the constant-refractoriness model fails to produce the short interspike intervals needed for entrainment. In contrast, the dynamic spike-blocking model produces both entrainment to low-frequency tones and On-I PST histograms by preventing the “extra” spikes that lead to chopping and hyper-entrainment in the constant-refractoriness model. In the remainder of this paper, we focus on the dynamic spike-blocking model.
3.2. Model for On-I Discharge Patterns
3.2.1. Effect of the Transition Voltage
The transition voltage, Vt, determines when a transition occurs from the spike-blocking state to the integration state. Vt is critical for the discharge patterns produced by the model and it is sharply constrained by the PST histogram shape and the frequency range for entrainment.
Figure 4 shows how PST histograms produced by the model are affected by Vt, which has dimensionless units because it is normalized by the threshold; all other parameters are as in Figs. 2 and 3. In PST histograms for a 6000 Hz tone burst at 50 dB above threshold, the steady-state rate increases while the onset rate is relatively unchanged as Vt increases from 0.1 to 0.4, 0.6, and 0.9 (Fig. 4A). The PST histograms are On-I for Vt equal to 0.1 and 0.4, while they are On-L for Vt equal to 0.6 and 0.9. While the PST histogram for Vt = 0.9 appears to be Sustained, at lower levels the steady-state discharge rate is low and PST histograms meet our quantitative criteria for On-L responses (not shown). The steady-state rate for tone bursts presented at 50 dB increases steadily from 0 to 450 spikes/sec as Vt goes from 0.1 to 1 (Fig. 4B), exceeding the range for On-I neurons when Vt exceeds 0.5. When Vt is small (<0.5), the steady-state rate is low because the membrane voltage rarely falls below Vt after a spike, causing the model to stay in the spike-blocking state throughout the stimulus. On the other hand, when Vt is high (>0.5) the steady-state discharge rate is high because fluctuations in the membrane voltage frequently fall below Vt, causing the model to reenter the integration state and fire again.
Figure 4.

PST histograms in the dynamic spike-blocking model as a function of the transition voltage, Vt . A: PST histograms of model responses to 6000 Hz tone bursts at 50 dB above threshold for Vt equal to 0.1, 0.4, 0.6, and 0.9. B: Steady-state discharge rate versus Vt for stimuli presented at 50 dB above threshold. The shaded area indicates the range for On-I neurons. Based on the classification criteria of Winter and Palmer (1995), the response types for this range of Vt were all either On-I or On-L. N = 400, N · Gα = 10.
The transition voltage also affects the frequency range of entrainment produced by the model. Figure 5A shows the synaptic current, membrane voltage, and threshold in the dynamic spike-blocking model with Vt = 0.4 for a 600 Hz tone and a 1000 Hz tone. The model fires on every cycle of the 600 Hz tone but fails to do so for the 1000 Hz tone. For the 1000 Hz tone, the troughs of the nearly periodic membrane voltage tend to be shallow and remain above Vt, so that the model fails to reenter the integration state on each stimulus cycle. The troughs are shallow for the 1000 Hz tone because their widths approach the duration of the synaptic conductance change (0.5 ms). In general, the troughs become progressively shallower with increasing frequency so that entrainment declines rapidly above a certain limit. For Vt = 0.4, this limit is 800 Hz (Fig. 5B). Lowering Vt to 0.1 results in the upper frequency limit of entrainment falling to 500 Hz, while raising Vt to 0.6 results in the upper frequency limit of entrainment increasing slightly to 900 Hz. Further increasing Vt to 0.9 does not greatly change the upper frequency limit of entrainment, but results in hyper-entrainment at very low frequencies. For such values of Vt, the model behaves increasingly like the constant-refractoriness model because it almost always reenters the integration state shortly after each spike.
Figure 5.

Entrainment in the dynamic spike-blocking model as a function of the transition voltage, Vt . A: Example traces of synaptic current, threshold, and membrane voltage for a 600 Hz tone and a 1000 Hz tone, with Vt = 0.4. B: EI versus frequency for Vt equal to 0.1, 0.4, 0.6, and .9. C: EI versus Vt for a 100 Hz tone and an 800 Hz tone. N = 400, N · Gα = 10.
Entrainment by the model is summarized in Fig. 5C, which shows EI as a function of Vt for 100 Hz and 800 Hz tones. The model entrains to 800 Hz tones if Vt > 0.3. On the other hand, it hyper-entrains to a 100 Hz tone if Vt ≥ 0.8. Thus, choosing Vt between 0.3 and 0.7 allows the model to entrain to tones from 100 Hz to 800 Hz.
Taken together, Figs. 4 and 5 show that Vt must be greater than 0.3 and less than 0.6 for the model to produce both On-I PST histograms and entrainment over a broad range of frequencies.
3.2.2. Effect of the Number of Inputs
While to this point the number of inputs to the model has been held at 400, we now examine the effect of this parameter. It turns out that the model cannot simulate On-I discharge patterns if it has many fewer inputs. Figure 6A shows PST histograms for 6000 Hz tone bursts at 20 dB above threshold for N equal to 40, 150, 250, and 350, with N · Gα still equal to 10. The transition voltage, Vt, was fixed to 0.4 based on the results of Figs. 4 and 5. The PST histogram type is On for N equal to 250 and 350, but Sustained when N is lowered to 150 and 40. Furthermore, the steady-state discharge rate for 50 dB above threshold is below 10 spikes/sec—the range for On-I neurons—only if the model has at least 200 inputs (Fig. 6B).
Figure 6.
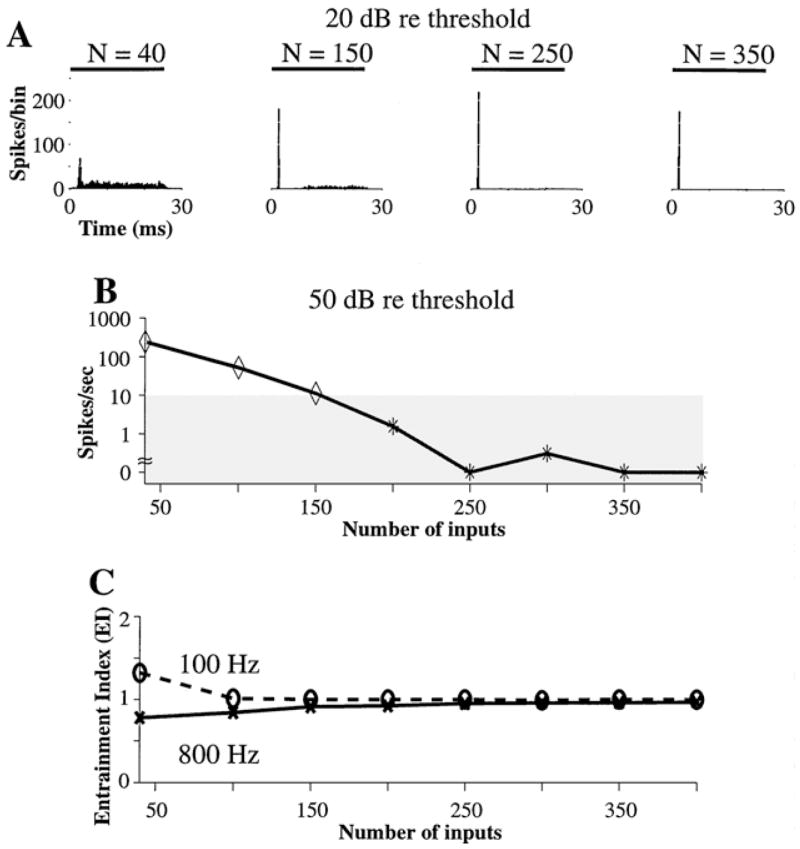
The effect of the number of inputs on PST histograms in the dynamic spike-blocking model. A: PST histograms of responses to 6000 Hz tone bursts presented at 20 dB above threshold for N equal to 40, 150, 250, and 350. The PST histograms for N equal to 40 and 150 are Sustained while those for N equal to 250 and 350 are On. B: Steady-state discharge rate versus N for tone bursts presented at 50 dB above threshold. The shaded area is the range for On-I neurons. Vt = 0.4, N · Gα = 10. (Note: abscissa in B starts at N = 40).
The effect of N on PST histogram shape can be understood in terms of the size of membrane voltage fluctuations. In Kalluri and Delgutte (2003), we showed that with the net synaptic strength (N · Gα) fixed, fluctuations of synaptic current and the resulting fluctuations of membrane voltage increase as N decreases in the constant-refractoriness model. The same relationship holds in the dynamic spike-blocking model because the integration state is identical for the two models. When voltage fluctuations are large, the membrane voltage often falls below Vt so that there are frequent transitions from the spike-blocking state to the integration state. The high rate of transitions into the integration state results in a relatively high steady-state discharge rate and precludes On-I PST histograms. Thus, to produce On-I PST histograms, the dynamic spike-blocking model must have the small fluctuations of membrane voltage that result from large N .
The steady-state discharge rates in Fig. 6A and B can be reduced by lowering Vt, so that the model can produce On-I PST histograms even when N is less than 200. However, Fig. 5 shows that lowering Vt below 0.4 also reduces the upper frequency limit of entrainment. This constraint on Vt applies for a wide range of N because entrainment does not change greatly with N (not shown). Thus, taken together, the requirement of entraining to tones up to 800 Hz and producing On-I PST histograms for tone bursts at 50 dB above threshold constrain the number of inputs in the dynamic spike-blocking model to be at least 200 and Vt to be between 0.3 and 0.6.
3.2.3. Effect of Stimulus Level
The constraint on N in the model can be further refined by requiring PST histograms to be On-I over a wide range of levels. The change in the PST histogram shape with level is indirectly summarized by plots of average discharge rate and steady-state discharge rate versus level in Fig. 7A. For N = 400, the steady-state discharge rate is always 0 spikes/stimulus, indicating On-I PST histograms at all levels. On the other hand, for N = 250 and N = 150, the steady-state discharge rate is nonzero for intermediate levels (due to underlying On-L PST histograms), leading to nonmonotonic average rate versus level curves. Such nonmonotonic rate-level curves for CF tone bursts have not been observed in On-I neurons (Rhode and Smith, 1986; Winter and Palmer, 1995). Furthermore, for N = 150, the steady-state discharge rate at intermediate levels exceeds the 0.25 spikes/stimulus (10 spikes/sec) limit for On-I responses and therefore PST histograms are On-L. Thus, the problem with having a small N is that steady-state discharge rate is non-zero at intermediate levels, leading to On-L PST histograms over some range and to non-monotonic rate-level curves.
Figure 7.
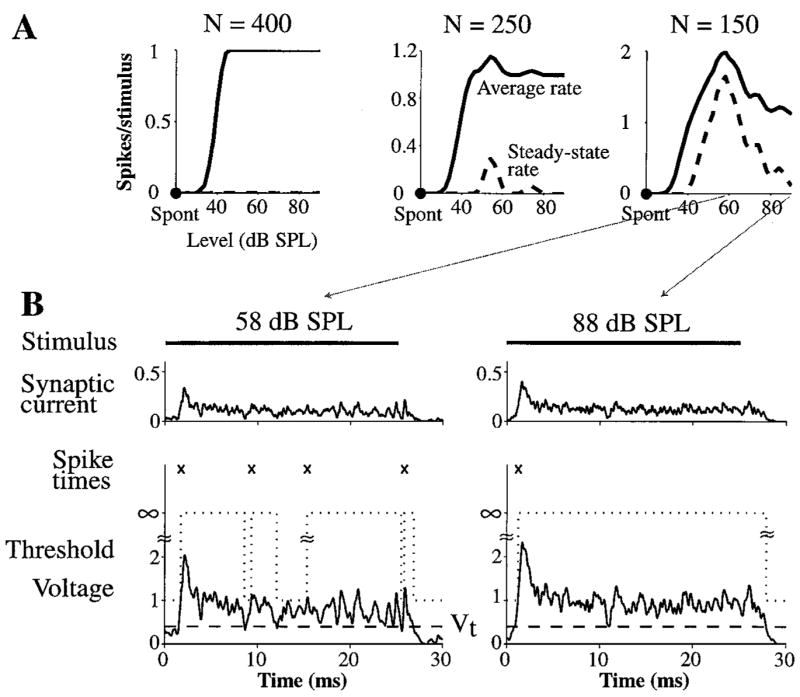
The effect of the number of inputs on responses at different levels. A: The average discharge rate (solid, computed over entire 25 ms duration of stimulus) and steady-state discharge rate (dashed, computed over last 12 ms of stimulus) as a function of the level of 6000 Hz tone bursts for N equal to 150, 250, and 400. B: Example traces of synaptic current, threshold, and membrane voltage for tone bursts presented at 58 dB SPL and 88 dB SPL when N = 150. Vt = 0.4, N · Gα = 10.
The finding of nonmonotonic rate-level curves in a model having no synaptic inhibition can be understood by examining the synaptic current, membrane voltage, threshold, and Vt for tone bursts presented at two levels when N is 150 (Fig. 7B). The steady-state rate is maximum at an intermediate level of 58 dB SPL because the fluctuating membrane voltage frequently falls below Vt . On the other hand, at a relatively high level of 88 dB SPL, the mean voltage is sufficiently high that its fluc-tuations rarely fall below Vt . If N is greater (e.g., N = 400), the fluctuations are small enough that the membrane voltage rarely falls below Vt at any level, so that steady-state discharge rate remains essentially zero.
The nonmonotonicity of the average rate versus level function indirectly reflects the ability of the model to produce On-I PST histograms across a wide range of levels.2 For any given N, there is a maximum transition voltage, , for which the fluctuating membrane t voltage is above Vt at all suprathreshold levels, enabling the model to produce On-I PST histograms and monotonic rate-level curves. This maximum exceeds 0.3, the minimum for getting entrainment up to 800 Hz, only if N ≥ 300.
Thus, when the nonmonotonicity of rate-level curves is taken into account along with entrainment, our simulations show that the dynamic spike-blocking model must have at least 300 inputs to produce On-I PST histograms over a wide range of levels and entrainment over a broad range of frequencies. In summary, the model must have the following properties to produce On-I discharge patterns:
– N ≥ 300
– Vt between 0.3 and the lower of and 0.6
3.3. Model for On-L Discharge Patterns
It would appear from Figs. 4 and 5B that one way to model On-L discharge patterns is to raise Vt near 0.6. With higher Vt, the model makes a sufficient number of transitions out of the spike-blocking state for high-frequency tone bursts to produce a steady-state discharge rate in the range for On-L neurons while also entraining to a broad range of tones without hyper-entraining to very low-frequency tones. However, for this range of Vt, the model also produces nonmonotonic rate-level curves, which are not observed in On-L neurons (Rhode and Smith, 1986; Winter and Palmer, 1995).
When N · Gα = 10, it turns out that the model cannot produce On-L PST histograms, monotonic rate-level curves, and entrainment because there is no N for which the range of Vt resulting in On-L PST histograms matches the range of Vt resulting in monotonic rate-level curves and entrainment. Thus, changing N alone is insufficient for producing On-L discharge patterns.
Lowering N · Gα helps produce On-L discharge patterns because the range of Vt producing hyper-entrainment shrinks, thus enabling a choice of N and Vt for which the model produces all three response properties. The range of Vt for hyper-entrainment shrinks because the input is not sufficiently strong at low frequencies to cause multiple spikes in a stimulus period. However, N · Gα cannot be lowered too much because the frequency range of entrainment would be too small (see Fig. 13 in Kalluri and Delgutte, 2003).
With N · Gα lowered from 10 to 8.8, the model can produce On-L discharge patterns for many combinations of Vt and N . For example, with 400 inputs and Vt = 0.7, the dynamic spike-blocking model does produce On-L discharge patterns (Fig. 8). Based on the shape of the PST histogram at 20 dB above threshold (A), the PST type is On. Further, the PST histogram at 50 dB above threshold is On-L (B) and the rate-level curve (C) is nearly monotonic. Compared to when N · Gα = 10, the mean membrane voltage is lower and as a result, the range of Vt for which rate-level curves are non-monotonic moves to lower voltages. Furthermore, the voltage is low enough to avoid hyper-entrainment to very low-frequency tones. However, as a result of the lower mean membrane voltage, the frequency range of entrainment (D) decreases a little compared to that for the model of On-I neurons in Fig. 3. Entrainment by the On-L model is lower than entrainment by the On-I model at both the lower (100 Hz) and the upper (800 to 900 Hz) end of the frequency range.
Figure 8.
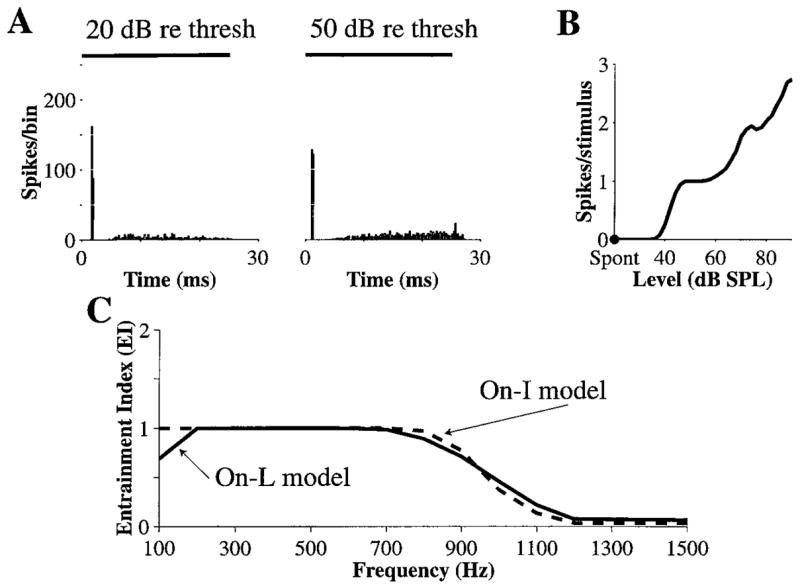
On-L discharge patterns produced by the dynamic spike-blocking model, with N · Gα = 8.8. A: PST histograms for 6000 Hz tone bursts presented at 20 dB and 50 dB above threshold. B: Average discharge rate versus level of 6000 Hz tone bursts. C: EI versus frequency for the On-L model (solid). The curve for the On-I model (dashed) from Fig. 3C is also shown for comparison. N = 400.
Figure 9 summarizes the discharge patterns produced by the dynamic spike-blocking model for different combinations of N and Vt, with N · Gα fixed to 8.8. The PST histogram type (On-L, On-I, or Sustained) is coded by different symbols in A. The model produces On-L PST histograms when Vt is greater than 0.5 and N is greater than 200. On the other hand, it produces On-I PST histograms when Vt < 0.5 and Sustained PST histograms when N is small (<200). We have already noted these effects of N and Vt on the shape of PST histograms. The shaded area in the figure indicates the region for non-monotonic rate-level curves and shows that the model produces both On-L PST histograms and monotonic rate-level curves only for Vt > 0.6 and N > 200.
Figure 9.
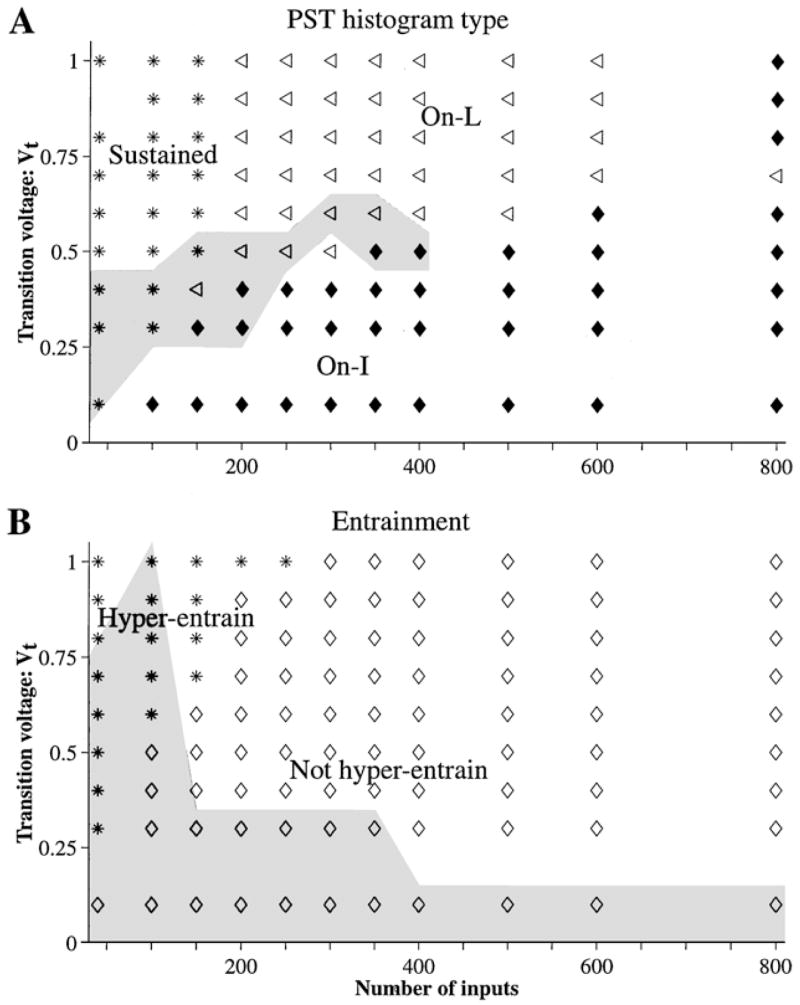
Response properties of the dynamic spike-blocking model for different N and Vt . A: PST histogram type for 6000 Hz tone bursts. The gray-shaded area indicates the N and Vt pairs that produced non-monotonic rate-level curves (NI ≥ 0.08). B: Entrainment to 100 Hz tones presented at 90 dB SPL. A response is classified as hyper-entraining to the stimulus if the EI is greater than 1.1. The gray-shaded area indicates the N and Vt pairs for which the model fails to entrain (EI < 0.8) to 800 Hz tones presented at 90 dB SPL. N · Gα = 8.8.
Entrainment by the model, when N · Gα is 8.8, is summarized in B. Combinations of Vt and N that result in hyper-entrainment to 100 Hz tones are distinguished from combinations that do not produce hyper-entrainment by different plot symbols. A hyper-entraining response (EI > 1.1) occurs for small N (<200) and large Vt (>0.6).3 The gray-shaded area indicates the region for which the model fails to entrain to 800 Hz tones (EI < 0.8). This region encompasses values of Vt < 0.3 or N < 100. Together, the unshaded regions (entrainment to 800 Hz tones) and the diamond plot symbols (no hyper-entrainment to 100 Hz tones) show that the model entrains to tones up to 800 Hz without hyper-entraining to 100 Hz tones when it has 200 or more inputs and Vt is greater than 0.3.
Finally, putting together Fig. 9A and B reveals the conditions under which the dynamic spike-blocking model produces On-L PST histograms, monotonic rate-level curves, and entrainment:
– 200 ≤ N ≤ 600
– Vt roughly between 0.6 and 1.
– 8.8 ≤ N . Gα < 10.
The model produces On-L discharge patterns over a broad range of N between 200 and 600. Although any N in this range results in On-L PST histograms at high levels, the responses to high-frequency tone bursts for large N increasingly resemble On-I responses. As N is increased toward 600, the PST histogram shape is On-I for an increasingly broader range of low stimulus levels above threshold, until for N more than 600, PST histograms are On-I at all stimulus levels.
4. Discussion
4.1. Dynamic Spike-Blocking State
We have shown that an integrate-to-threshold model with an input-dependent release from a spike-blocking state can account for discharge patterns to tones of On-I and On-L neurons. Such a model, implemented with a spike-blocking state that lasts until the membrane voltage falls below a criterion, produces both entrainment to a broad range of low-frequency tones and On-I/On-L PST histograms for high-frequency tone bursts. We have specifically tested the effects of (1) the voltage level (Vt) that causes transition out of the spike-blocking state, (2) the number of inputs (N), and (3) the net synaptic strength (N · Gα). Vt is tightly constrained between the resting voltage and the spiking threshold for both On-I and On-L discharge patterns, although to slightly different values for the two types. N is constrained to be greater than 300 for producing On-I discharge patterns. On the other hand, while N can be somewhat lower (≈200) and produce On-L discharge patterns, it cannot be greater than 600. N · Gα must be high enough (10 or higher) for the model to produce entrainment across a broad range of frequencies and On-I PST histograms, but it must be less (between 8.8 and 10) to get On-L discharge patterns.
Our model is just one possible implementation of a dynamic spike-blocking state. The parameter space of our implementation is restricted, especially for producing On-L discharge patterns. In particular, the constraint on N · Gα is tight to avoid producing non-monotonic rate-level functions. This lack of robustness to parameter variations is a weakness. However, this weakness is particularly acute in our implementation compared to other possible implementations of a dynamic spike-blocking state. For example, if the transition out of a spike-blocking state were a function of the slope of the voltage rather than the voltage itself, then the model would be less likely to produce nonmonotonic rate versus level functions because the slope varies relatively less than the voltage with stimulus level. As a result, the model would have a less stringent dependence on parameters. Such an implementation is further discussed below under biophysical mechanisms.
4.1.1. Testable Prediction of Response Properties for On Neurons
The model results lead to a prediction of combinations of response properties that should be observed in On neurons. On-L PST histograms produced by the dynamic spike-blocking model (Fig. 8) have a brief 2 to 3 millisecond cessation of activity immediately after the onset peak whereas there is no such pause in On-L PST histograms produced by the constant-refractoriness model (Kalluri and Delgutte, 2003, Fig. 6). Both types of On-L PST histograms are observed in the data (Rhode and Smith, 1986; Blackburn and Sachs, 1989; Winter and Palmer, 1995). Because only the dynamic spike-blocking model entrains over a broad frequency range, we predict that entrainment over a wide frequency range should be found only in neurons with On-L PST histograms that have a short pause between the onset peak and steady-state activity.
4.1.2. The Scope of Model Predictions
A limitation of this study is that entrainment to a broad range of low-frequency tones is not found in all On neurons.4 In Kalluri and Delgutte (2003), we showed that a constant-refractoriness model can produce On-I, On-L, and On-C PST histograms. Only when it is also required to entrain to a broad range of low-frequency tones does the constant-refractoriness model fail for On-I and On-L neurons. Therefore, our predictions regarding the model characteristics needed for producing On-I, On-L, and On-C discharge patterns strictly apply to the subset of On neurons that entrain to a broad range of low-frequency tones. By focusing on neurons that entrain to low-frequency tones, we have been able to make testable predictions about characteristics of the different types of On neurons.
Pure tones may not reveal the true extent to which On neurons are capable of entraining to low-frequency modulations of stimuli with broad spectra. Some On neurons may not be entraining to low-frequency pure tones simply because their thresholds at these frequencies are too high, even though they may be capable of entraining to low-frequency modulations of the synaptic input. Stimuli with significant high-frequency energy, such as click trains, AM tones, or harmonic tone complexes, may be better suited than pure tones for revealing the capacity for entrainment in such neurons.
4.2. Biophysical Basis of the Dynamic Spike-Blocking State
We have proposed a dynamic spike-blocking state in terms of its computational properties, but it is worth considering the biophysical mechanisms that may lead to such a phenomenon. Given the abstract nature of our model, we recognize that a literal interpretation of our model in terms of the underlying biophysical mechanisms may not hold up to the intracellular data.
Indeed, an in vitro experiment from octopus cells argues against a spike-blocking state lasting indefinitely until the input falls below a transition level (Oertel et al., 2000). In this experiment, for a staircase-shaped current injection with three successive 10 ms steps of 2 nA each, the octopus cell fired a spike to each step, suggesting that the spike-blocking state did not last throughout the duration of each step. However, this experiment does not rule out a less literal interpretation of our abstract model, such as an implementation based on a slope threshold.
Whatever the specific implementation, our abstract model shows that a cell that fires a spike only for rapid increases in the synaptic input can produce both On-I/On-L PST histograms and entrainment. In typical neurons, the membrane voltage controls spike generation but it can exhibit fast rising or falling phases that are not present in the synaptic input waveform due to the action of voltage-gated ion channels. For such neurons, our model specifies that sensitivity to rapid increases in the synaptic input requires the excitability of the neural membrane following an action potential to be sharply modulated by the membrane voltage or a function of the membrane voltage such as its derivatives. Moreover, our model shows that the transition from the nonexcitable state to the excitable state must be constrained to a tight range (e.g., an appropriate Vt in our implementation). Both a voltage-dependent membrane excitability and a sharp transition in an appropriate range are required to get spike responses only for rapid elevations in the synaptic input. We discuss two possible biophysical mechanisms that may underlie such a phenomenon—one based on activation of low-threshold potassium channels and the other on the inactivation of sodium channels.
4.2.1. Low-Threshold Potassium Channels
Outward-rectifying low-threshold potassium (K +) channels, found in many auditory brainstem neurons, confer on a neural membrane a sensitivity to the slope of the membrane voltage that may be the basis for a voltage-dependent excitability. In octopus cells, this conductance (Bal and Oertel, 2001) enables the action-potential threshold to be determined by the rate of change of the membrane voltage, rather than the absolute voltage (Ferragamo and Oertel, 2002; Cai et al., 2000). The slope sensitivity comes about because slowly rising depolarizations are unable to outpace the outward K + current and cause a spike.
Two properties are crucial for low-threshold K + channels to underlie spiking exclusively for fast-rising synaptic inputs—(1) a slope-threshold for spiking and (2) a voltage level immediately after a spike that varies with the input (an input-dependent membrane reset). Figure 10 shows how these two factors might work together, first illustrating the failure to get repetitive spiking for sustained inputs and then demonstrating entrainment to oscillating inputs. A slope threshold for spiking results in spikes whenever the synaptic input rises rapidly. The input-dependent membrane reset restricts spiking only for fast-rising synaptic inputs because the membrane voltage recovers from a higher voltage level and thereby lower slope for a sustained input (Fig. 10A) compared to the slope of recovery for rapidly varying inputs (Fig. 10B). Such input-dependent reset might happen if strong synaptic inputs are not completely shunted by the voltage-dependent conductances of the action potential (Hausser et al., 2001). Thus, in this hypothetical mechanism, a “spike-blocking” state comes about from the crucial reset level after a spike whereby the subsequent rising membrane voltage does not have a large enough slope to generate another spike. If the membrane reset after the spike were independent of the input, then the slope of recovery after a spike would not be different for oscillating and sustained inputs so that spiking would not be restricted only to fast-rising synaptic inputs.
Figure 10.
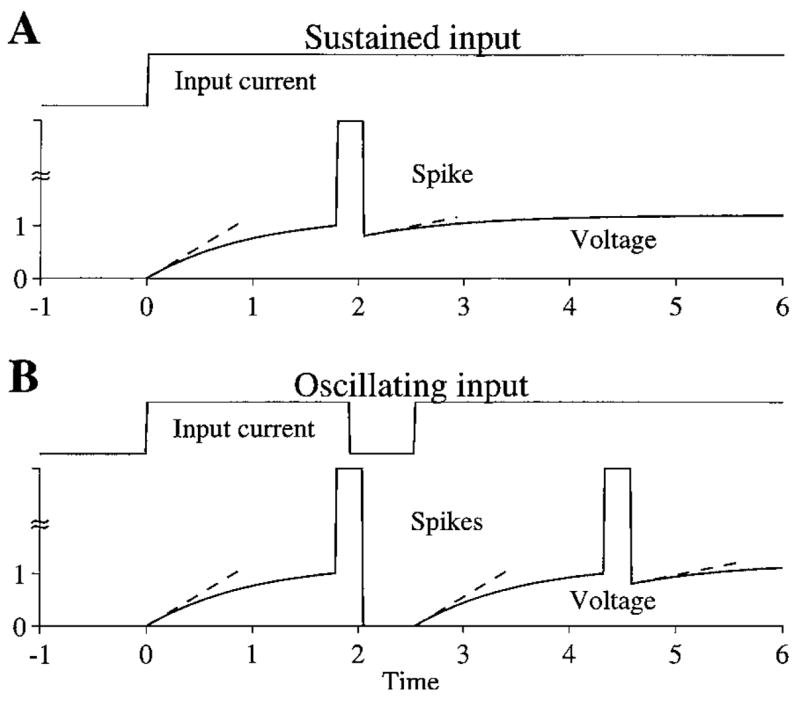
Schematic of how a slope-threshold for spiking and an input-dependent membrane reset might underlie a dynamic spike-blocking state. A: Voltage response to a sustained input rises from 0, and has a slope (dashed line) that is sufficient to lead to a spike. At the end of the spike, the voltage is reset to 0.8, thereby making the shallow slope of the subsequent rise of voltage insufficient to produce a spike. B: Voltage response to an oscillating input rises from 0, and has a slope that is sufficient to lead to a spike. At the end of the spike, the voltage is reset to 0 because there is no input to the membrane. Therefore, the subsequent elevation of the input increases the membrane voltage with a sufficiently steep slope to produce another spike.
In vitro data from octopus cells are broadly consistent with the existence of an input-dependent reset of the membrane after a spike (Oertel et al., 2000). These data show that the membrane voltage in response to a rapidly presented train of depolarizing pulses falls several millivolts below rest after each spike while it always stays above or near rest during sustained inputs (Golding et al., 1999; Oertel et al., 2000). While such data show that octopus cells have an input-dependent membrane reset in addition to a slope threshold, there is nevertheless insufficient information for determining whether the reset level of the voltage would be in an appropriate range for the slope of the recovering voltage to produce spiking exclusively for fast-rising synaptic inputs.
4.2.2. Sodium-Channel Inactivation
The inactivation of voltage-gated sodium (Na+) channels, one of the principal channels underlying fast spiking in neurons, is another phenomenon that might underlie exclusive spiking to fast-rising synaptic inputs. These channels carry the principal inward current underlying action potentials. Their inactivation by the large depolarizations of action potentials prevent additional spikes because these channels cannot carry current in the inactive state. To get additional spikes, a sufficient number of Na+ channels must become de-inactivated, an event that happens in typical neurons when the membrane voltage returns to rest for a sufficiently long time. When the membrane voltage does not return to rest, too many channels stay inactivated to allow additional spikes. This phenomenon, known as depolarization block, has been proposed as a possible mechanism underlying On discharge patterns (Romand, 1978; Ritz and Brownell, 1982; Feng et al., 1994). In this conception, the transition level would be the crucial voltage below which inactive Na+ channels become de-inactivated. For this mechanism to underlie dynamic spike blocking, the transition between the inactivated and de-inactivated states should be a sharp function of voltage and, as in the low-threshold K + mechanism, the membrane reset after a spike must be input dependent.
Unlike those of K + channels, the kinetics of Na+ channels have not been characterized in CN neurons. In Na+ channels from other neurons, the transition from inactivated to de-inactivated states does not appear to be sharp enough to meet the requirements for a dynamic spike-blocking state. Na+ channels from mammalian myelinated fibers have voltage ranges for transition from 10% de-inactivated to 90% de-inactivated of approximately 5 mV (Schwarz and Eikhof, 1987; Rattay and Aberham, 1993). This range is at least twice as broad as the broadest possible transition range in a probabilistic version of our dynamic spike-blocking model (Kalluri, 2000). With such broad transitions, most Na+ channels can become de-inactivated early enough during a single cycle of a very low-frequency tone to enable more than one spike per cycle. Furthermore, the in vitro data from Oertel et al. (2000), showing that octopus cells discharge a spike to every step of a staircase-shaped current injection, suggest that Na+ inactivation cannot, by itself, fully account for a dynamic spike-blocking state.
Actual neurons are complex, so that a slope-threshold due to low-threshold K + channels might interact with Na+ inactivation, input-dependent membrane reset, and other ion channels to produce an effect consistent with a dynamic spike-blocking mechanism. To understand how these factors might work together, it is necessary to use quantitative biophysical models.
4.2.3. Biophysical Models of On-Responding Neurons
There exist biophysical conductance-based models of bushy cells and octopus cells with low-threshold K + channels and inactivating Na+ channels that can produce On PST histograms for high-frequency tone bursts (Rothman et al., 1993; Cai et al., 1997).
Point-Neuron with Low-Threshold K + Channels
The bushy-cell model of Rothman et al. (1993) is one of the best characterized models of CN neurons. It is a point-neuron model with conventional inactivating Na+ and high-threshold K + currents that underlie action potentials, as well as a low-threshold K + current similar to that found in bushy cells (Manis and Marx, 1991). This model meets the requirements for a dynamic spike-blocking state in that an action potential occurs only if directly preceded by the membrane voltage falling toward rest. Moreover, the membrane voltage after a spike resets to a level that depends on the amplitude of the input. To see how these factors interact, we implemented the Rothman et al. (1993) model and examined its responses to current waveforms that approximate the net synaptic current for 400 AN inputs in the dynamic spike-blocking model (current waveforms in Figs. 2 and 3 above), which produced realistic On-I responses.
Despite producing On PST histograms for high-frequency tone bursts, the model was unable to entrain over a broad range of frequencies without also hyper-entraining to very low-frequency tones and producing Sustained PST histograms (Kalluri and Delgutte, 2000). This failure is due to the release from the spike-blocking state not being a sharp enough function of voltage. The absence of a sharp transition may be due to the model possessing a relatively low slope-threshold or due to the Na+ inactivation having a relatively shallow voltage dependence. The transition from the spike-blocking state might be made sharper in the model by increasing the density of low-threshold K + channels, thereby increasing the slope-threshold for spiking. Alternatively, the voltage dependence of Na+ inactivation could be made sharper.
Compartmental Model of Octopus Cells
A compartmental model of octopus cells (Cai et al., 1997, 2000) resembles the Rothman et al. (1993) model in that it has similar voltage-gated channels (with an additional hyperpolarization-activated channel). Moreover, the parameters of the low-threshold K + conductance are modified to endow this model with a slope-threshold for spiking (10 to 11 mV/ms) that matches observations from octopus cells (Ferragamo and Oertel, 2002). This model is hard to evaluate because its responses to low-frequency tones were not reported in detail. In the one example of responses to low-frequency tones given, the model did not entrain, failing to fire a spike every other or few cycles. The model has a sufficiently large number of parameters that might be tuned so as to obtain more realistic entrainment. Until the issue of entrainment is addressed directly, it is not possible to either rule out or prove that the combination of K + channels and Na+ inactivation might provide an implementation of our dynamic spike-blocking state.
In summary, we have proposed two plausible biophysical mechanisms for the dynamic spike-blocking state, one based on low-threshold K + channels and the other based on inactivation of Na+ channels. Neither biophysical evidence nor existing biophysical models allow us to identify which, if any, of these two mechanisms is responsible for entrainment, or whether some other mechanisms are also required. We suggest experiments next to help pinpoint the mechanism for the dynamic spike-blocking state.
4.2.4. In Vitro Experiments for Testing the Dynamic Spike-Blocking Model
Measurements of intracellular membrane voltage in response to a current injection shown in Fig. 11 can reveal whether a cell has two input-dependent states of excitability following a spike. The stimulus has three contiguous epochs, the first and third are rectangular pulses of the same fixed amplitude K1 and very brief duration and the second is a pulse with adjustable amplitude K2 and adjustable duration T . If the amplitude of the first and third epochs are sufficient to always evoke a spike when presented in isolation, then the probability of a spike in response to the third epoch as a function of T is a measure of how the cell recovers after an action potential. A dynamic spike-blocking state will show up as an abrupt change in the recovery characteristic for a small change in K2. On the other hand, a cell behaving like the constant-refractoriness model would have no change or a gradual change in recovery characteristics with K2. This suggested experiment extends the Oertel et al. (2000) experiment employing staircase-shaped current injections by quantifying the timing and sharpness of transition from a putative dynamic spike-blocking state.
Figure 11.
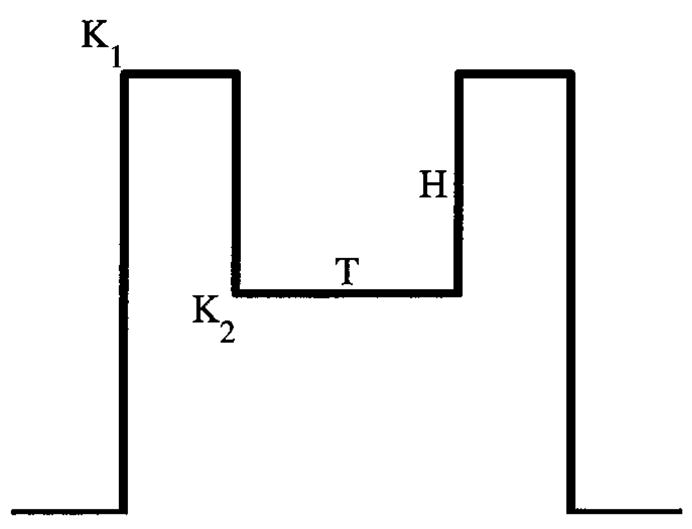
A current-injection stimulus for proposed in vitro experiments to test the dynamic spike-blocking model. See text for description of the experiments.
There are two principal differences between an implementation of the dynamic spike-blocking state with low-threshold K + channels and with inactivation of Na+ channels: (1) The mechanism based on inactivation of Na+ channels requires the prior occurrence of a spike in order to engage the spike-blocking state, while such prior occurrence of a spike is not needed with low-threshold K + channels; (2) transition out of the spike-blocking state depends on membrane voltage falling below an absolute level in the Na+-inactivation mechanism, while such transition in the low-threshold K + mechanism requires the derivative of the membrane voltage to exceed a threshold. Simple modifications of our suggested stimulus in Fig. 11, such as allowing the amplitude of the first and third epoch to be different, can be used to distinguish between these possibilities. For example, let the amplitude in the first epoch, K1, be low enough to evoke a spike on only half of the presentations, and the amplitude during the final epoch, K2 + H, be sufficient to evoke a spike on every presentation if presented in isolation. When such a stimulus complex is presented, if no spike occurs in the final epoch, despite failure to produce a spike in the first epoch, then entry to the spike-blocking state does not require a prior spike. Other manipulations, such as keeping H fixed while varying K2, can be used to determine whether transition out of a spike-blocking state depends on the derivative of the membrane voltage or on excursion of the membrane voltage below an absolute level. For a slope-threshold, the probability of a spike in the third epoch will be independent of K2, because the derivative of the rising membrane voltage in response to the third epoch should be approximately constant.
4.2.5. Summary
Understanding the biophysical basis of the mechanisms underlying the response properties of On neurons and their different subtypes will ultimately require detailed characterization of the kinetics of the constituent ion channels, the distribution of these channels on the neuron, the detailed synaptic organization, and the geometry of dendrites. Here, we argue for the existence of a dynamic spike-blocking state. Although certain aspects of our implementation may appear artificial, the model identifies the properties of a dynamic spike-blocking state that future biophysical models of On neurons must possess. Our model should be viewed as one of many steps toward understanding how the various cellular components contribute to the transformation of input to output by On neurons.
The dynamic spike-blocking state mitigates the tradeoff shown in Kalluri and Delgutte (2003) between following rapidly occurring stimulus fluctuations and responding without short interspike intervals at the onset of sustained stimuli. A similar spike-blocking state may also be used in other neurons, perhaps as part of a more complex computational mechanism. For example, in cortical neurons, a spike-blocking state may be part of the mechanism that enables precisely timed spikes in response to rapidly fluctuating synaptic inputs despite imprecisely timed spikes to smooth, slowly varying synaptic inputs (Mainen and Sejnowski, 1995). Modeling other cells, like On neurons, with known cellular properties and inputs may reveal computational mechanisms that help understand the signal processing by more complex neurons whose inputs and cellular properties are less well understood.
4.3. Classification of On Neurons
The present results suggest a mechanistic rationale for the traditional classification of cochlear nucleus On neurons according to the shape of PST histograms for short tone-bursts into On-I, On-L, and On-C types (Godfrey et al., 1975; Rhode and Smith, 1986; Winter and Palmer, 1995). Such a model-based scheme for classification may be useful for predicting responses of different classes of On neurons to complex stimuli such as speech and music. Figure 12 summarizes the model characteristics needed to simulate the discharge patterns of the different types of On neurons. First, On-L and On-I neurons are distinguished from OnC neurons because a dynamic spike-blocking state is needed to simulate their discharge characteristics. On-I neurons are further distinguished from On-L neurons based on a larger number of inputs and a lower transition voltage. Despite their separation into two groups in Fig. 12, the present results suggest that On-I and On-L neurons may form a continuum, where increasing the number of inputs from 200 to 600 makes responses increasingly On-I-like.
Figure 12.
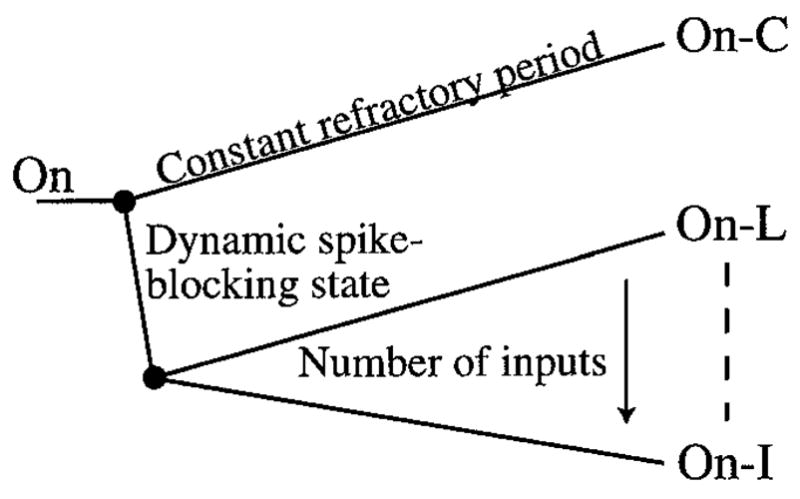
Classification of On neurons based on the characteristics of the model needed for generating their response properties.
In general, classification of VCN neurons based on PST histograms has been useful because it appears to correlate with anatomically distinguishable cell types (Godfrey et al., 1975; Bourk, 1976; Rhode et al., 1983; Rouiller and Ryugo, 1984; Smith and Rhode, 1989; Ostapoff et al., 1994), electrical characteristics (Wu and Oertel, 1984; Oertel et al., 1990; Feng et al., 1994; Golding et al., 1995, 1999), and central projections. Such correlation between types of discharge patterns and cell types has been much less obvious for On neurons. Nevertheless, through direct and indirect evidence, a tentative correspondence has emerged in which On-C discharge patterns are associated with D-stellate cells in the PVCN and the region of the AN root, On-I discharge patterns with octopus cells, and On-L discharge patterns with globular bushy cells in the posterior AVCN and anterior PVCN. If the proposed correlation is correct, then the present results suggest the following hypotheses: (1) The membranes of globular bushy cells and octopus cells differ from those in D-stellate cells by having a dynamic spike-blocking state, and (2) octopus cells have more than 300 AN inputs whereas globular bushy cells can have fewer inputs.
Data from On neurons are broadly consistent with the proposed hypotheses. Although characteristics of recovery from spiking have not been studied in CN neurons, there is considerable evidence that electrical characteristics of stellate cells differ greatly from those of bushy cells and octopus cells (Wu and Oertel, 1984; Manis and Marx, 1991; Oertel et al., 1990; Feng et al., 1994; Golding et al., 1995, 1999). Moreover, globular bushy cells appear to receive fewer AN inputs than octopus cells. Octopus cells are known to be densely covered with AN synapses on the soma and proximal dendrites (Kane, 1973; Brawer et al., 1974). Based on measurements of somatic and dendritic surface areas, fractions of the surface areas occupied by synaptic contacts, and the average surface areas of the synaptic contacts (Kane, 1973), we estimate 500 to 600 AN synapses per octopus cell. Some globular bushy cells are thought to have around 60 somatic synapses and do not appear to receive much AN synaptic input on their dendrites (Cant and Morest, 1979; Tolbert and Morest, 1982).
In summary, variations in the refractory characteristics, number of inputs, and strength of synapses successfully account for most of the temporal discharge patterns for tones in On neurons. This shows that a great variety of response properties can be understood from simple principles.
Acknowledgments
This article is based on a doctoral dissertation submitted by the first author to the Harvard-MIT Division of Health Sciences and Technology. We thank John Guinan, Chris Shera, Jonathan Simon, and the two anonymous reviewers for comments on the manuscript. This research was supported by research grant DC-02258 and training grant DC-00038 from the National Institute of Deafness and Other Communications Disorders.
Footnotes
We have chosen to use the term spike-blocking state rather than refractory state even though in much of our presentation, we treat a spike-blocking state as equivalent to a refractory state. We prefer the former term to recognize that a refractory period suggests biophysical processes triggered by the occurrence of a spike, whereas such spike-dependent entry into a spike-blocking state is not necessarily involved in the mechanism hypothesized in this article.
Using a nonmonotonicity index NI (defined in the Methods section), we classified rate versus level functions as nonmonotonic when NI ≥ 0.08 because this was the maximum NI we found for rate-level functions from On neurons in the data of Winter and Palmer (1995).
When it is greater than 1, Vt will almost always be above the membrane voltage, so that the model will act like the constant-refractoriness model. In such cases, the model should hyper-entrain to low-frequency tones regardless of N . We have confirmed that this is the case for a few values of N . Indeed, we have also confirmed for a few values of N that the model produces chopping for high-frequency tone bursts when Vt is greater than 1.
The fraction of On neurons that fail to entrain to a broad range of low-frequency tones is difficult to assess from the published data because entrainment has not been systematically examined in most studies.
Contributor Information
SRIDHAR KALLURI, Speech and Hearing Sciences Program, Harvard University—Massachusetts Institute of Technology, Division of Health Sciences and Technology; Eaton-Peabody Laboratory, Massachusetts Eye and Ear Infirmary, 243 Charles St., Boston, MA 02114 sridhar kalluri@alum.mit.edu.
BERTRAND DELGUTTE, Eaton-Peabody Laboratory, Massachusetts Eye and Ear Infirmary, 243 Charles St., Boston, MA 02114; Research Laboratory of Electronics, Massachusetts Institute of Technology; Speech and Hearing Sciences Program, Harvard University—Massachusetts Institute of Technology, Division of Health Sciences and Technology.
References
- Bal R, Oertel D. Potassium currents in octopus cells of the mammalian cochlear nucleus. J Neurophysiol. 2001;86:2299–2311. doi: 10.1152/jn.2001.86.5.2299. [DOI] [PubMed] [Google Scholar]
- Blackburn C, Sachs M. Classification of unit types in the anteroventral cochlear nucleus: PST histograms and regularity analysis. J Neurophys. 1989;62(6):1303–1329. doi: 10.1152/jn.1989.62.6.1303. [DOI] [PubMed] [Google Scholar]
- Bourk T. Ph.D. dissertation. Massachusetts Institute of Technology; 1976. Electrical responses of neural units in the anteroventral cochlear nucleus of the cat. [Google Scholar]
- Brawer J, Morest D, Kane E. The neuronal architecture of the cochlear nucleus of the cat. J Comp Neurol. 1974;155:251–300. doi: 10.1002/cne.901550302. [DOI] [PubMed] [Google Scholar]
- Cai Y, Walsh EJ, McGee J. Mechanisms of onset responses in octopus cells of the cochlear nucleus: Implications of a model. J Neurophys. 1997;78:872–883. doi: 10.1152/jn.1997.78.2.872. [DOI] [PubMed] [Google Scholar]
- Cai Y, Walsh EJ, McGee J. Contributions of ionic conductances to the onset responses of octopus cells in the ventral cochlear nucleus. J Neurophys. 2000;83(1):301–314. doi: 10.1152/jn.2000.83.1.301. [DOI] [PubMed] [Google Scholar]
- Cant N, Morest D. The bushy cells in the anteroventral cochlear nucleus of the cat. A study with the electron. microscope Neurosci. 1979;4:1924–1945. doi: 10.1016/0306-4522(79)90066-6. [DOI] [PubMed] [Google Scholar]
- Carney L. A model for the responses of low-frequency auditory-nerve fibers in cat. J Acoust Soc Am. 1993;93:401–417. doi: 10.1121/1.405620. [DOI] [PubMed] [Google Scholar]
- Feng J, Kuwada S, Ostapoff E-M, Batra R, Morest D. A physiological and structural study of neuron types in the cochlear nucleus: I. Intracellular responses to acoustic stimulation and current injection. J Comp Neurol. 1994;346:1–18. doi: 10.1002/cne.903460102. [DOI] [PubMed] [Google Scholar]
- Ferragamo MJ, Oertel D. Octopus cells of the mammalian ventral cochlear nucleus sense the rate of depolarization. J Neurophys. 2002;87:2262–2270. doi: 10.1152/jn.00587.2001. [DOI] [PubMed] [Google Scholar]
- Godfrey D, Kiang N, Norris B. Single unit activity in the posteroventral cochlear nucleus. J Comp Neurol. 1975;162:247–268. doi: 10.1002/cne.901620206. [DOI] [PubMed] [Google Scholar]
- Golding NL, Ferragamo MJ, Oertel D. Role of intrinsic conductances underlying responses to transients in octopus cells of the cochlear nucleus. J Neurosci. 1999;19(8):2897–2905. doi: 10.1523/JNEUROSCI.19-08-02897.1999. [DOI] [PMC free article] [PubMed] [Google Scholar]
- Golding NL, Robertson D, Oertel D. Recordings from slices indicate that octopus cells of the cochlear nucleus detect coincident firing of AN fibers with temporal precision. J Neurosci. 1995;15:3138–3153. doi: 10.1523/JNEUROSCI.15-04-03138.1995. [DOI] [PMC free article] [PubMed] [Google Scholar]
- Hausser M, Major G, Stuart GJ. Differential shunting of EPSPs by action potentials. Science. 2001;291:138–141. doi: 10.1126/science.291.5501.138. [DOI] [PubMed] [Google Scholar]
- Irvine D, Gago G. Binaural interaction in high-frequency neurons in inferior colliculus of the cat: Effects of variations in sound pressure level on sensitivity to interaural differences. J Neurophysiol. 1990;63:570–591. doi: 10.1152/jn.1990.63.3.570. [DOI] [PubMed] [Google Scholar]
- Johnson D. The relationship between spike rate and synchrony in responses of auditory-nerve fibers to single tones. J Acoust Soc Am. 1980;68(4):1115–1122. doi: 10.1121/1.384982. [DOI] [PubMed] [Google Scholar]
- Kalluri S. Ph.D. dissertation. Massachusetts Institute of Technology; 2000. Cochlear nucleus onset neurons studied with mathematical models. [Google Scholar]
- Kalluri S, Delgutte B. Models for the diversity of response properties of cochlear nucleus onset neurons. Assoc Res Otolaryngol Abstr. 2000;23:5368. [Google Scholar]
- Kalluri S, Delgutte B. Mathematical models of cochlear nucleus onset neurons: I. Point neuron with many weak synaptic inputs. J Comp Neurosci. 2003;14:71–90. doi: 10.1023/a:1021128418615. [DOI] [PMC free article] [PubMed] [Google Scholar]
- Kane EC. Octopus cells in the cochlear nucleus of the cat: Heterotypic synapses upon homeotypic neurons. Intern J Neuroscience. 1973;5:251–279. doi: 10.3109/00207457309149485. [DOI] [PubMed] [Google Scholar]
- Kiang N, Pfeiffer R, Warr W, Backus A. Stimulus coding in the cochlear nucleus. Annals of Otology, Rhinology and Laryngology. 1965;74(2):463. doi: 10.1177/000348946507400216. [DOI] [PubMed] [Google Scholar]
- Liberman MC. Central projections of auditory-nerve fibers of differing spontaneous rate. I. Anteroventral cochlear nucleus. J Comp Neurol. 1991;313:240–258. doi: 10.1002/cne.903130205. [DOI] [PubMed] [Google Scholar]
- Liberman MC. Central projections of auditory-nerve fibers of differing spontaneous rate: II. Posteroventral and dorsal cochlear nucleus. J Comp Neurol. 1993;327:17–36. doi: 10.1002/cne.903270103. [DOI] [PubMed] [Google Scholar]
- Mainen ZF, Sejnowski TJ. Reliability of spike timing in neocortical neurons. Science. 1995;268:1503–1506. doi: 10.1126/science.7770778. [DOI] [PubMed] [Google Scholar]
- Manis P, Marx S. Outward currents in isolated ventral cochlear nucleus neurons. J Neurosci. 1991;11:2865–2880. doi: 10.1523/JNEUROSCI.11-09-02865.1991. [DOI] [PMC free article] [PubMed] [Google Scholar]
- Oertel D. Synaptic responses and electrical properties of cells in brain slices of the mouse anteroventral cochlear nucleus. J Neurosci. 1983;3:2043–2053. doi: 10.1523/JNEUROSCI.03-10-02043.1983. [DOI] [PMC free article] [PubMed] [Google Scholar]
- Oertel D, Bal R, Gardner S, Smith P, Joris P. Detection of synchrony in the activity of auditory nerve fibers by octopus cells of the mammalian cochlear nucleus. Proc Nat Acad Sciences. 2000;97(22):11773–11779. doi: 10.1073/pnas.97.22.11773. [DOI] [PMC free article] [PubMed] [Google Scholar]
- Oertel D, Wu SH, Garb M, Dizack C. Morphology and physiology of cells in slice preparations of the posteroventral cochlear nucleus of mice. J Comp Neurol. 1990;295:136–154. doi: 10.1002/cne.902950112. [DOI] [PubMed] [Google Scholar]
- Ostapoff E-M, Feng J, Morest D. A physiological and structural study of neuron types in the cochlear nucleus: II. Neuron types and their structural correlation with response properties. J Comp Neurol. 1994;346:19–42. doi: 10.1002/cne.903460103. [DOI] [PubMed] [Google Scholar]
- Rattay F, Aberham M. Modeling axon membranes for functional electrical stimulation. IEEE Transactions on Biomedical Engineering. 1993;40(12):1201–1209. doi: 10.1109/10.250575. [DOI] [PubMed] [Google Scholar]
- Rhode W, Oertel D, Smith P. Physiological response properties of cells labeled intracellularly with horseradish peroxidase in cat ventral cochlear nucleus. J Comp Neurol. 1983;213:448–463. doi: 10.1002/cne.902130408. [DOI] [PubMed] [Google Scholar]
- Rhode W, Smith P. Encoding of timing and intensity in the ventral cochlear nucleus of the cat. J Neurophysiol. 1986;56:261–286. doi: 10.1152/jn.1986.56.2.261. [DOI] [PubMed] [Google Scholar]
- Ritz L, Brownell W. Single unit analysis of the posteroventral cochlear nucleus of the decerebrate cat. Neuroscience. 1982;7:1995–2010. doi: 10.1016/0306-4522(82)90013-6. [DOI] [PubMed] [Google Scholar]
- Romand R. Survey of intracellular recording in the cochlear nucleus of the cat. Brain Res. 1978;148:43–65. doi: 10.1016/0006-8993(78)90377-3. [DOI] [PubMed] [Google Scholar]
- Rothman J, Young E, Manis P. Convergence of auditory nerve fibers onto bushy cells in the ventral cochlear nucleus: Implications of a computational model. J Neurophys. 1993;70:2562–2583. doi: 10.1152/jn.1993.70.6.2562. [DOI] [PubMed] [Google Scholar]
- Rouiller E, Ryugo D. Intracellular marking of physiologically characterized cells in the ventral cochlear nucleus of the cat. J Comp Neurol. 1984;225:167–186. doi: 10.1002/cne.902250203. [DOI] [PubMed] [Google Scholar]
- Schwarz JR, Eikhof G. Na currents and action potentials in rat myelinated nerve fibres at 20 and 37°C. Pflügers Arch. 1987;409:569–577. doi: 10.1007/BF00584655. [DOI] [PubMed] [Google Scholar]
- Smith PH, Rhode WS. Structural and functional properties distinguish two types of multipolar cells in the ventral cochelar nucleus. J Comp Neurol. 1989;282:595–616. doi: 10.1002/cne.902820410. [DOI] [PubMed] [Google Scholar]
- Tolbert L, Morest D. The neuronal architecture of the anteroventral cochlear nucleus of the cat in the region of the cochlear nerve root: Electron microscopy. Neuroscience. 1982;7:3053–3067. doi: 10.1016/0306-4522(82)90229-9. [DOI] [PubMed] [Google Scholar]
- Winter I, Palmer A. Level dependence of cochlear nucleus onset unit responses and facilitation by second tones or broadband noise. J Neurophys. 1995;73:141–159. doi: 10.1152/jn.1995.73.1.141. [DOI] [PubMed] [Google Scholar]
- Wu S, Oertel D. Intracellular injection with horseradish peroxidase of physiologically characterized stellate and bushy cells in slices of mouse anteroventral cochlear nucleus. J Neurosci. 1984;4:1577–1588. doi: 10.1523/JNEUROSCI.04-06-01577.1984. [DOI] [PMC free article] [PubMed] [Google Scholar]