

Abstract
Rubinstein et al. [Hear. Res. 127, 108–118 (1999)] suggested that the neural representation of the waveforms of electric stimuli might be improved by introducing an ongoing, high-rate, desynchronizing pulse train (DPT). A DPT may desynchronize neural responses to electric stimulation in a manner similar to spontaneous activity in a healthy ear. To test this hypothesis, responses of auditory-nerve fibers (ANFs) to 10-min-long electric pulse trains (5 kpps) were recorded from acutely deafened, anesthetized cats. Stimuli were delivered via an intracochlear electrode, and their amplitude was chosen to elicit a response in most ANFs. Responses to pulse trains showed pronounced adaptation during the first 1–2 min, followed by either a sustained response or cessation of spike discharges for the remainder of the stimulus. The adapted discharge rates showed a broad distribution across the ANF population like spontaneous activity. However, a higher proportion of fibers (46%) responded to the DPT at rates below 5 spikes/s than for spontaneous activity, and 12% of the fibers responded at higher rates than any spontaneously active fiber. Interspike interval histograms of sustained responses for some fibers had Poisson-like (exponential) shapes, resembling spontaneous activity, while others exhibited preferred intervals and, occasionally, bursting. Simultaneous recordings from pairs of fibers revealed no evidence of correlated activity, suggesting that the DPT does desynchronize the auditory nerve activity. Overall, these results suggest that responses to an ongoing DPT resemble spontaneous activity in a normal ear for a substantial fraction of the ANFs.
I. Introduction
Cochlear implant patients rely heavily on temporal information for speech reception (Van Tasell et al., 1987, 1992; Rosen, 1992). For example, in continuous interleaved sampling (CIS) sound-processing strategies, temporal information about sounds is encoded in the amplitude modulations of pulse trains (Wilson et al., 1991). Proper representation of stimulus waveforms in the temporal discharge patterns of the auditory nerve is therefore an important goal in these and other strategies.
Despite the importance of temporal information in cochlear implants, the temporal discharge patterns of auditory-nerve fibers to electric stimuli are typically very different from acoustic responses in a normally functioning ear [see Javel (1990) for review]. In response to sinusoidal electric stimuli, spikes occur only during a small fraction of the stimulus cycle, resulting in a poor representation of the stimulus waveform (Hartmann et al., 1984; van den Honert and Stypulkowski, 1987; Parkins, 1989; Litvak et al., 2001). For low frequency (<800 Hz) stimuli, spikes tend to occur exactly once per stimulus cycle (Moxon, 1967; van den Honert and Stypulkowski, 1987; Javel and Shepherd, 2000; Litvak et al., 2001). Such entrainment does not occur for acoustic stimulation. On the other hand, because electric stimulation can produce much higher discharge rates than acoustic stimulation, neural refractoriness causes severe distortions in the temporal discharge patterns with electric sinusoids, particularly for frequencies above 800 Hz (Parkins, 1989; Javel, 1990; Javel and Shepherd, 2000; Wilson et al., 1997; Litvak et al., 2001). With complex waveforms such as vowels, the narrow dynamic range to electric stimulation (only a few decibels) allows only the largest waveform peaks to be represented in the temporal discharge patterns (van den Honert and Stypulkowski, 1987; Knauth et al., 1994). In short, the combination of a limited dynamic range, neural refractoriness, abnormally high discharge rates and exaggerated synchrony make the temporal discharge patterns to electric stimuli highly unnatural compared to normal acoustic stimulation. The goal of the present paper and its companions (Litvak et al., 2003a, b) is to test the physiological validity of one proposed scheme (Rubinstein et al., 1999) for restoring more natural temporal cues with cochlear implants.
Rubinstein et al. (1999) proposed that the temporal coding of electric stimuli might be improved by introducing a sustained, high-frequency, “desynchronizing” pulse train (DPT) in addition to the basic processor output. Their rationale is that noise in the neural membrane, as well as across-fiber differences in sensitivity, refractoriness, adaptation, and other properties, will result in the responses across fibers being desynchronized shortly after the onset of DPT stimulation. Such desynchronization would lead to an improved representation of the stimulus waveform in temporal discharge patterns. Rubinstein et al. (1999) further argued that responses to the DPT might mimic the spontaneous activity in a healthy ear. Because fibers with higher spontaneous discharge rates have lower thresholds (Liberman, 1978), spontaneous activity is thought to enhance detection of weak signals. The mechanism for enhanced detection may be related to the phenomenon of stochastic resonance (Wiesenfeld and Moss, 1995). If spontaneous activity could be restored by the DPT, then similar benefits could be provided to cochlear implantees. Finally, Kiang et al. (1970) suggested that some forms of tinnitus, a common complaint among the hearing impaired, are related to the absence of spontaneous activity in a portion of the cochlea. By restoring a form of spontaneous activity under electric stimulation, it may be possible to reduce tinnitus in these patients.
Only a few studies have investigated the responses of auditory-nerve fibers (ANFs) to the high-rate, electric pulse trains proposed by Rubinstein et al. (1999). Moxon (1967) studied responses of ANFs in cats to 900-pps electric pulse trains of relatively long duration (200 s). He found that discharge rates were large at stimulus onset, but decreased markedly over the course of the stimulus. Following adaptation, the discharges were stochastic in that they skipped one, two, or more stimulus pulses in an irregular sequence, and thus their timing was similar to that of normal spontaneous activity (Kiang et al., 1965). However, Moxon reported that sustained discharge rates could still exceed 500 spikes/s, which is much higher than the rates of spontaneous activity in a healthy ear (Liberman, 1978). On the other hand, the higher pulse rates (5 kpps) proposed by Rubinstein et al. (1999) might produce greater adaptation of the neural response and, therefore, discharge rates more consistent with spontaneous activity.
In a previous report (Litvak et al., 2001), we investigated responses to short (200 ms), high-rate (1–5 kpps) DPTs. We found that ANF responses to the DPT were stochastic and resembled spontaneous activity for low to moderate firing rates (<150 spikes/s), but that such moderate rates could only be achieved over a narrow (2–3 dB) range of stimulus levels. Since neural thresholds differ by as much as 10 dB across fibers, this finding implies that only a small fraction of the fibers can respond to any given DPT at rates appropriate for spontaneous activity. Here, we hypothesize that neural adaptation over the course of a long-duration DPT might bring the discharge rates in response to the DPT within the range of normal spontaneous activity for a substantial fraction of the auditory-nerve fiber population. In addition to using short DPTs, our previous study did not address the safety of sustained DPT stimulation. Several studies have reported changes in excitability of the auditory nerve following sustained, high-frequency electric stimulation (Duckert and Miller, 1982; Shepherd, 1986; Killian, 1994; Tykocinski et al., 1995b, 1997), suggesting that such stimulation might cause long-term nerve damage.
In the first part of this paper, we report the results of single-unit experiments designed to test whether responses of ANFs to a long-duration DPT resemble spontaneous activity in a healthy ear. Specifically, (1) the sustained discharge rates evoked by the DPT are compared to the distribution of spontaneous discharge rates (Liberman, 1978, 1990); (2) interval histograms computed from DPT responses are compared to histograms for spontaneous activity (Kiang et al., 1965); and (3) cross-fiber correlations computed from pairs of simultaneously recorded DPT responses are compared to correlations for spontaneous activity (Johnson and Kiang, 1976).
In the second part of this paper we describe measurements of electrically evoked compound action potentials (ECAPs) for a single-pulse probe following DPT stimulation of long duration. While a truly continuous DPT may be unsafe, a DPT that is turned on only when needed may be less traumatic to the auditory nerve. To test this hypothesis, we recorded ECAPs following a 10-min DPT, and compared these responses to ECAPs recorded after 1 h of DPT stimulation.
II. Methods
A. Animal preparation
The animal preparation was similar to that described by Litvak et al. (2001). Cats were anesthetized using dial in urethane (75 mg/kg), and the bulla opened to expose the round window. An intracochlear stimulating electrode was inserted about 8 mm into the cochlea through the round window. The electrode was a Pt/Ir ball, 400 μm in diameter. A similar ball electrode was inserted just inside the round window and used as the return electrode. The round window was then sealed with connective tissue. The resulting wide bipolar configuration was found to reduce stimulus artifact compared to the monopolar configuration (using the ear bar as a return electrode) used in our previous work.
Co-administration of kanamycin (subcutaneous, 300 mg/kg) followed by slow intravenous injection of ethacrinic acid (1 mg/min) was used to deafen the animals (Xu et al., 1993). A 100-μs condensation click was used to measure compound action potentials (CAPs), which were continuously monitored in the non-implanted ear while ethacrinic acid was administered. This measurement provides an assessment of the effect of the drug protocol on hair cell function that is not confounded by the uncontrolled additional trauma caused by electrode insertion. CAP threshold, which is defined as the lowest click level evoking a visually detectable CAP response, exhibited a rapid increase within 1 h of ethacrinic acid injection. However, consistent with previous reports which used a similar protocol (Shepherd and Javel, 1997), we failed to achieve complete deafening in six out of ten animals, even with the maximum safe dose of 40 mg/kg. Table I gives the residual CAP threshold in the non-implanted ear for the ten animals used in this study. Residual CAP thresholds ranged from 80 to >110 dB peak SPL, and often dropped slowly during the course of the experiment (which lasted for 2–3 days). Although CAP thresholds in the implanted ear were not measured, based on our previous work (Litvak et al., 2001), they would be expected to exceed 110 dB SPL, reflecting the additional trauma caused by electrode insertion. Thus, our measure of residual hearing is highly conservative.
TABLE I.
Residual hearing status, DPT level, type of DPT modulation, and number of data records for the ten animals included in this study. Hearing status is assessed by the CAP threshold for a 100-μs click in the non-implanted ear. A click at 0 dB re: 1 V approximately corresponds to a 100 dB SPL peak sound pressure. When two thresholds are given, the first one was measured just after deafening, and the other one at the end of the experiment. DPT modulation is coded as follows: U is unmodulated, S is sinusoidal modulation, and V is vowel modulation.
| Cat | CAP threshold
(dB re: 1 V) |
DPT level
(dB re: 1 mA) |
DPT modulation | No. of records |
|---|---|---|---|---|
| lml11 | −35/2 | 6 | U | 9 |
| lml13 | 0 | 6 | U/S | 26 |
| lml15 | −35/−17 | 8 | U/S | 7 |
| lml16 | −30/>10 | 0 | U/S | 30 |
| lml17 | >10 | 6 | S | 33 |
| lml18 | −22/−4 | −1 | S | 25 |
| lml19 | −12 | 4 | V | 4 |
| lml20 | −7 | 8 | V | 5 |
| lml21 | −40 | 8 | V | 21 |
| zms2 | −30/−5 | 4 | V | 13 |
B. Stimuli
In the four initial experiments, we recorded responses of single ANFs to unmodulated, 10-min, 5-kpps “desynchronizing” electric pulse trains (DPTs). Pulse trains were composed of biphasic (cathodic/anodic) pulses (25 μs per phase). In later experiments, these unmodulated DPTs were replaced by pulse trains that were modulated by either a low-frequency sinusoid or a filtered vowel for 200–400 ms every second (Table I). Details of the modulation waveforms are described in the companion papers (Litvak et al., 2003a, b). For the purpose of this paper, only responses recorded during the unmodulated portions were analyzed. These responses were only used for analysis of average discharge rates; temporal discharge patterns were not analyzed for intermittently modulated stimuli because this analysis requires longer continuous data records than the 600–800-ms unmodulated segments.
For the most part, a single level of the DPT was used for each animal so as to simulate a DPT-enhanced stimulation strategy where an ongoing DPT would be superimposed upon the output of the sound processor, as suggested by Rubinstein et al. (1999). Our experimental design is therefore that of a population study, where responses to the same DPT stimulus are obtained for all the sampled fibers. To maximize data yield, the standard DPT level was selected to stimulate a high percentage of the fibers. For this purpose, electrically evoked compound action potentials (ECAPs) were used to assess the dynamic range of the auditory nerve to electric stimulation for each animal prior to the single-unit recordings. The ECAP recording electrode (a 400-μm-diam Pt/Ir ball) was placed on the auditory nerve near the internal auditory meatus. The stimulus used to evoke the ECAP was a biphasic pulse (25 μs per phase) presented at a 15/s repetition rate. The pulse polarity alternated with each presentation and 30 single-pulse responses were averaged. Because the stimulus artifact is largely reversed by a polarity change, while the neural response retains the same polarity, most of the artifact is cancelled by averaging the responses to opposite polarities.
All stimuli were digitally synthesized using a 40-kHz, 16-bit D/A converter, and presented through a custom-built, high-bandwidth stimulus isolator. All stimulus levels are expressed as peak currents.
C. Single-unit recordings
Standard techniques were used to expose the auditory nerve via a dorsal approach (Kiang et al., 1965). We recorded from single fibers in the auditory nerve using glass micropipettes filled with 3M KCl. A 25-ms, 5-kpps burst of electric pulses presented at the standard DPT level with a repetition rate of 10/s was used as the search stimulus. Neural signals were recorded with a 20-kHz sampling rate. A digital signal processor (DSP) was used to separate spike discharges from the stimulus artifact during the unmodulated stimulus segments in real time. Specifically, a digital moving average filter with a width equal to the 0.2-ms period of the pulse train removed most of the stimulus artifact while preserving the spike shape. Figure 1 shows an example of artifact cancellation for a signal recorded during stimulation with a 5-kpps pulse train. Recorded waveforms were also streamed to disk for off-line analysis.
FIG. 1.
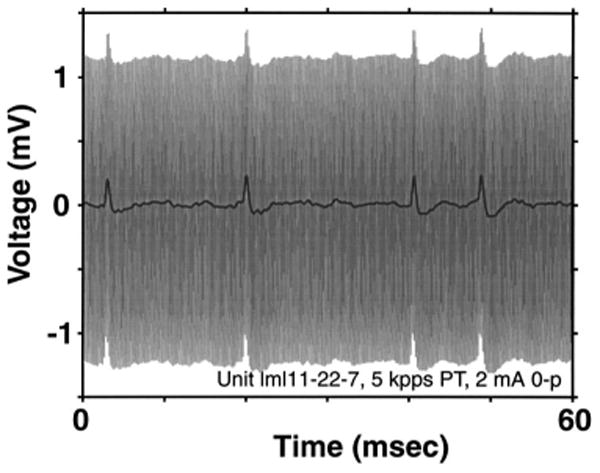
Artifact cancellation technique. The gray trace shows the raw signal recorded from the micropipette, containing spikes as well as the 5-kpps stimulus artifact. The black line is the signal after processing through a 0.2-ms moving-average filter. The artifact has been entirely removed, while spikes are preserved.
The threshold of each fiber to a short electric pulse train (25 ms, 5 kpps) was measured prior to DPT stimulation using a tracking procedure (Taylor and Creelman, 1967). Threshold was defined as the stimulus level that evoked a single spike during the last 10 ms of the stimulus for 50% of the presentations.
In general, the limited contact time with a fiber allowed us to record responses to only one 10-min DPT at the standard level. For a few fibers, however, we were able to record responses to both unmodulated and partially modulated DPTs, or repeat the same stimulus twice. In a few cases, we also presented DPT stimuli 1–4 dB above the standard level in order to examine the effects of larger discharge rates on temporal discharge patterns.
Stimulation with a sustained DPT may have long-term effects on ANF responsiveness. To minimize these long-term effects on our single unit recordings, we waited for at least 10 min between recordings of responses to the DPT (which was at most 10 min long). Whenever possible, we also recorded single-unit thresholds after DPT stimulation, and verified that these returned to prestimulation levels prior to collecting further data. Typically, thresholds were elevated by no more than 5 dB immediately after DPT stimulation, and recovered to prestimulation levels within 2 to 3 min. During a 2–3-day single-unit experiment, the total DPT exposure was less than 3 h.
Possible hair-cell mediated activity (“electrophonic hearing”) may also complicate the interpretation of ANF responses to electric stimulation. Hair cell function may not have been completely eliminated by the combined effects of the acute deafening protocol and the mechanical trauma caused by electrode insertion into the cochlea. To mitigate the effects of remaining hair cells, only units lacking sustained spontaneous activity are included in this report. Depending on the animal, between 0% and 30% of the units were rejected based on this criterion. In one animal with particularly large residual acoustic responses, an additional five units were eliminated because they responded to acoustic clicks delivered to the implanted ear.
D. Identification of vestibular responses
Both the auditory nerve and the vestibular nerve pass through the internal auditory meatus. The border between the vestibular and the auditory nerve can usually be visualized from our dorsal view (Kiang et al., 1965). Stereotaxic and neurophysiological criteria have been developed in our laboratory to identify vestibular nerve fibers (Liberman and Kiang, 1978) (see below). These criteria were only strictly adopted in later experiments. Consequently, some of the recordings from the earlier experiments may be from vestibular fibers. This issue is discussed in Sec. III E.
To quantitatively assess the possible influence of vestibular recordings on results of the earlier experiments, we deliberately recorded from both vestibular and auditory-nerve fibers in some experiments. The recording microelectrode was oriented 45° from the horizontal plane and 10°–15° medio-lateral from the sagittal plane (Liberman and Kiang, 1978). We labeled a fiber as vestibular if three conditions were met: (1) the point of entry of the electrode was anterior to the border between the vestibular nerve and the auditory nerve; (2) the depth of the electrode was less than 1 mm from the nerve surface; and (3) a unit with regularly firing spontaneous activity was found deeper in the nerve. Since only vestibular units have regular spontaneous activity, detection of regular spontaneous activity is an unambiguous indication that the electrode is in the vestibular nerve, and not in the auditory nerve beneath (Walsh et al., 1972). A fiber was labeled as acoustic if either the point of entry of the electrode was posterior to the auditory/vestibular nerve border, or the fiber was at least 1 mm from the nerve surface and no regular vestibular unit was found deeper (we always looked at least 0.3 mm deeper). Neurons that could not be classified as either vestibular or acoustic were excluded from analysis.
E. Data analysis
Both average discharge rates and, for unmodulated DPTs, temporal discharge patterns were analyzed. Peri-stimulus time (PST) histograms were constructed by computing the average discharge rate in successive 1-s windows as a function of time following DPT onset. For unmodulated DPTs, temporal discharge patterns were analyzed using interspike interval histograms and tests of serial dependence between intervals. Because the tails of interspike interval distributions and measures of serial dependence are highly sensitive to deviations from stationarity, selecting a response window over which the discharges behave in a manner consistent with stationarity is critical for these analyses (Kelly et al., 1996). In practice, we used an ad hoc statistical criterion for identifying a window over which the discharge rate is nearly constant. Specifically, a response window was accepted as stationary if the slope of the regression line to that portion of the PST histogram was “well within” the distribution of slopes computed from random spike sequences having the same length and same interspike interval distribution as the data. By “well within,” we mean that the slope had to be smaller in absolute value than 30% of the slopes expected for a random sequence of spikes. This 30% criterion leads to rejection of 70% of the records from the random sequence, and is therefore very stringent.
For each recorded response to the DPT, the stationary time window was determined by beginning with the entire data record, and iteratively decreasing the window size by 10 s on the left, and 2 s on the right, until the window passed the stationarity test. In practice, small windows were selected for responses that slowly adapted throughout DPT stimulation, while larger windows were selected for units that discharged at a nearly constant rate after initial adaptation. The window size was 150 s on average, and ranged from 5 to 500 s across fibers.
III. Results
A. DPT level selection
To assess the sensitivity of the auditory nerve to electric stimulation, ECAPs were measured by averaging responses to 30 biphasic pulses (25 μs/phase) which alternated in polarity. Figure 2 shows the peak-to-peak ECAP amplitude as a function of pulse level for three animals. These curves were chosen to illustrate interanimal variability. All animals showed a segment of rapid ECAP growth at low stimulus levels. As the level increased further, the rate of growth slowed in two of the three animals, suggesting that fewer fibers were recruited by similar increments in pulse level. Assuming that the distribution of fiber thresholds is bell-shaped, levels where the ECAP nearly saturates probably stimulate a large percentage of the fibers in the auditory nerve. Whenever possible, these levels were chosen for the DPT (arrows). In some animals (such as lml13), the stimulus produced facial twitches before the ECAP saturated. In these cases, a DPT level just below the twitch threshold was selected. The DPT levels used in the ten experiments ranged from – 1 to 8 dB re: 1 mA, with a median of 6 dB (Table I).
FIG. 2.

ECAP growth curves and DPT levels for three cats. Each point represents the peak-to-peak ECAP amplitude evoked by an alternating, biphasic pulse presented at a rate of 15/s. In most animals, the DPT level (arrow) was chosen to be roughly 1 dB below the “knee,” where the ECAP growth curve begins to saturate. In animals where a knee was not apparent (e.g., lml13), DPT level was set at the highest stimulus level that did not evoke a facial twitch.
B. Time course and distribution of discharge rate evoked by the DPT
Our results are based on 170 data records obtained from 138 auditory-nerve fibers in ten cats. None of these fibers had spontaneous activity, and, if tested, none responded to click sounds. The data set includes 46 responses to unmodulated DPTs and 124 responses to partially modulated DPTs (for which only the unmodulated segments were analyzed in the present paper). In most cases (143 records), responses to the DPT were recorded for at least 2.5 min; in the 27 remaining cases, the fiber stopped responding after less than 2.5 min of DPT stimulation, and the record was not used further except to note that the response completely adapted.
Figure 3 shows the discharge rate as a function of time from the onset of an unmodulated, 1 mA peak DPT for seven auditory-nerve fibers from one cat. While initially the discharge rates could be very large (exceeding 700 spikes/s for some fibers), they decreased considerably over the course of DPT stimulation. Five units showed rapid adaptation over the first 100 s of stimulation, followed by either slower adaptation or a steady response. Two other units completely stopped discharging after 1–2 min of DPT stimulation.
FIG. 3.

Discharge rate as a function of time from the onset of the DPT stimulus for 7 units from one animal (lml16). The stimulus was a 10-min, 5-kpps electric train of biphasic pulses presented at 1 mA 0-p. Rate was estimated over successive 1-s windows.
Figure 4 shows the discharge rate distribution after 100 s of DPT stimulation for all fibers that initially responded to the DPT at the standard level. In this figure, responses to unmodulated pulse trains are pooled together with responses during the unmodulated parts of the partially modulated pulse trains. The solid line is the cumulative distribution of discharge rates evoked by the DPT. The dashed line is the cumulative distribution of spontaneous discharge rates in four healthy ears (Liberman, 1990). Discharge rates in response to the DPT vary over a wide range, as do spontaneous rates. However, the rate distribution for the DPT differs from that for spontaneous activity in that (1) a larger proportion (46% vs. 17%) of units respond to the DPT with discharge rates below 5 spikes/s, including the 26% that stopped discharging after 100 s of stimulation, and (2) about 13% of the units respond to the DPT at higher discharge rates (>122 spikes/s) than any spontaneously responding unit. Overall, given the large differences in thresholds and the narrow dynamic ranges for responses to short electric stimuli (van den Honert and Stypulkowski, 1984; Javel et al., 1987; Miller et al., 1999; Litvak et al., 2001), the discharge rate distribution for the DPT is surprisingly similar to that for spontaneous activity.
FIG. 4.

Discharge rate distributions for spontaneous activity and DPT-evoked responses. The black vertical bars represent a histogram (bin width 2.5 spikes/s) of the discharge rates in response to the DPT. For each unit, the discharge rate was averaged from 100 to 130 s after stimulus onset. Only responses to the DPT presented at the standard level in each animal (Table I) are included, and each ANF is included only once, even if multiple data records are available. The black line shows the cumulative distribution of discharge rates to the DPT. The dashed line shows the cumulative distribution of spontaneous discharge rates from four healthy ears (Liberman, 1990).
Figure 5 shows that nearly all units with thresholds within 2 dB of the standard DPT level either stopped responding to the DPT, or responded at a very low discharge rate (<20 spikes/s). In contrast, the discharge rates of units with thresholds more than 2 dB below the DPT level varied widely from 0 to over 300 spikes/s. Although the mean discharge rate correlates negatively with threshold [R = −0.41, p<0.001, permutation test for correlation (Good, 2000, p. 46)], there is considerable variability in discharge rates among units that have a given threshold. For example, fibers with thresholds 4 dB below DPT level had sustained discharge rates ranging from 0 to over 200 spikes/s. This wide range of discharge rates among units having similar thresholds is a consistent finding across animals.
FIG. 5.
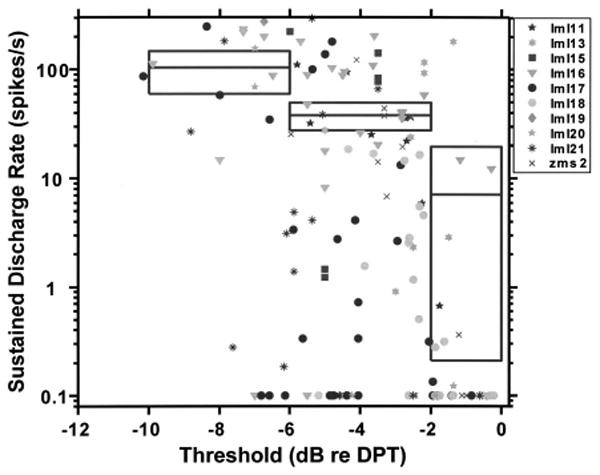
Average discharge rate 100–130 s after DPT onset as a function of fiber threshold. To allow comparisons across experiments, threshold is expressed relative to DPT level. Data from ten cats are coded by different symbols. The horizontal lines show the mean discharge rate for fibers that have thresholds in the range represented by the horizontal extent of each line. Boxes around each line represent the 99% confidence interval for the mean discharge rate estimate. The confidence intervals were computed using the bootstrap method (Efron and Tibshirani, 1993).
The cross-fiber differences in sustained discharge rates might reflect differences in the status of residual hair cells. The degree to which hair cells were affected by the drug protocol was assessed by measuring click-evoked CAP thresholds in the non-implanted ear. Figure 6 shows the sustained discharge rate to the DPT against the CAP threshold in the non-implanted ear. To be included in the plot, the CAP threshold had to be measured within 5 h of the single-unit recordings. This 5-h criterion was chosen based on the slow rate of increase in CAP threshold over the course of the experiment, which had a time constant of 12–24 h. Because CAP thresholds were measured sporadically, the number of units in this figure is smaller than in Figs. 4 and 5. Regression analysis revealed no significant correlation between CAP threshold and discharge rate to the DPT (p = 0.94, permutation test for correlation). Moreover, there was a large variability in discharge rates even among fibers from nearly deaf animals (CAP thresholds >10 dB re: 1 V, about 110 dB peak SPL). Thus, the results suggest that hearing status alone cannot account for the differences in DPT-evoked discharge rates across fibers.
FIG. 6.

Sustained discharge rate of individual fibers in response to the DPT as a function of the residual hearing status of the animal. Hearing status was assessed by the click-evoked CAP threshold in the non-implanted ear. To be included in this figure, a record had to meet three criteria: (1) the DPT was presented at the standard level for each animal (Table I), (2) single-pulse threshold was at least 2 dB below DPT level, and (3) a CAP threshold was measured within 5 h of the single-recordings. Because the CAP threshold changed slowly over the course of an experiment, data from one cat may be represented at several horizontal positions in this figure. Animals with CAP thresholds above 10 dB re: 1 V had no detectable residual hearing.
C. Temporal discharge patterns
The temporal discharge patterns in response to unmodulated DPTs were analyzed quantitatively and compared to temporal patterns of spontaneous activity in healthy ears. This analysis was performed for a time window over which the response was determined to be approximately stationary using a statistical algorithm described in Sec. II D. To ensure that histogram estimates would be reliable, the stationary window had to contain at least 2000 spikes for a record to be used in this analysis. Twenty-nine records met this criterion.
1. Interspike interval histograms
First-order interspike interval histograms (IH) for spontaneous activity in a healthy ear are nearly exponential for intervals exceeding the refractory period (Kiang et al., 1965), as would be expected for a Poisson process. In contrast, responses to the DPT during the stationary window exhibited a variety of IH shapes illustrated in Fig. 7. The top row shows the IH for intervals between 0 and 20 ms, while the middle row shows the same histogram on a logarithmic vertical scale where an exponential histogram would appear as a straight line. The time scale is adjusted in each panel to include all the intervals for that record.
FIG. 7.

Characterization of temporal discharge patterns in response to the DPT for four auditory-nerve fibers. The top row shows the first 20 ms of the interspike interval histograms (IH) computed with a fixed 200-μs bin width. The second row shows the entire interval histogram on a logarithmic vertical scale. To accommodate different average discharge rates, the bin width is adjusted so that each bin contains exactly 50 intervals. The histograms in the top two rows are normalized to represent the interval probability density function in spikes/s. The bottom row shows the conditional mean interval length as a function of the preceding interval (solid line) using the same bins as in the second row. The plot also shows 99% confidence intervals for the conditional mean interval assuming that the intervals show no serial dependence.
Seven of the 29 data records (24%) exhibited a nearly exponential IH, like most spontaneously responding fibers in a healthy ear (left column). Another eight records (28%) exhibited one or more interval modes below 10 ms, followed by a nearly exponential tail (second column from left). Both patterns have been reported previously for brief (250 ms) stimulation with high-rate pulse trains (Litvak et al., 2001). A third type of response found in 14 records (48%) consisted of one or several modes below 10 ms followed by a nonexponential tail beyond 20 ms (two right-most columns). The rightmost interval histogram corresponds to a “bursting” response. In this case, bursting was regular, with a repetition period near 60 ms reflected as a mode of the IH.
A formal definition of interval histogram type was developed based on a metric called the interval-histogram exponential shape factor (IH-ExpSF) (Litvak et al., 2001). The IH-ExpSF test was separately applied to both the initial histogram segment (extending from the largest mode to 20 ms) and the histogram “tail” extending from 20 ms to the largest interval.1 For each of these two segments, the IH-ExpSF was computed by first fitting the data with both a single exponential and, piecewise, with three exponentials. For the piecewise fit, the data were partitioned so that each piece contained an equal number of intervals in order to make the fit equally reliable for each piece. We computed the root mean squared (rms) error of each fit to the data, and defined the IH-ExpSF as the ratio of the rms error for the piecewise fit to that for the single exponential fit. The IH-ExpSF for samples from a Poisson process is approximately 1. A histogram segment was labeled as nonexponential if its IH-ExpSF was smaller than 99% of the IH-ExpSFs computed from simulated samples of a Poisson process having both the same number of spikes and the same average discharge rate as the data.
A Type IA histogram is one that was classified as exponential by the IH-ExpSF test over both the initial segment and the tail (e.g., Fig. 7, left). Type IB histograms are exponential in the tail, but not in the initial segment (e.g., Fig. 7, second from left). Type II histogram are not exponential in the tail (e.g., Fig. 7, two rightmost fibers).
Responses with histograms of Type IA tend to have lower discharge rates than Type IB and II responses. The difference in the mean discharge rates between IA histograms and the other responses is highly significant [p = 0.0095, permutation test (Good, 2000, p. 37)]. The differences between the mean discharge rates of Type IB and Type II responses are not significant. The dependence of IH type on average discharge rate suggests the type may also correlate with stimulus level and sensitivity.
Both Type IB and II responders occurred in deaf preparations (CAP threshold >0 dB) as well as in those with residual hearing. Although exponential (Type IA) interval histograms were seen exclusively in deaf preparations, in only two units were measurements of DPT responses that showed IA interval histograms made sufficiently close in time to a click-evoked CAP to make the comparison useful. Thus, residual hearing does not seem to account for the nonexponential response types.
2. Serial dependence between intervals
Spontaneously responding ANFs in a healthy ear show little dependence between successive interspike intervals (Kiang et al., 1965; Lowen and Teich, 1992); consequently, they can be approximately described as a renewal process (Cox, 1967). A formal test of serial dependence is the conditional mean test (Rodieck et al., 1962; Johnson, 1996). First, the mean interval is computed as a function of the previous interval. Next, it is determined whether this mean is significantly dependent on the previous interval.
The bottom row of Fig. 7 illustrates the conditional mean test for four units. For each unit, the solid line shows the mean interval as a function of the previous interval. The dashed lines show 99% confidence intervals for the mean interval assuming that there is no serial dependence between intervals. These confidence intervals were obtained by repeatedly shuffling the intervals and recomputing the conditional mean interval. A record would fail the test (p<0.01) if the mean interval exceeded the confidence intervals more than three times for each 100 points. With this criterion, the two left records pass the test, while the two right records fail.
About 60% (18/29) of the DPT responses showed a marked dependence of the mean interval on the previous interval, with a tendency for shorter intervals to follow longer ones (e.g., Fig. 7, bottom row, two right-most plots). The results of the conditional mean test were strongly correlated with the interval histogram type (Table II). Of the six records that had Type IA interval histograms, only one failed the conditional mean test, while all the Type II responders failed the test. The results were nearly split for Type IB responders.
TABLE II.
Conditional mean test results as a function of interval histogram type.
| IH type | Conditional mean test | |
|---|---|---|
| No. passed | No. failed | |
| IA | 6 | 1 |
| IB | 5 | 3 |
| II | 0 | 14 |
D. Simultaneous recordings from pairs of fibers
Simultaneous recordings of spontaneous activity from pairs of auditory nerve fibers show no evidence for cross-fiber correlation in spike times (Johnson and Kiang, 1976). To assess the degree of cross-fiber correlation with DPT stimulation, we simultaneously recorded responses to a DPT from pairs of fibers, and computed the cross-correlation histograms (Perkel et al., 1967). This analysis was performed over a segment in which both responses were judged to be stationary. We examined lags up to ±40 ms at a resolution of 200 μs so that any correlation related to the 200-μs period of the stimulus would average out. An example cross-correlation histogram is shown in Fig. 8. The histogram appears flat, suggesting no significant correlation between the two fibers.
FIG. 8.

Cross-correlation histogram (bin width 200 μs) in response to the DPT for a pair of fibers recorded simultaneously. The dashed line marks the 99% confidence interval based on the null hypothesis that the two spike trains are uncorrelated. The X indicates a crossing of the confidence interval. Because there are 400 bins, about four crossings are expected on average under the null hypothesis.
A statistical test was devised to determine whether fluctuations in the cross-correlation histograms are within limits of statistical variability. For each fiber pair, a 99% confidence interval was established by randomly shuffling the interspike intervals in each record 100 times and computing the cross-correlation histogram for each shuffle. Because shuffling is performed independently for each fiber in the pair, the resulting spike times are guaranteed to be uncorrelated. Under the null hypothesis, we expect the cross-correlation histogram to cross the confidence intervals on average four times. More than eight crossings would cause the uncorrelated response hypothesis to be rejected (p<0.01). The pair in Fig. 8 showed only one crossing, and therefore passed the correlation test.
We failed to detect any significant correlation in all four pairs from which we recorded (Table III). This result, which resembles that found by Johnson and Kiang (1976) for spontaneous activity, is consistent with responses to the DPT being statistically independent from fiber to fiber.
TABLE III.
Number of times that the cross-correlation histogram between spike trains simultaneously recorded from two fibers crosses the 99% confidence interval.a
| Data record | Record duration (s) | No. of spikes | No. of crossings |
|---|---|---|---|
| lml13-87-2a | 10 | 3069 | 5 |
| lml13-87-2b | 1799 | ||
| lml13-88-3a | 10 | 2721 | 7 |
| lml13-88-3b | 2953 | ||
| lml13-89-2a | 60 | 5013 | 3 |
| lml13-89-2b | 1118 | ||
| zms2-3-2a | 200 | 40 158 | 4.2b |
| zms2-3-2b | 85 724 |
To avoid effects of slow adaptation in discharge rate that occurred for both fibers in Record zms2-3-2, the test was applied separately to ten consecutive 20-s data windows. This segmentation was predicated by applying the test to simulated spike trains from two independent, slowly adapting, Poisson processes. Both the average rate and the rate of adaptation of the simulated spike trains were matched to those in zms2-3-2. Although these spike trains were statistically independent by construction, the cross-correlation test failed for windows longer than 20 s. Because simulated spike trains did pass the test when there was no adaptation, we assume that adaptation is responsible for this failure.
Average number of crossings for ten consecutive 20-s windows of data.
E. Vestibular responses
Some of the recordings described in the previous sections may have come from vestibular fibers lacking spontaneous activity (Walsh et al., 1972). Vestibular responses to electric stimulation of the cochlea have been reported (Hartmann et al., 1984; Shepherd and Javel, 1997). To address this issue, we deliberately recorded from both vestibular and auditory fibers in some experiments to determine how the two differ in their responses to the DPT.
Fibers identified as vestibular based on stereotaxic and physiological criteria often responded spontaneously. Discharge patterns for these units were similar to those encountered in a healthy ear, and included both regular and irregularly discharging responses (Walsh et al., 1972). In addition, some vestibular fibers did not respond spontaneously and were detected only because they responded to the search stimulus.
Vestibular fibers with spontaneous activity had high thresholds to biphasic electric pulses. For 70% of the vestibular fibers that we contacted, threshold was higher than the standard DPT level for that animal. However, some vestibular fibers were easily excited by electric stimulation. One fiber's threshold was 7.5 dB below the DPT level. These results are consistent with previous reports of vestibular fibers with low thresholds to electric stimulation of the cochlea (Hartmann et al., 1984; Shepherd and Javel, 1997).
Figure 9 shows that the time course of adaptation of responses to the DPT in vestibular fibers with zero spontaneous rate usually differs from that in auditory fibers. Of the five vestibular fibers, four (solid black lines) adapted more slowly during the first 50 s of DPT stimulation than did any auditory fiber. For one vestibular unit, however, the adaptation was unremarkable when compared to that of auditory-nerve fibers (dashed black line).
FIG. 9.

Average discharge rate as a function of time from DPT onset for both auditory fibers (gray, dotted) and non-spontaneously-active vestibular fibers (black). The inset shows the initial discharge rate (from 0 to 15 s after DPT onset) versus the adapted discharge rate (from 50 to 75 s) for both auditory (gray) and vestibular (black) fibers. For four out of five vestibular fibers, the adapted discharge rate is more than 0.56 times larger than the initial discharge rate (dashed line). A sixth vestibular fiber had a nearly zero rate. In contrast, all the auditory fiber data lie below the dashed line. The solid black line in the inset shows where the rate after 50 s equals the initial discharge rate. Units whose responses fall on this line would show no adaptation.
The inset plots the rate after 50 s of DPT stimulation against the initial discharge rate for both vestibular (black) and auditory (gray, dotted) units. For five of the six vestibular fibers, the discharge rate at 50 s was greater than that in any auditory fiber when normalized by the initial rate. The dashed straight line representing a 0.56 ratio of the discharge rate at 50 s to the initial rate almost completely separates auditory from vestibular units. This ratio criterion was applied to data from earlier experiments to determine which of these units might be vestibular. Only 15% of the records were labeled as vestibular by this criterion. None of the conclusions of the earlier analyses would be changed if these records were excluded from analysis, and this is also true even if 30% of the unclassified units with the lowest adaptation rates are excluded.
F. Recovery of evoked responses from DPT stimulation
To reliably evoke a sustained discharge rate in an ANF, the DPT level must exceed the single-pulse threshold by at least 2 dB (Fig. 5). Consequently, only high-level DPTs can evoke sustained responses in a large number of fibers. The influence of such intense DPTs on subsequent evoked responses was investigated methodically in two cats after completion of the single-unit recordings. Because the results were similar in both cats, we focus on results from one experiment. This cat had little residual hearing (click-evoked CAP threshold of 2 dB re: 1 V, about 102 dB peak SPL) in the non-implanted ear at the time that the conditioning experiment was undertaken.
Figure 10 shows the peak-to-peak ECAP amplitude as a function of time for five different probe levels (0, 2, 4, 6, and 8 dB re: 1 mA 0-p). In between these ECAP measurements, the auditory nerve was stimulated with a conditioning pulse train presented at 6 dB re: 1 mA. The rate and the duration of the conditioning pulse train were systematically varied.
FIG. 10.

ECAP amplitude for a probe pulse stimulus as a function of time for one experiment (zms2) in which various conditioning stimuli were applied. Symbols indicate probe levels in dB re: 1 mA 0-p. The gray areas mark times during which a 6-dB re: 1 mA conditioning pulse train was presented and no ECAP measurements were made. The pulse rate and duration of the conditioning stimulus are indicated inside the gray areas.
As a control, ECAPs were first measured over a course of 2 h without a conditioning stimulus, and found to be stable within ±0.25 dB. Next, a 125-pps conditioning pulse train was applied for 10 min. This low-rate pulse train is representative of carriers used in some CI processors. Evoked responses were measured immediately and repeatedly after the end of the conditioning stimulus. For all probe levels, evoked responses recovered rapidly from this low-frequency stimulation, with the recovery being nearly complete 2 min after the end of the conditioning stimulus.
Next, 10-min conditioning stimuli of 2.5 and 5 kpps were applied. These higher pulse rates are appropriate for a DPT-enhanced strategy. Evoked responses recorded immediately after these stimuli were strongly suppressed, particularly for low-level probes. The response to a 0 dB re: 1 mA probe was completely suppressed. However, the response to an 8-dB probe was not affected by a 6-dB conditioner of either frequency. For all probe levels, responses recovered to near prestimulation level within 5 to 10 min.
Finally, after 1-h stimulation with a 5-kpps conditioner, responses to low-level probes were strongly suppressed. In contrast to the effects of 10-min conditioners, the suppression was long-lasting, with responses recovering only partially 4 h after the end of stimulation. However, remarkably, the response to the 8-dB probe was still not affected by the 1-h DPT.
These results suggest that high-rate electric stimulation lasting an hour or longer may cause long-term shifts in neural excitability. On the other hand, two or three applications of high-frequency pulse trains of 10 min or less separated by recovery periods of 10 min or more seem to cause only temporary shifts in neural thresholds.
IV. Discussion
The goals of introducing a DPT are twofold. The primary goal is to improve the representation of the waveforms of electric stimuli in the temporal discharge patterns of auditory-nerve fibers. We postpone a discussion of stimulus coding until the companion papers (Litvak et al., 2003a, b). The second goal is to elicit a pseudo-spontaneous response in the auditory nerve. Such pseudo-spontaneous activity may be of clinical significance, because lack of spontaneous activity has been suggested as a cause of tinnitus (Kiang et al., 1970). Restoring a form of spontaneous activity on the auditory nerve may reduce or eliminate tinnitus in some patients.
A. Discharge rate distribution and adaptation
A major finding of this paper is that the distribution of discharge rates after 100 s of stimulation by a 5-kpps sustained DPT broadly resembles the distribution of spontaneous discharge rates in a healthy ear. This result is particularly striking given the small dynamic ranges and large differences in thresholds reported for the ANF responses to brief electric stimuli (van den Honert and Stypulkowski, 1984; Litvak et al., 2001). This result is testimony to the profound effect of adaptation on responses to a sustained DPT.
To produce a sustained discharge rate in a fiber over the course of 10 min, the DPT needs to be at least 2 dB above that fiber's threshold. On average, the sustained discharge rate is larger for fibers with low thresholds relative to DPT level. However, fibers with thresholds at least 2 dB below the DPT level show large variability in discharge rates even if they have similar thresholds.
The result that threshold poorly predicts the adapted discharge rate to the DPT is consistent with earlier studies of responses to short, high-frequency electric stimuli. These studies have found that units differ widely in the degree of adaptation to supra-threshold stimuli (Moxon, 1967; van den Honert and Stypulkowski, 1987; Dynes and Delgutte, 1992; Killian, 1994; Litvak et al., 2001). This is true even if the stimulation level is set at a fixed value relative to the threshold of individual fibers (Litvak et al., 2001).
Fiber-to-fiber variability in both adaptation and sustained discharge rate may be related to a difference in the ability of fibers to maintain homeostasis in the face of increasing metabolic demands. One factor that may account for cross-fiber variability in metabolic resources is fiber diameter. Larger fibers may have more metabolic resources per membrane area, and therefore adapt slower to a taxing stimulus such as the DPT. Consistent with this hypothesis, when differences in threshold are controlled for, vestibular fibers, which are larger, adapt more slowly than do auditory fibers. Peripherally, ANF diameters differ by a factor of 2 (Liberman and Oliver, 1984). Interestingly, in a healthy ear, fibers with low spontaneous discharge rates have smaller diameters than high spontaneous fibers. Because smaller fiber diameter may be correlated with both faster adaptation and higher thresholds to electrical stimulation (Rubinstein, 1991), it is possible that many fibers with low spontaneous discharge rates would only respond transiently to a DPT.
B. Temporal discharge patterns
Using a biophysical model of the neural membrane, Rubinstein et al. (1999) predicted that responses to a 5-kpps pulse train would exhibit exponential interval histograms, resembling those of spontaneously active fibers in an intact ear. In our data, only about 25% of the interval histograms computed from DPT responses were strictly exponential (Type IA). Most of the records with exponential interval histograms had discharge rates below 50 spikes/s, and showed no serial dependence from one interval to the next, as revealed by the conditional mean test.
Interval histograms were generally nonexponential for fibers whose discharge rates exceeded 100 spikes/s. We distinguished between two types of nonexponential interval histograms. One (Type IB) was nonexponential in only the first 20 ms, but had an exponential tail. About half of responses associated with this type of histogram showed a serial dependence between successive intervals. Type II histograms were nonexponential in the tail as well as the initial segment. These late deviations in the interval histograms were highly correlated with serial dependence. Bursting was noted in some of these units. The interburst intervals were frequently regular (e.g., rightmost unit in Fig. 7, showing an interburst interval of 60 ms).
Both exponential and nonexponential histograms were previously noted by Litvak et al. (2001) in responses of ANFs to short (<500 ms) electric pulse trains at 5 kpps. These recordings were generally not long enough to distinguish the exponential tails of Type IB responses from the nonexponential tails of Type II responses. Litvak et al. also noted that responses to short, 1-kpps pulse trains were mostly exponential; it is unclear, however, whether exponential interval histograms would also be observed in responses to long-term stimulation at 1 kpps.
Mechanisms that generate the complex interval histograms are not well understood. Random sequences of long and short intervals have been observed in responses to dc stimulation in a squid giant axon (Guttman and Barnhill, 1970; Guttman et al., 1980). These responses can be understood in terms of an interaction between the nonlinear dynamics of the Hodgkin-Huxley model and noise in membrane channels (Schneidman et al., 1998). Although the high-frequency pulses in a DPT stimulus differ from the dc currents used in studies of the squid axon, some parallels may exist between the responses to the two stimuli. Specifically, rectification and low-pass filtering, both of which are known to occur in neural membranes, may transform the extracellular pulse train into an intracellular stimulus with a significant dc component. A model that correctly captures the dynamics of the ion channels in auditory-nerve fibers might accurately predict the Type IB responses of ANFs to high-frequency electric pulse trains.
The complex, Type II interval histograms may be related to processes other than those of ion channel dynamics. One example of such a process is the dynamic maintenance of sodium, potassium, and calcium concentrations in the intracellular and extracellular spaces. Slow oscillations in the concentration of these substances inside the neuron may lead to excitability changes on the scale of several tens of milliseconds, and produce bursting responses. Consistent with this hypothesis, neurons that exhibit complex histograms have higher discharge rates, which may cause greater load on homeostasis, and therefore greater fluctuations in ion concentrations. Intracellular recordings near the stimulating site during DPT stimulation may be required to establish a precise basis for the complex interval histograms.
C. Safe DPT stimulation
Although we only investigated the safety of DPT stimulation in two animals at a single stimulus level, our results do suggest that hour-long stimulation with a suprathreshold DPT may cause long-term threshold shifts in the most sensitive auditory-nerve fibers. This finding is consistent with earlier findings that sustained electric high-frequency stimulation cause long-term threshold shifts in auditory nerve responses (Tykocinski et al., 1995b). However, the threshold shifts that we observed are distinct from those reported for dc stimulation (Tykocinski et al., 1995a), because a dc blocking capacitor was used to filter out any residual dc component of the stimuli. While the threshold shift is not necessarily deleterious in itself, it may indicate permanent damage to the cell that may eventually lead to cell death. Alternatively, over a period of days, the cell metabolism might change and even reverse part of the original shift.
Our data suggests that 10-min stimulation followed by a rest period of 10 min or more might be safe. Therefore, short-term laboratory tests in human cochlear implant subjects to evaluate the effectiveness of the DPT concept may be appropriate. It is interesting that near-threshold, continuous high-frequency stimulation is already used routinely in some cochlear implant devices (Eddington, personal communication). In these devices, the carrier pulse train is at a sub-threshold level even when there is no sound. This stimulation, while safe, is probably at a level well below that required to evoke sustained responses from many auditory-nerve fibers.
In the present study, a strongly supra-threshold DPT was presented on a single intracochlear electrode. The level of the DPT was chosen to stimulate a large fraction of the ANFs. Consequently, the DPT exceeded the threshold of the most sensitive fibers (presumably those that are near the stimulating electrode) by as much as 8 dB. Alternatively, a cochlear implant processor might simultaneously present a DPT on several intra-cochlear electrodes. Each electrode would stimulate only a local population of fibers. This approach may be safer because the DPT level could be lower relative to threshold for most fibers. Alternatively, a cochlear implant processor could temporarily evoke pseudo-spontaneous activity in auditory-nerve fibers by utilizing a DPT that is turned on and off as needed over the course of several minutes. More work is necessary to establish the safety and effectiveness of such fluctuating DPT stimulation.
D. Do responses to a DPT mimic spontaneous activity?
One of the goals of introducing a DPT is to evoke activity on the auditory nerve that mimics spontaneous activity in a healthy ear. This activity may improve the neural representation of electric stimuli superimposed upon the DPT, as well as alleviate some forms of tinnitus.
We found that a majority of the fibers respond in a sustained manner to a DPT presented at a level more than 2 dB above threshold. After 2 min of DPT stimulation, the electrically evoked activity in these fibers exhibited broadly distributed interval histograms, like spontaneous activity. These broad interval histograms suggest that responses are random, and that they may be uncorrelated from one fiber to the next. We directly tested this hypothesis by simultaneously recording from pairs of auditory-nerve fibers during stimulation with a DPT. We failed to detect significant correlations between the responses of any of the four pairs tested.
Despite these broad similarities, DPT-evoked responses differ from spontaneous responses in a healthy ear in several respects. First, a greater proportion of fibers have sustained discharge rates to the DPT below 5 spikes/s compared to the proportion of the fibers that have low spontaneous discharge rates in a healthy ear. In addition, a significant fraction of the fibers respond to the DPT with higher rates than reported for any spontaneously active fiber in a normal ear. Interval histograms also differ in shape from those of spontaneous activity for a majority of sustained responses to the DPT. While spontaneous responses generally have nearly exponential histograms (Kiang et al., 1965), about 75% of the interval histograms for DPT responses were at least partly nonexponential.
While these differences between DPT-evoked responses and spontaneous activity are interesting from a modeling perspective, their functional significance, if any, is unclear. Studies in normal-hearing cats have identified a very small population of spontaneously responding fibers with nonexponential interval histograms that resemble the Type IB histograms in this study (Teich and Khanna, 1985; Gaumond, 1980). Interestingly, these fibers also tend to have high spontaneous rates (Miller and Wang, 1993). Nearly 50% of responses to the DPT have serial correlations between interspike interval that exceed the correlations reported for spontaneously active fibers by a factor of 10. Because, at least on a time scale of 40 ms, the DPT responses appear to be uncorrelated from fiber to fiber, these serial correlations may be of little functional significance for the response of central neurons if these neurons integrate activity across many ANF inputs.
While our experiments suggest that a high-level DPT may introduce pseudo-spontaneous activity on the auditory nerve, psychophysical experiments will be necessary to determine whether implanted subjects can learn to interpret DPT responses as spontaneous activity (i.e., silence). Recent experiments suggest that this is indeed the case (Rubinstein, personal communication). Initial experiments with DPT stimulation also show promise as a tinnitus treatment (Rubinstein et al., 2003).
In summary, stimulation of the auditory nerve with a high-rate pulse train of long duration appears to reproduce many of the essential features of spontaneous activity in about half of the ANFs. In the companion papers (Litvak et al., 2003a, b), we examine whether this pseudo-spontaneous activity improves the representation of electric stimuli superimposed upon a DPT in the temporal discharge patterns of auditory-nerve fibers.
Acknowledgments
The authors would like to acknowledge the tireless efforts of Leslie Liberman without whose surgical skills this work would be impossible, and the assistance of K. M. Brinsko for figure preparation. This work was supported by the W. M. Keck Foundation and NIH Grant Nos. DC00361, DC02258, and N01-DC-6-2100.
Footnotes
Portions of this work were presented as a poster at the ARO Midwinter Meeting in St. Petersburg Beach, FL, 2001 and the CIAP Conference in Monterey, CA, 2001.
Because fibers with very low discharge rates (<50 spikes/s) yielded too few intervals shorter than the 20-ms cutoff, the cutoff was set to the mean interval for these units.
Contributor Information
Leonid M. Litvak, Eaton-Peabody Laboratory and Cochlear Implant Research Laboratory, Massachusetts Eye and Ear Infirmary, 243 Charles Street, Boston, Massachusetts 02114 and Speech and Hearing Bioscience and Technology Program, Massachusetts Institute of Technology, 77 Massachusetts Avenue, Cambridge, Massachusetts 02139.
Zachary M. Smith, Eaton-Peabody Laboratory and Cochlear Implant Research Laboratory, Massachusetts Eye and Ear Infirmary, 243 Charles Street, Boston, Massachusetts 02114 and Speech and Hearing Bioscience and Technology Program, Massachusetts Institute of Technology, 77 Massachusetts Avenue, Cambridge, Massachusetts 02139
Bertrand Delgutte, Eaton-Peabody Laboratory, Massachusetts Eye and Ear Infirmary, 243 Charles Street, Boston, Massachusetts 02114 and Research Laboratory of Electronics, Massachusetts Institute of Technology, 77 Massachusetts Avenue, Cambridge, Massachusetts 02139.
Donald K. Eddington, Cochlear Implant Research Laboratory, Massachusetts Eye and Ear Infirmary, 243 Charles Street, Boston, Massachusetts 02114 and Research Laboratory of Electronics and Neural Prosthesis Research Center, Massachusetts Institute of Technology, 77 Massachusetts Avenue, Cambridge, Massachusetts 02139
References
- Cox DR. Renewal Theory. Methuen; London: 1967. [Google Scholar]
- Duckert LG, Miller JM. Acute morphological changes in guinea pig cochlea following electrical stimulation. A preliminary scanning electron microscope study. Ann Otol Rhinol Laryngol. 1982;91:33–40. doi: 10.1177/000348948209100109. [DOI] [PubMed] [Google Scholar]
- Dynes SBC, Delgutte B. Phase-locking of auditory-nerve discharges to sinusoidal electric stimulation of the cochlea. Hear Res. 1992;58:79–90. doi: 10.1016/0378-5955(92)90011-b. [DOI] [PubMed] [Google Scholar]
- Efron B, Tibshirani R. An introduction to the bootstrap. Chapman and Hall; New York: 1993. [Google Scholar]
- Gaumond RP. PhD thesis. Washington University; St. Louis, MO: 1980. Studies of the stimulus and recovery dependence of cat cochlear nerve fiber discharge probability. [DOI] [PubMed] [Google Scholar]
- Good PI. Permutation Tests: A Practical Guide to Resampling Methods for Testing Hypotheses. Springer-Verlag; New York: 2000. [Google Scholar]
- Guttman R, Barnhill J. Oscillation and repetitive firing in squid axons. Comparison of experiments with computations. J Gen Physiol. 1970;55:104–118. doi: 10.1085/jgp.55.1.104. [DOI] [PMC free article] [PubMed] [Google Scholar]
- Guttman R, Lewis S, Rinzel J. Control of repetitive firing in squid axon membrane as a model for a neuroneoscillator. J Physiol (London) 1980;305:377–395. doi: 10.1113/jphysiol.1980.sp013370. [DOI] [PMC free article] [PubMed] [Google Scholar]
- Hartmann R, Topp G, Klinke R. Discharge patterns of cat primary auditory fibers with electrical stimulation of the cochlea. Hear Res. 1984;13:47–62. doi: 10.1016/0378-5955(84)90094-7. [DOI] [PubMed] [Google Scholar]
- Javel E. Acoustic and Electrical Encoding of Temporal Information. In: Miller JM, Spelman FA, editors. Cochlear Implants. Models of the Electrically Stimulated Ear. Springer-Verlag; New York: 1990. pp. 247–295. [Google Scholar]
- Javel E, Shepherd RK. Electrical stimulation of the auditory nerve. III. Response initiation sites and temporal fine structure. Hear Res. 2000;140:45–76. doi: 10.1016/s0378-5955(99)00186-0. [DOI] [PubMed] [Google Scholar]
- Javel E, Tong YC, Shepherd RK, Clark GM. Responses of cat auditory nerve fibers to biphasic electrical current pulses. Ann Otol Rhinol Laryngol. 1987;128(Suppl):26–30. [Google Scholar]
- Johnson DH. Point process models of single-neuron discharges. J Comput Neurosci. 1996;3:275–299. doi: 10.1007/BF00161089. [DOI] [PubMed] [Google Scholar]
- Johnson DH, Kiang NYS. Analysis of discharges recorded simultaneously from pairs of auditory nerve fibers. Biophys J. 1976;16:719–734. doi: 10.1016/S0006-3495(76)85724-4. [DOI] [PMC free article] [PubMed] [Google Scholar]
- Kelly OE, Johnson DH, Delgutte B, Cariani P. Fractal noise strength in auditory-nerve fiber recordings. J Acoust Soc Am. 1996;99:2210–2220. doi: 10.1121/1.415409. [DOI] [PubMed] [Google Scholar]
- Kiang NYS, Moxon E, Levine R. “Auditory-nerve activity in cats with normal and abnormal cochleas,” in Sensorineural Hearing Loss. CIBA Found Symp. 1970:241–273. doi: 10.1002/9780470719756.ch15. [DOI] [PubMed] [Google Scholar]
- Kiang NYS, Watanabe T, Thomas EC, Clark TF. Discharge Patterns of Single Fibers in the Cat's Auditory Nerve. MIT; Cambridge, MA: 1965. [Google Scholar]
- Killian MJP. PhD thesis. University of Utrecht; 1994. Excitability of the Electrically Stimulated Auditory Nerve. [Google Scholar]
- Knauth M, Hartmann R, Klinke R. Discharge pattern in the auditory nerve evoked by vowel stimuli: a comparison between acoustical and electrical stimulation. Hear Res. 1994;74:247–258. doi: 10.1016/0378-5955(94)90193-7. [DOI] [PubMed] [Google Scholar]
- Liberman MC. Auditory-nerve response from cats raised in a low-noise chamber. J Acoust Soc Am. 1978;63:442–455. doi: 10.1121/1.381736. [DOI] [PubMed] [Google Scholar]
- Liberman MC. Effects of chronic cochlear de-efferentation on auditory-nerve response. Hear Res. 1990;49:209–224. doi: 10.1016/0378-5955(90)90105-x. [DOI] [PubMed] [Google Scholar]
- Liberman MC, Kiang NYS. Acoustic trauma in cats. Cochlear pathology and auditory-nerve activity. Acta Oto-Laryngol. 1978;358(Suppl):1–63. [PubMed] [Google Scholar]
- Liberman MC, Oliver ME. Morphometry of intracellularly labeled neurons of the auditory nerve: Correlations with functional properties. J Comp Neurol. 1984;223:163–176. doi: 10.1002/cne.902230203. [DOI] [PubMed] [Google Scholar]
- Litvak LM, Delgutte B, Eddington DK. Auditory nerve fiber responses to electric stimulation: modulated and unmodulated pulse trains. J Acoust Soc Am. 2001;110:368–379. doi: 10.1121/1.1375140. [DOI] [PMC free article] [PubMed] [Google Scholar]
- Litvak LM, Delgutte B, Eddington DK. Improved temporal coding of sinusoids in electric stimulation of the auditory nerve using desynchronizing pulse trains. J Acoust Soc Am. 2003a;114:2079–2098. doi: 10.1121/1.1612493. [DOI] [PMC free article] [PubMed] [Google Scholar]
- Litvak LM, Delgutte B, Eddington DK. Improved neural representation of vowels in electric stimulation using desynchronizing pulse trains. J Acoust Soc Am. 2003b;114:2099–2111. doi: 10.1121/1.1612494. [DOI] [PMC free article] [PubMed] [Google Scholar]
- Lowen SB, Teich MC. Auditory-nerve action potentials form a non renewal point process over short as well as long time scales. J Acoust Soc Am. 1992;92:803–806. doi: 10.1121/1.403950. [DOI] [PubMed] [Google Scholar]
- Miller CA, Abbas PJ, Robinson BK, Rubinstein JT, Matsuoka AJ. Electrically evoked single-fiber action potentials from cat: responses to monopolar, monophasic stimulation. Hear Res. 1999;130:197–218. doi: 10.1016/s0378-5955(99)00012-x. [DOI] [PubMed] [Google Scholar]
- Miller MI, Wang J. A new stochastic model for auditory-nerve discharge. J Acoust Soc Am. 1993;94:2093–2107. doi: 10.1121/1.407482. [DOI] [PubMed] [Google Scholar]
- Moxon EC. MS thesis. MIT; Cambridge, MA: 1967. Electric stimulation of the cat's cochlea: a study of discharge rates in single auditory nerve fibers. [Google Scholar]
- Parkins CW. Temporal response patterns of auditory nerve fibers to electrical stimulation in deafened squirrel monkeys. Hear Res. 1989;41:137–169. doi: 10.1016/0378-5955(89)90007-5. [DOI] [PubMed] [Google Scholar]
- Perkel DH, Gerstein GL, Moore GP. Neuronal spike trains and stochastic point processes. II. Simultaneous spike trains. Biophys J. 1967;7:419–440. doi: 10.1016/S0006-3495(67)86597-4. [DOI] [PMC free article] [PubMed] [Google Scholar]
- Rodieck R, Kiang NYS, Gerstein GL. Some quantitative methods for the study of spontaneous activity of single neurons. Biophys J. 1962;2:351–368. doi: 10.1016/s0006-3495(62)86860-x. [DOI] [PMC free article] [PubMed] [Google Scholar]
- Rosen S. Temporal information in speech: acoustic, auditory and linguistic aspects. Philos Trans R Soc Lond B Biol Sci. 1992;336:367–373. doi: 10.1098/rstb.1992.0070. [DOI] [PubMed] [Google Scholar]
- Rubinstein JT. Analytical theory for extracellular electrical stimulation of nerve with focal electrodes. II. Passive myelinated axon. Biophys J. 1991;60:538–555. doi: 10.1016/S0006-3495(91)82084-7. [DOI] [PMC free article] [PubMed] [Google Scholar]
- Rubinstein JT, Tyler RS, Johnson A, Brown CJ. Electrical suppression of tinnitus with high-rate pulse trains. Otol Neurotol. 2003;24:478–485. doi: 10.1097/00129492-200305000-00021. [DOI] [PubMed] [Google Scholar]
- Rubinstein JT, Wilson BS, Finley CC, Abbas PJ. Pseudospontaneous activity: stochastic independence of auditory nerve fibers with electrical stimulation. Hear Res. 1999;127:108–118. doi: 10.1016/s0378-5955(98)00185-3. [DOI] [PubMed] [Google Scholar]
- Schneidman E, Freedman B, Segev I. Ion channel stochasticity may be critical in determining the reliability and precision of spike timing. Neural Comput. 1998;10:1679–1703. doi: 10.1162/089976698300017089. [DOI] [PubMed] [Google Scholar]
- Shepherd RK. PhD thesis. University of Melbourne; 1986. Cochlear Prosthesis: Safety Investigations. [Google Scholar]
- Shepherd RK, Javel E. Electrical stimulation of the auditory nerve. I. Correlation of physiological responses with cochlear status. Hear Res. 1997;108:112–144. doi: 10.1016/s0378-5955(97)00046-4. [DOI] [PubMed] [Google Scholar]
- Taylor MM, Creelman CD. PEST: Efficient estimates on probability functions. J Acoust Soc Am. 1967;41:782–787. [Google Scholar]
- Teich MC, Khanna SM. Pulse-number distribution for the neural spike train in the cat's auditory nerve. J Acoust Soc Am. 1985;77:1110–1128. doi: 10.1121/1.392176. [DOI] [PubMed] [Google Scholar]
- Tykocinski M, Shepherd RK, Clark GM. Electrophysiologic effects following acute intracochlear direct current stimulation of the guinea pig cochlea. Ann Otol Rhinol Laryngol Suppl. 1995a;166:68–71. [PubMed] [Google Scholar]
- Tykocinski M, Shepherd RK, Clark GM. Reduction in excitability of the auditory nerve following electrical stimulation at high stimulus rates. Hear Res. 1995b;88:124–142. doi: 10.1016/0378-5955(95)00108-g. [DOI] [PubMed] [Google Scholar]
- Tykocinski M, Shepherd RK, Clark GM. Reduction in excitability of the auditory nerve following electrical stimulation at high stimulus rates. II. Comparison of fixed amplitude with amplitude modulated stimuli. Hear Res. 1997;112:147–157. doi: 10.1016/s0378-5955(97)00117-2. [DOI] [PubMed] [Google Scholar]
- van den Honert C, Stypulkowski PH. Physiological properties of the electrically stimulated auditory nerve. II. Single fiber recordings. Hear Res. 1984;14:225–243. doi: 10.1016/0378-5955(84)90052-2. [DOI] [PubMed] [Google Scholar]
- van den Honert C, Stypulkowski PH. Temporal response patterns of single auditory nerve fibers elicited by periodic electrical stimuli. Hear Res. 1987;29:207–222. doi: 10.1016/0378-5955(87)90168-7. [DOI] [PubMed] [Google Scholar]
- Van Tasell DJ, Soli SD, Kirby VM, Widin GP. Speech waveform envelope cues for consonant recognition. J Acoust Soc Am. 1987;82:1152–1161. doi: 10.1121/1.395251. [DOI] [PubMed] [Google Scholar]
- Van Tasell DJ, Greenfield DG, Logemann JJ, Nelson DA. Temporal cues for consonant recognition: Training, talker generalization, and use in evaluation of cochlear implants. J Acoust Soc Am. 1992;92:1247–1257. doi: 10.1121/1.403920. [DOI] [PubMed] [Google Scholar]
- Walsh BT, Miller JB, Gacek RR, Kiang NYS. Spontaneous activity in the eighth cranial nerve of the cat. Int J Neurosci. 1972;3:221–236. [Google Scholar]
- Wiesenfeld K, Moss F. Stochastic resonance and the benefits of noise: from ice ages to crayfish and SQUIDs. Nature (London) 1995;373:33–36. doi: 10.1038/373033a0. [DOI] [PubMed] [Google Scholar]
- Wilson B, Finley CC, Lawson DT, Zebri M. Temporal representations with cochlear implants. Am J Otol. 1997;18 6:S30–S34. [PubMed] [Google Scholar]
- Wilson BS, Finley CC, Lawson DT, Wolford RD, Eddington DK, Rabinowitz WM. Better speech recognition with cochlear implants. Nature (London) 1991;352:236–238. doi: 10.1038/352236a0. [DOI] [PubMed] [Google Scholar]
- Xu SA, Shepherd RK, Chen Y, Clark GM. Profound hearing loss in the cat following the single co-administration of kanamycin and ethacrynic acid. Hear Res. 1993;70:205–215. doi: 10.1016/0378-5955(93)90159-x. [DOI] [PubMed] [Google Scholar]