Abstract
We introduce a novel high resolution scanning surface confocal microscopy technique that enables imaging of endocytic pits in apical membranes of live cells for the first time. The improved topographical resolution of the microscope together with simultaneous fluorescence confocal detection produces pairs of images of cell surfaces sufficient to identify single endocytic pits. Whilst the precise position and size of the pit is detected by the ion conductance microscope, the molecular nature of the pit, e.g. clathrin coated or caveolae, is determined by the corresponding green fluorescent protein fluorescence. Also, for the first time, we showed that flotillin 1 and 2 can be found co-localising with ~200-nm indentations in the cell membrane that supports involvement of this protein in endocytosis.
Keywords: Caveola, Endocytosis, Fluorescence, Membrane topology, Membrane transport
Introduction
The role of biological cell plasma membrane endocytic pits, e.g. clathrin-coated pits [19] and caveolae [15], has been extensively studied over the last decades and still remains a hot topic. They not only provide cells with a means of transport across the membrane but also work as signalosomes aggregating receptors and ion channels [4, 17]. More recently, another membrane-microdomain-associated protein flotillin (1 and 2), traditionally thought to be associated with various receptors such as insulin receptor [1], has been shown to be responsible for clathrin- and caveolins-independent endocytosis [6], providing an alternative route of trafficking through the cell membrane. Whilst it is well known that clathrin and caveolin form basket-shaped pits in cell membranes [17, 25], the surface structures created by flotillin remain unknown.
Current methods for endocytic pit function and dynamics studies include confocal microscopy, total internal reflection (TIR) microscopy [6, 20, 26], scanning and transmission electron microscopy [25] and atomic force microscopy [5]. Although fluorescence confocal microscopy is the one of the most commonly used microscopy techniques in cell biology, it provides limited information about single endocytic pit due to its lack of resolution. TIR has better vertical resolution and signal-to-noise ratio and has been used for single endocytic event following [2]. However, TIR is limited to observation of events that occur on the basal cell membrane only since it relies on imaging to a depth of about 100 nm from the glass surface and is not applicable to studying apical cell surfaces. In addition, using fluorescence-based microscopy techniques, it is impossible to determine the precise location of the endocytic pit relative to the cell membrane since the membrane position is hard to define.
On the other hand, electron microscopy techniques have more than sufficient resolution and provide much more detailed information about the surface topography than optical images since the cell membrane can be imaged. However, these require fixation and specialised treatments of the cells, which potentially can alter the structure of interest and are thus incompatible with live studies.
Scanning probe microscopy techniques may address a number of these issues by providing topographical data of surfaces. Atomic force microscopy has been used to study cell surfaces but, due to the direct interaction of its probe with the sample, imaging soft and mobile cell surfaces is difficult, limiting most studies to fixed cells or isolated membrane leaflets which are more rigid [5]. Scanning ion conductance microscopy (SICM), which uses a glass micropipette as an imaging probe [9], has no such disadvantage and allows non-contact visualisation of the topography of living cells [13, 14]. This has recently been combined with simultaneous confocal fluorescence imaging, resulting in a new technique—scanning surface confocal microscopy (SSCM) [7]. Also, since its inception, the resolution of the technique has been significantly improved, making it possible to visualise structures as small as protein complexes on surfaces of live cells [23]. This novel technique allows us to identify fluorescence located on the surface of the cell and localise it with topographically observed nanometre-scale structures (unpublished results).
Materials and methods
SSCM
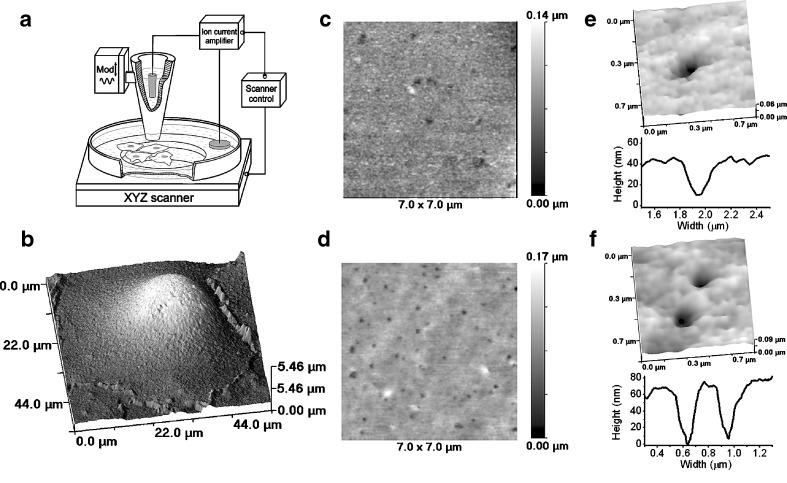
SSCM is based on a combination of SCM and SICM. SICM is a scanning probe microscopy technique[14, 23] in which the ion current flowing into a nanopipette is used to control the vertical (z axis) position of the cell relative to the pipette tip. As shown diagrammatically in Fig. 1a (not to scale), in SSCM, the cell is moved up and down in the z direction while scanning in the x and y directions, so its surface is always the same distance from the nanopipette. A laser is passed up a high numerical aperture objective so that it is focused just at the tip of the nanopipette, and a pinhole is positioned at the image plane so that the confocal volume is just below the pipette, as described [22]. Thus, a fluorescence image of the cell surface is obtained in a single scan, as well as a simultaneously captured image of the cell topography.
Fig. 1.
Topographical imaging of endocytic pits in living cells by SICM. a Schematic diagram of the scanning ion conductance microscope. b SICM topographical image of live Cos-7 cell. c High resolution topographical SICM image of live Cos-7 cell membrane revealing numerous pits. d High resolution topographical SICM image of a fixed Cos-7 cell membrane revealing numerous pits. e Zoomed image showing a single pit (top). Topographical profile of a pit in a live cell (bottom). f Zoomed image showing two pits (top). Topographical profile of pits in fixed cell (bottom)
The SCIM scanning head was developed in collaboration with Ionscope Limited, UK and mounted on a Nikon TE2000-U Inverted Microscope (Nikon Co., Japan). The sample holder was attached to a 100-μm HERA XY Nanopositioning System (Physik Instrumente (PI) GmbH & Co., Germany) used for lateral scanning. Vertical measurement and modulation was provided by 12-μm LISA XY Nanopositioning System (Physik Instrumente (PI) GmbH & Co., Germany). Both piezo stages were mounted on 25-mm translation stage DC motors (Physik Instrumente (PI) GmbH & Co., Germany) to provide coarse lateral and vertical approach. The setups were controlled via a computer with a SBC6711 DSP board equipped with A4D4 ADC/DAC modules (Innovative Integration, USA) using SICM software v. 1.2.00 (Ionscope Limited). The time to acquire a 512 × 512 pixel image was approximately 10 min.
Two types of nanopipettes were used for the experiments. For low resolution images, nanopipettes with internal diameters ~150 nm were pulled from borosilicate glass capillaries. High resolution imaging was made using quartz nanopipettes with internal diameters ~70 nm. The nanopipettes were made from 1.00-mm outer diameter by 0.5-mm inner diameter capillaries with inner filament (Sutter Instrument, USA) using a laser-based Brown–Flaming puller (model P-2000, Sutter Instrument, San Rafael, CA, USA).
The nanopipettes, backfilled with phosphate-buffered saline (PBS) and lowered in PBS, produced a resistance of approximately 300 MΩ for quartz and 100 MΩ for borosilicate pipettes. The maximum ion current measured using an Axopatch 200B (Axon Instruments, USA) was ~0.7 nA for quartz and ~1.5 nA for borosilicate pipettes. The set-point for imaging was 1% of the maximum of modulated ion current.
The excitation light source was provided by a GPNT-02 laser diode (532-nm wavelength, IQ1A 635-nm laser; Power Technology Inc., USA). The optical recording system consisted of a Nikon TE2000-U Inverted Microscope equipped with a ×100 1.3-N.A. oil-immersion objective. The excitation light was fed through an epi-fluorescent filter block and emitted light was collected by a photomultiplier with a pinhole (model D-104-814; Photon Technology International, UK).
Image processing and data analysis
Matching VLP topographical structure to its corresponding fluorescent signal was done as follows: fluorescent confocal images were threshold to subtract the background, and the positions of individual fluorescent spots were marked by arrowheads and the multiple spots (where individual signals could not be resolved) circled. All positional markers were then grouped into one template and placed over the simultaneously recorded topographical image. As the result of this procedure, those topographical features having corresponding fluorescent signals were marked.
Image contrast enhancement included slope correction and high-pass filtration performed similarly as previously described [10, 18]. The slope was calculated and subtracted from images by least squares algorithm [21] resulting in image flattening. A high-pass filter is a filter that passes high frequencies efficiently but reduces frequencies lower than the certain specified (cutoff) frequency. When applied to a 3D image, high-pass filtering results in finer, i.e. high frequency, details to stand out because larger features are eliminated.
Cell culture and plasmids
Monkey Cos-7 cells were routinely maintained at 37°C in 5% CO2, using DMEM (GIBCO/BRL) containing 5% (vol./vol.) FCS. The plasmid DNA used in the experiments were in pCi (Promega) containing either caveolin-green fluorescent protein (GFP), clathrin-GFP, flotillin-1-GFP or flotillin-2-GFP.
Transfection procedure
Cos-7 cells (1 × 10⁶ cells per flask) were plated into a T25 flask and incubated overnight at 37°C in DMEM containing 5% FCS. Cells were washed prior to transfection with PBS, and complexes of Lipofectamine (Invitrogen) and plasmid DNA at a ratio of 1 μl to 1 μg were added in Optimem (Invitrogen) without FCS to the cells. For flotillin transfections, a mixture of flotillin-1- and flotillin-2-GFP plasmids were complexed together and added to the cells. After 2 h, the media was replaced with DMEM containing 5% FCS. After 24 h, the cells were trypsinised and plated onto coverslips (5 × 10⁴ per well) and incubated at 37°C overnight. Cells where then either used for live imaging or fixed for 20 min with 3% formaldehyde containing 5% sucrose.
Results
Imaging of the cell surface using SICM
In order to access the apical surface of Cos-7 cells, we used a basic arrangement of the SICM. A schematic diagram of the microscope is presented in Fig. 1a (not to scale), while a detailed description of the instrument can be found in “Materials and methods” section. SICM [9, 13, 14] is a type of scanning probe microscopy that uses a glass nanopipette as a sensitive probe to acquire a topographical image of the surface. Distance feedback-control is based on the ion current that flows between electrodes in the nanopipette and the bath, and this current is reduced as the pipette approaches the surface. This allows non-contact imaging of live cells in a physiological buffer.
Using the SICM technique, we are able to either examine the morphology of the whole cell or achieve high resolution images of the cell surface. Scanning the complete cell surface gives insight into the number of macrostructures present on the cell surface, for example microvilli, and can be used to probe cell surface dynamics [8]. The morphology of the cell also has an impact on the resolution of SICM images, since large structures and steep slopes make small features difficult to resolve. A typical SICM image of live untransfected (control) Cos-7 cell in physiological conditions is presented in Fig. 1b. Cos-7 cells have very few macrostructures visible on the surface, and although the highest part of the cell membrane above the nucleus (light area, Fig. 1b) generates a steep slope, there are also flat peripheral areas. High resolution scans of these peripheral areas generate images containing a number of indentations of the cell surface (Fig. 1c). Observed indentations range from 50- to 160-nm diameters (see an example in Fig. 1e) and could present endocytic pits formed by clathrin and/or caveolin. The mobility of these indentations was relatively high compared to the present scan rate of our SICM as shown later in the paper; therefore, we used fixed cells to identify particular endocytic pits and imaged them at a higher resolution. A high resolution image of a fixed Cos-7 cell presented in Fig. 1d reveals similar indentations as seen in Fig. 1c but at higher clarity and contrast. A digitally zoomed image is presented in Fig. 1f and shows two pits (top) with the corresponding topographical profiles (bottom).
Scanning surface confocal microscopy
In order to identify what pit indentations detected topographically by SICM corresponded to what endocytic pits, clathrin or caveolin, we transfected Cos-7 cells with corresponding GFP construct and then used scanning surface confocal microscopy to study the transfected cells.
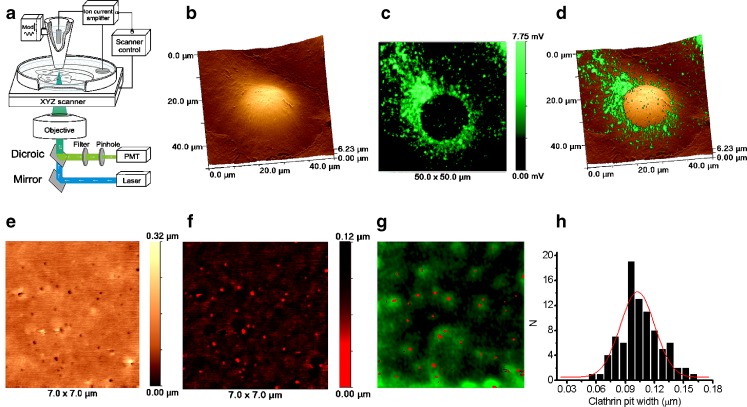
A schematic diagram of the microscope is presented in Fig. 2a (not to scale). Basically, SSCM is a combination of SICM and scanning confocal microscope [7]. SSCM also uses a glass nanopipette to acquire a true topographical image of the surface and a combination of a laser, pinhole and photomultiplier to gather fluorescent information from the cell surface, removing any out-of-focus fluorescence. Because the laser beam is always focused on the very tip of the nanopipette, topographical and fluorescent data are spatially aligned, thus enabling correlation between topographical features and fluorescent signals to be found.
Fig. 2.
Topographical and fluorescent imaging of clathrin coated pits in fixed clathrin-GFP transfected Cos-7 cells by scanning surface confocal microscope. a Schematic diagram of SSCM. b Topographical image of cell. c Fluorescent image of the clathrin-GFP transfected cell shown in b. d 3D representation of overlaid topographical and fluorescent images shown in b and c, respectively. e High resolution topographical image of cell surface revealing numerous clathrin-coated pits. f Same topographical image as in e but inverted and presented in a red palette. g Overlaid inverted topographical and fluorescent images shown in f and g, respectively. The image reveals that the pit topography matches the clathrin-GFP fluorescence. h The distribution of clathrin-coated pit width calculated from the SICM topographical images
Imaging clathrin-coated pits in membranes of fixed cells using SSCM
Cells transfected with clathrin-GFP were scanned, at low and high resolution, to examine the distribution of clathrin-coated pits on the cell surface. A typical topographical image of clathrin-FGP transfected fixed Cos-7 cell, together with its fluorescent image, is presented in Fig. 2b and c, respectively. An overlay of topographical and fluorescent images is shown in Fig. 2d. Peripheral areas of the cell contain punctated GFP fluorescence and had a flat topography. A high resolution topographical scan of these cell surfaces at a 7 × 7-μm scan (Fig. 2e) reveals numerous indentations ranging from 58 to 159 nm with an average depth of 102 nm (see distribution in Fig. 2h).
In order to identify what proportion of the imaged pits were real clathrin-coated pits, we overlaid the topographical and fluorescent data. To make pit indentations that appear as dark spots in topographical images, visible when overlaid with the fluorescence image, the topographical image was inverted and red palette was applied (Fig. 2f). An overlaid, inverted topography red palette and clathrin-GFP fluorescence image is presented in Fig. 2g. As can be seen, there is a ‘cloud’ of green fluorescent signal around almost every single red spot that corresponds to indentations in the topography, giving a high degree of co-localisation between these structures and fluorescent puncta. Therefore, we can conclude that the majority of observed indentations are clathrin-coated pits. Analysis of the images revealed that 102 out of 115 (88.7%) detected endocytic pits co-localised with clathrin-GFP fluorescent spots. Presumably, this is because we are also detecting other types of pits that are not clathrin-coated. Reverse analysis showed that 11 out of 113 (9.7%) detected clathrin-GFP fluorescence spots did not match pit indentations. This could reflect the fact that clathrin-coated pits become highly mobile and move away from the surface inside the cell as soon as they bud off the cell membrane [16]. At higher magnification, we could also see clustering of the clathrin-coated pits in round patches (data not shown) that is similar to observations made by Frankel et al. [5].
Imaging caveolae in membranes of fixed cells using SSCM
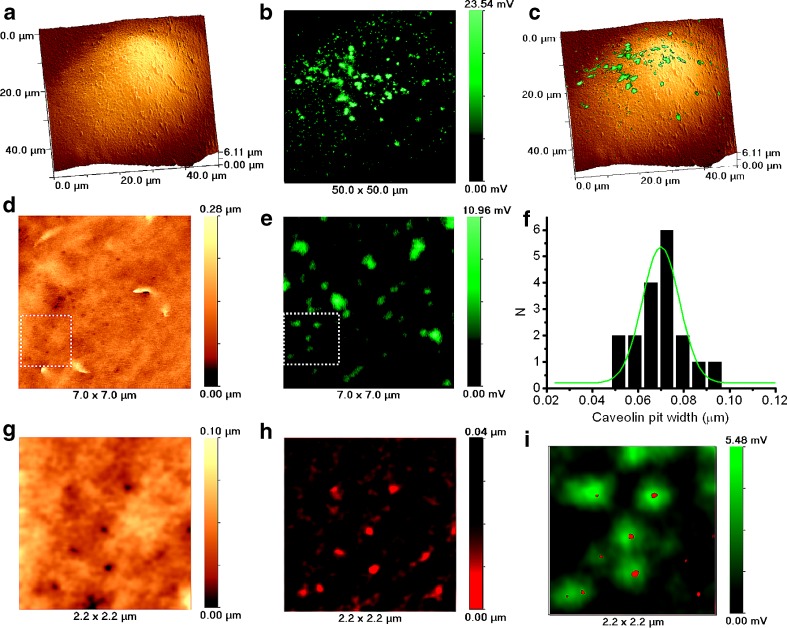
Using SSCM, the surface of caveolin-GFP transiently transfected cells was then examined. Low resolution topographical, fluorescent and overlaid images are presented in Fig. 3a,b and c, respectively. Higher resolution studies (Fig. 3d and e) revealed indentations in the cell membrane. These pits were slightly smaller than the clathrin-coated pits, ranging between 52 and 90 nm and giving a mean depth of 69 nm (see distribution in Fig. 3f).
Fig. 3.
Topographical and fluorescent imaging of caveolin pits in fixed caveolin-GFP transfected Cos-7 cells by SSCM. a Topographical image of cell. b. Fluorescent image of caveolin-GFP transfected cell shown in a. c 3D representation of overlaid topographical and fluorescent images shown in a and b, respectively. d High resolution topographical image of cell surface. e High resolution fluorescent image of caveolin-GFP transfected cell shown in d. f Caveolin pit width distribution histogram calculated from SICM topographical images. g Digital zoom of the topographical image shown in d (dotted square) revealing numerous caveolin pits. h Same zoomed topographical image as in g but inverted and presented in a red palette. i Overlaid inverted topographical image shown in h and digitally zoomed fluorescent image from the area shown in e (dotted square). The image reveals that pits match the caveolin-GFP fluorescence
On closer examination using digitally zoomed images [topographical (Fig. 3g), topographical inverted and in red palette (similar to one described for clathrin) (Fig. 3h) and an overlay of the topography and fluorescence image (Fig. 3i)], it could be seen that the indentations in the cell surface co-localise with fluorescent signal. However, compared to clathrin-coated pits, identification of caveolae is more problematic. In all experiments conducted, the fluorescent images have a punctate appearance. However, in only two out of 26 experiments did fluorescence and structure co-localise. In those experiments, 139 pits were observed on the cell surface and only 13 of them (9.35%) were identified as matching caveolin-GFP fluorescent signal. This is in good agreement with the previous measurement that 90% of the pits identified in the topographic image on the cell surface are clathrin-coated and indicates that the other 10% are caveolae.
Our observation that we detect many fluorescence spots from caveolin-GFP that do not correspond to pits in the SICM image suggests that many caveolae are below the cell surface or present on the surface but not resolvable. By transmission electron microscopy, they have been identified as 50–100 nm in size [15]; however, this is often the size of the whole structure, with the neck being much smaller [25]. It has even been suggested that there is a proteinaceous cap covering the neck of the caveolae [25]. If this is the case, and the cap could influence the flow of ions, then we would not be able to image caveolae structures on the cell surface unless the cap is open.
Imaging flotillin in membranes of fixed cells using SSCM
To our knowledge, flotillin 1 and 2 has not been yet associated with cell membrane structure that could be detected topographically by any microscopy technique. However, it has been shown that this protein is present in lipid rafts [1] and is responsible for clathrin- and caveolin-independent endocytosis [6]. Here, we examined Cos-7 cells transfected with flotillin 1 and 2 by SSCM for the presence of topographically detectable membrane features that could potentially co-localise with flotillin-GFP fluorescent signal.
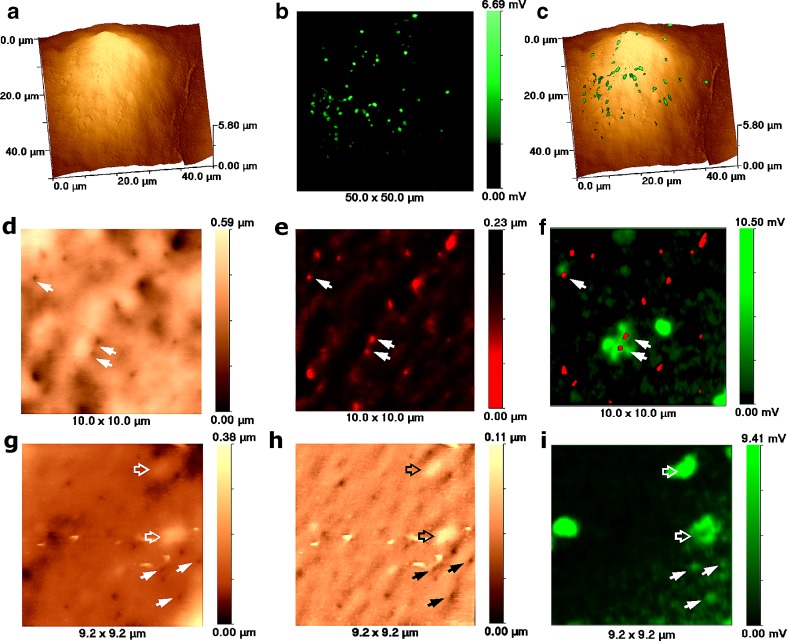
Low resolution topographical and confocal images together with overlaid image of flotillin-GFP-transfected Cos-7 cells are presented in Fig. 4a,b and c, respectively. Higher-resolution topographical images of the cell surface (Fig. 4d and g) revealed 200 ± 20-nm indentations. Figure 4e presents inverted red palette topographical image of Fig. 4d. Inverted red palette topography and fluorescence overly reveals that some indentations co-localise with the flotillin-GFP fluorescent signal (Fig. 4f, arrows). Remarkably, we have found that larger and higher-intensity fluorescent spots correlated with smooth protrusions from the cell surface (Fig. 4g,h and i, hollow arrows). The image presented in Fig. 4h is a high-pass filtered topographical image of the same data as in Fig. 4g.
Fig. 4.
Topographical and fluorescent imaging of fixed flotillin-GFP transfected Cos-7 cells by SSCM. a Topographical image of cell. b. Fluorescent image of flotillin-GFP transfected cell shown in a. c 3D representation of overlaid topographical and fluorescent images shown in a and b, respectively. d High resolution topographical image of the cell surface revealing numerous indentations. e Same topographical image as in d but inverted and presented in red palette. f Overlaid inverted topographical image shown in e and high resolution fluorescent image of flotillin-GFP acquired from the same area. The image reveals that some indentations on the cell surface match flotillin-GFP fluorescence (white arrows). g High resolution topographical image of cell surface revealing numerous indentations (solid arrows) as well as two protrusions (hollow arrows). h Same topographical image as in g but high-pass filtered. i High resolution fluorescent image of caveolin-GFP transfected cell shown in g. The arrows point to indentations that match flotillin-GFP fluorescence. Hollow arrows point to protrusions that match flotillin-GFP fluorescence
Imaging endocytic pits in membranes of living cells using SSCM
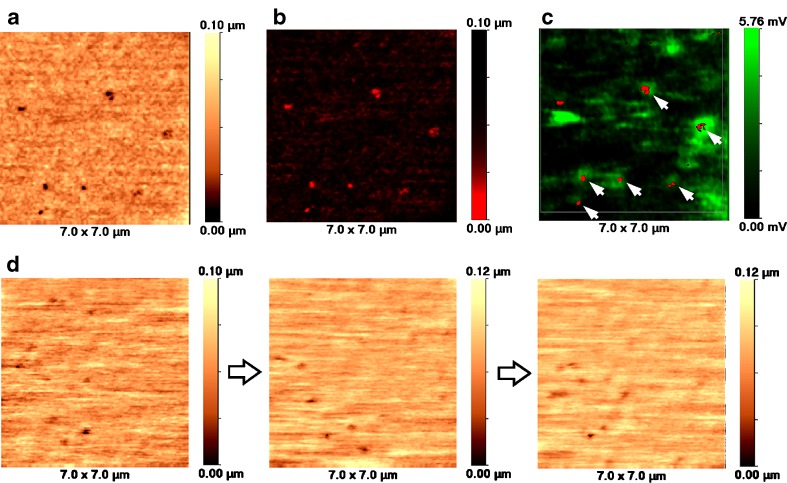
In order to test whether SSCM can identify particular endocytic pits in membranes of live cells, we performed a series of experiments with live clathrin-GFP transfected Cos-7 cells. Figure 5a and b presents normal and inverted red palette topographical images of a live cell. When overlaid with fluorescence, the inverted red palette topography shows that almost all topographically detected pits co-localise with clathrin-GFP fluorescence. There are fluorescence spots that are not round, but elongated in shape that do not match pit indentations on the surface. These spots of fluorescence probably reflect fast-moving clathrin vesicles right under the cell membrane.
Fig. 5.
Live topographical and fluorescent imaging of clathrin coated pits in clathrin-GFP transfected Cos-7 cells by SSCM. a High resolution topographical image of live cell membrane revealing numerous clathrin-coated pits. b. Same topographical image as in a but inverted and presented in red palette. c Overlaid inverted topographical image shown in a and fluorescent image of the same area. The image reveals that, on live cells, we can detect that the pits’ topography match clathrin-GFP fluorescence. d Sequence of topographical images of live cell membrane revealing dynamics of the clathrin-coated pits. The images are separated by 10 min
Figure 5d shows a sequence of three topographical images acquired from the same area of a cell with 10-min intervals. As can be seen, the indentations that correspond to endocytic pits are highly mobile and appear on or disappear from the surface of the cell membrane. It is beyond the current time resolution of our SSCM to follow the dynamics of these pits. However, this is the first time that endocytic pits are resolved topographically on the surface of live cell.
Discussion
By combining high resolution ion conductance imaging of the cell surface topography with fluorescence confocal imaging, we can identify the molecular nature of endocytic pits on the surface of living cells and measure the topography of the pits. For the first time, we showed that flotillin 1 and 2 is involved in the formation of ~200-nm-size indentations in the cell membrane. This observation is important evidence in support of the involvement of this protein in clathrin- and caveolin-independent endocytosis.
We have found on Cos-7 cells that about 89% of the detected pits are clathrin-coated and 9% are caveolae, leaving a small percentage to be presented by flotillin pits. In each particular case, cell preparation transfection could introduce some deviation of clathrin/caveolin/flotillin proportion comparing to untransfected control. The fact that clathrin-coated pit formation is dependent on multiple factors [11, 24] provides indirect evidence that transfection may not influence the amount of pit formation. In contrast, it has been shown that expressing the caveolin in cells that do not contain this protein is enough to form caveolae [3]. However, there are other studies indicating that, although in caveolin transfected cells the total amount of produced caveolin is increased, the concentration of caveolin in the cell membrane remains unchanged [12]. The sizes of the pits we have measured are in good agreement with those obtained by electron microscopy.
We have also shown that it is possible to apply our method to live cells. The clathrin-coated pits show fast dynamics on the time scale of our current imaging but suggest that improvements in the speed of imaging should allow us to follow the dynamics of endocytic pits on living cells with the intriguing possibility of directly imaging the endocytic process in real time.
Acknowlegement
This work was funded by the BBSRC.
Open Access
This article is distributed under the terms of the Creative Commons Attribution Noncommercial License which permits any noncommercial use, distribution, and reproduction in any medium, provided the original author(s) and source are credited.
Footnotes
A. Shevchuk and P. Hobson contributed equally to this work.
References
- 1.Babuke T, Tikkanen R. Dissecting the molecular function of reggie/flotillin proteins. Eur J Cell Biol. 2007;86:525–532. doi: 10.1016/j.ejcb.2007.03.003. [DOI] [PubMed] [Google Scholar]
- 2.Ewers H, Smith AE, Sbalzarini IF, Lilie H, Koumoutsakos P, Helenius A. Single-particle tracking of murine polyoma virus-like particles on live cells and artificial membranes. Proc Natl Acad Sci USA. 2005;102:15110–15115. doi: 10.1073/pnas.0504407102. [DOI] [PMC free article] [PubMed] [Google Scholar]
- 3.Fra AM, Williamson E, Simons K, Parton RG. De novo formation of caveolae in lymphocytes by expression of VIP21-caveolin. Proc Natl Acad Sci USA. 1995;92:8655–8659. doi: 10.1073/pnas.92.19.8655. [DOI] [PMC free article] [PubMed] [Google Scholar]
- 4.Frank PG, Lisanti MP. Caveolin-1 and caveolae in atherosclerosis: differential roles in fatty streak formation and neointimal hyperplasia. Curr Opin Lipidol. 2004;15:523–529. doi: 10.1097/00041433-200410000-00005. [DOI] [PubMed] [Google Scholar]
- 5.Frankel DJ, Pfeiffer JR, Surviladze Z, Johnson AE, Oliver JM, Wilson BS, Burns AR. Revealing the topography of cellular membrane domains by combined atomic force microscopy/fluorescence imaging. Biophys J. 2006;90:2404–2413. doi: 10.1529/biophysj.105.073692. [DOI] [PMC free article] [PubMed] [Google Scholar]
- 6.Glebov OO, Bright NA, Nichols BJ. Flotillin-1 defines a clathrin-independent endocytic pathway in mammalian cells. Nat Cell Biol. 2006;8:46–54. doi: 10.1038/ncb1342. [DOI] [PubMed] [Google Scholar]
- 7.Gorelik J, Shevchuk A, Ramalho M, Elliott M, Lei C, Higgins CF, Lab MJ, Klenerman D, Krauzewicz N, Korchev Y. Scanning surface confocal microscopy for simultaneous topographical and fluorescence imaging: application to single virus-like particle entry into a cell. Proc Natl Acad Sci USA. 2002;99:16018–16023. doi: 10.1073/pnas.252458399. [DOI] [PMC free article] [PubMed] [Google Scholar]
- 8.Gorelik J, Shevchuk AI, Frolenkov GI, Diakonov IA, Lab MJ, Kros CJ, Richardson GP, Vodyanoy I, Edwards CR, Klenerman D, Korchev YE. Dynamic assembly of surface structures in living cells. Proc Natl Acad Sci U S A. 2003;100:5819–5822. doi: 10.1073/pnas.1030502100. [DOI] [PMC free article] [PubMed] [Google Scholar]
- 9.Hansma PK, Drake B, Marti O, Gould SA, Prater CB. The scanning ion-conductance microscope. Science. 1989;243:641–643. doi: 10.1126/science.2464851. [DOI] [PubMed] [Google Scholar]
- 10.Kienberger F, Pastushenko VP, Kada G, Puntheeranurak T, Chtcheglova L, Riethmueller C, Rankl C, Ebner A, Hinterdorfer P. Improving the contrast of topographical AFM images by a simple averaging filter. Ultramicroscopy. 2006;106:822–828. doi: 10.1016/j.ultramic.2005.11.013. [DOI] [PubMed] [Google Scholar]
- 11.Kirchhausen T. Three ways to make a vesicle. Nat Rev Mol Cell Biol. 2000;1:187–198. doi: 10.1038/35043117. [DOI] [PubMed] [Google Scholar]
- 12.Koga A, Oka N, Kikuchi T, Miyazaki H, Kato S, Imaizumi T. Adenovirus-mediated overexpression of caveolin-3 inhibits rat cardiomyocyte hypertrophy. Hypertension. 2003;42:213–219. doi: 10.1161/01.HYP.0000082926.08268.5D. [DOI] [PubMed] [Google Scholar]
- 13.Korchev YE, Bashford CL, Milovanovic M, Vodyanoy I, Lab MJ. Scanning ion conductance microscopy of living cells. Biophys J. 1997;73:653–658. doi: 10.1016/S0006-3495(97)78100-1. [DOI] [PMC free article] [PubMed] [Google Scholar]
- 14.Korchev YE, Milovanovic M, Bashford CL, Bennett DC, Sviderskaya EV, Vodyanoy I, Lab MJ. Specialized scanning ion-conductance microscope for imaging of living cells. J Microsc. 1997;188(Pt 1):17–23. doi: 10.1046/j.1365-2818.1997.2430801.x. [DOI] [PubMed] [Google Scholar]
- 15.Lisanti MP, Scherer PE, Vidugiriene J, Tang Z, Hermanowski-Vosatka A, Tu YH, Cook RF, Sargiacomo M. Characterization of caveolin-rich membrane domains isolated from an endothelial-rich source: implications for human disease. J Cell Biol. 1994;126:111–126. doi: 10.1083/jcb.126.1.111. [DOI] [PMC free article] [PubMed] [Google Scholar]
- 16.Merrifield CJ, Perrais D, Zenisek D. Coupling between clathrin-coated-pit invagination, cortactin recruitment, and membrane scission observed in live cells. Cell. 2005;121:593–606. doi: 10.1016/j.cell.2005.03.015. [DOI] [PubMed] [Google Scholar]
- 17.Mousavi SA, Malerod L, Berg T, Kjeken R. Clathrin-dependent endocytosis. Biochem J. 2004;377:1–16. doi: 10.1042/BJ20031000. [DOI] [PMC free article] [PubMed] [Google Scholar]
- 18.Olin H. Design of a scanning probe microscope. Meas Sci Technol. 1994;5:976–984. doi: 10.1088/0957-0233/5/8/018. [DOI] [Google Scholar]
- 19.Pearse BM. Clathrin: a unique protein associated with intracellular transfer of membrane by coated vesicles. Proc Natl Acad Sci USA. 1976;73:1255–1259. doi: 10.1073/pnas.73.4.1255. [DOI] [PMC free article] [PubMed] [Google Scholar]
- 20.Rappoport JZ, Simon SM. Real-time analysis of clathrin-mediated endocytosis during cell migration. J Cell Sci. 2003;116:847–855. doi: 10.1242/jcs.00289. [DOI] [PubMed] [Google Scholar]
- 21.Savitzkiy A, Golay MJB. Smoothing and differentiation of data by simplified least squares procedures. Anal Chem. 1964;36:1627–1629. doi: 10.1021/ac60214a047. [DOI] [Google Scholar]
- 22.Shevchuk AI, Gorelik J, Harding SE, Lab MJ, Klenerman D, Korchev YE. Simultaneous measurement of Ca2+ and cellular dynamics: combined scanning ion conductance and optical microscopy to study contracting cardiac myocytes. Biophys J. 2001;81:1759–1764. doi: 10.1016/S0006-3495(01)75826-2. [DOI] [PMC free article] [PubMed] [Google Scholar]
- 23.Shevchuk AI, Frolenkov GI, Sanchez D, James PS, Freedman N, Lab MJ, Jones R, Klenerman D, Korchev YE. Imaging proteins in membranes of living cells by high-resolution scanning ion conductance microscopy. Angew Chem Int Ed Engl. 2006;45:2212–2216. doi: 10.1002/anie.200503915. [DOI] [PubMed] [Google Scholar]
- 24.Smythe E. Clathrin-coated vesicle formation: a paradigm for coated-vesicle formation. Biochem Soc Trans. 2003;31:736–739. doi: 10.1042/BST0310736. [DOI] [PubMed] [Google Scholar]
- 25.Stan RV. Structure of caveolae. Biochim Biophys Acta. 2005;1746:334–348. doi: 10.1016/j.bbamcr.2005.08.008. [DOI] [PubMed] [Google Scholar]
- 26.Tagawa A, Mezzacasa A, Hayer A, Longatti A, Pelkmans L, Helenius A. Assembly and trafficking of caveolar domains in the cell: caveolae as stable, cargo-triggered, vesicular transporters. J Cell Biol. 2005;170:769–779. doi: 10.1083/jcb.200506103. [DOI] [PMC free article] [PubMed] [Google Scholar]


