

Abstract
Methionine (Meth) is an essential amino acid involved in DNA methylation and glutathione biosynthesis. We examined the effect of Meth on the development of steatohepatitis. Rats were fed (five weeks) amino acid-based Meth-choline-sufficient (A-MCS) or total deficient (MCD) diets and gavaged daily (two weeks) with vehicle (B-vehicle/MCD), or Meth replacement (C-Meth/MCD). To assess the effect of short-term deficiency, after three weeks one MCS group was fed a deficient diet (D-MCS/MCD). Animals fed the deficient diet for two weeks lost (29%) weight and after five weeks weighed one third as much as those on the sufficient diet, and also developed anemia (P < 0.01). Hepatic transaminases progressively increased from two to five weeks (P < 0.01), leading to severe hepatic pathology. Meth administration normalized hematocrit, improved weight (P < 0.05), and suppressed abnormal enzymes activities (P < 0.01). Meth administration improved blood and hepatic glutathione (GSH), S-adenosylmethionine (SAMe), and hepatic lesions (P < 0.01). The deficient diet significantly upregulated proinflammatory and fibrotic genes, which was ameliorated by Meth administration. These data support a pivotal role for methionine in the pathogenesis of the dietary model of Meth-choline-deficient (MCD) steatohepatitis (NASH).
Keywords: Methionine, MCD, MCS diets
Introduction
Non-alcoholic fatty liver disease (NAFLD) is a chronic liver condition frequently associated with multifactorial pathogenesis [1–4]. NAFLD is characterized by hepatic fat accumulation ranging from simple steatosis to severe steatohepatitis with centrilobular necroinflammation (NASH) [5]. NASH is commonly associated with perisinusoidal and perivenular fibrosis that may progress to cirrhosis. About 30–40% of patients with NAFLD develop NASH [6]. The more-severe form of NASH is characterized by varying degrees of fibrosis. Moreover, it is estimated that 10–30% of patients with NAFLD develop cirrhosis after 10 years [7, 8], and NAFLD is believed to be the most common cause of cryptogenic cirrhosis [9]. NASH is a mitochondrial disease arising from the inability of the mitochondria to adapt to drugs or dietary supply [10–13].
Potential therapeutic interventions may reduce hepatic steatosis and the development of necro-inflammation/fibrosis by reversing defects at three levels: (1) reducing excess dietary triglycerides, and free fatty acid flux to the liver from adipose tissue [14]; (2) activating key molecular steps that stimulate fatty acid oxidation and/or inhibit hepatic lipogenesis [15]; or (3) by ameliorating the inflammation cascade generated by mitochondrial dysfunction [16].
Dietary intervention, the current standard of care for NAFLD and NASH [17], primarily reduces substrate supply with secondary improvements on hepatic molecular steps and local inflammation [18].
The animal models for NASH are based on one or multiple of the known risk factors. One mechanism is the oxidative stress generated by the induction of CYP2E1, as shown in experimental animals [19] and in man [20–21]. Some models are deficient in one of the factors associated with the pathogenesis, such as cytochrome P4502E1 (CYP2E1) induction [22–24]. Lieber’s team [25, 26] has created a model in rats fed a high-fat diet, which develop the key complications of NASH.
Other models involve feeding rats a diet lacking choline and methionine [24], which creates a nutritional deficiency to which rodents are selectively sensitive.
Experimentally, the methionine-choline-deficient animal model for NAFLD is essentially based on impaired formation of very low-density lypoprotein (VLDL) through a deficiency of phosphatidylcholine, another essential component of VLDL [27].
Uncontrolled oxidation of excessive lipids (lipid peroxidation) has repeatedly been shown to be present in more-severe forms of NAFLD and NASH and has been hypothesized to trigger activation of pro-fibrotic and pro-apoptotic pathways [13, 28–32].
The aim of the present study was to examine the specific effect of Meth and its deficiency in the development of hepatic injury and inflammatory gene expression caused by total amino-acid-based Meth-choline-deficient model.
Material and methods
Methionine-choline-deficient (MCD) and methionine-choline-sufficient diets (MCS) were prepared from amino acids purchased from ICN Biochemicals (Cleveland, OH). The MCD diet was deficient only in choline and methionine and contained sufficient amounts of all other nutrients, similar to MCS diet. These diets were stored at 4°C when not in use. Reverse-transcription polymerase chain reaction (RT-PCR) reagents were obtained from Invitrogen (Carlsbad, CA). Liver enzyme kits and other chemicals were purchased from Sigma Chemical Co. (St. Louis, MO).
Animals
Specific pathogen-free Sprague-Dawley male rats of 4–6 weeks of age (100 g) were purchased from Sprague Dawley (Indianapolis, IN) and housed in microfilter-topped cages at the University of Louisville Animal Research Resources Center. Animals were maintained at 22°C with a 12:12 h light/dark cycle and fed rodent chow and water ad libitum. The experimental study was approved and performed in accordance with the guidelines for institutional animal care and use committee (IACUC) of the University of Louisville Research Resource Center, Louisville, KY, which is certified by the American Association of Accreditation of Laboratory Animal Care.
Experimental design
After an initial three days of acclimatization, 36 rats were randomly fed (ad libitum) one of the following amino-acid-based diets: (A) a methionine-choline-sufficient diet (MCS) or (B) a methionine-choline-deficient diet (MCD); see Fig. 1. Three weeks after initiation of the study, rats on the deficient diet (MCD) were subdivided into two groups and gavaged intragastrically with: (B) vehicle/sucrose (MCD), or (C) methionine replacement (Meth), a sulfur amino acid involved in GSH biosynthesis and deficient in the diet, for two additional weeks. Rats on the sufficient diet (MCS) were divided into two groups: (A) remained on the sufficient diet (MCS) or (D) fed the deficient diet (MCS/MCD) for two additional weeks. Animals received food and water ad libitum.
Fig. 1.
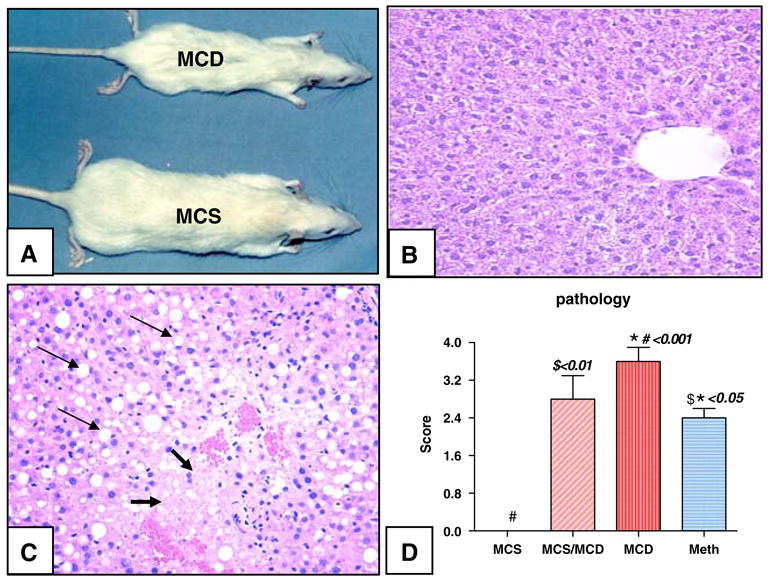
(A) Eleven-week-old representative rats on deficient (MCD) compared to sufficient (MCS) diets. (B) Normal hepatic section from MCS rat stained with H & E. (C) Representative slide from a representative rat on the deficient diet (MCD) showing severe hepatic fatty degeneration (thin arrow) and necrosis (thick arrow). (D) Hepatic pathology graded on a scale from 0 (representing no fatty degeneration, necrosis or inflammation) to 4+ (over 70% of hepatocytes showing fatty changes, necrosis or inflammation). Rats on respective diets for 3–5 weeks (MCS, MCD, or MCS/MCD) or treated with methionine supplementation for an additional two weeks [mean ± standard error on the mean (SEM), versus control]
Group 1, MCS diet
(A) MCS = control rats maintained on MCS (five weeks).
(D) MCS/MCD = rats on MCS diet (three weeks) fed the MCD diet (two weeks).
Group 2, MCD diet
(B) MCD = rats on MCD diet (five weeks) were intragastrically gavaged with vehicle/sucrose (two weeks).
(C) Meth = rats on MCD diet (five weeks) were intragastrically gavaged with methionine (two weeks). Regimens were continued for two additional weeks until animals were euthanatized with halothane Scheme 1.
Scheme 1.
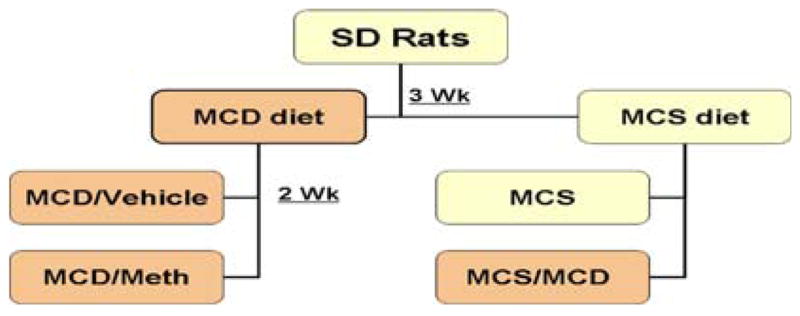
Experimental design
Whole blood and plasma isolation
Immediately after euthanizing rats with an overdose of halothane inhalation, blood was collected from the right ventricle of the heart into a syringe containing a minute amount of heparin, and then placed on ice. Plasma was separated by centrifugation at 5000 g for 5 min at 4°C. Samples were kept at −80°C until further analysis.
Tissue collection
Liver was perfused with phosphate buffer saline (PBS). Samples from liver and intestine were collected and fixed in formalin for histopathology, and the remaining tissue was immediately snap-frozen in liquid nitrogen and stored at −70°C for analysis of GSH, GSSG, SAMe concentrations, and molecular analysis.
Tissue and blood preparation for antioxidant determination
Blood samples were collected in heparinized tubes, and a 20% homogenate in 5% metaphosphoric acid was prepared. After standing for 30 min on ice, the homogenate was centrifuged for 10 min (10,000 g) and the acid-soluble fraction was collected for measurement of sulfhydryl and disulfide compounds. Tissue homogenates (10%, w/v) were prepared in 5% (w/v) metaphosphoric acid, using all-glass Tenbroeck homogenizers, and kept on ice. After standing for 20–40 min, the homogenates were centrifuged for 1 min (10,000g) and the acid-soluble fractions collected for measurement of free thiol-disulfides.
Analysis of glutathione (GSH) and other thiols (SH) and disulfides (SS) by HPLC
GSH, GSSG, cysteine, and cystine were simultaneously quantified by high-performance liquid chromatography with dual electrochemical detection (HPLC-DEC) according to the method of Chen et al. [33]. In brief, 20-μl samples were injected onto a 250 × 4.6 mm, 5 μm, C-18 column (Val-U-Pak HP, fully end capped ODS, 5 μm, 250 × 4.6 mm; Chrom Tech Inc., Apple Valley, MN). Samples (20 μl) were injected into the column and eluted isocratically with a mobile phase consisting of 0.1 M monochloroacetic acid, 2 mM heptane sulfonic acid, and 2% acetonitrile at pH 2.8, delivered at a flow rate of 1 ml/min. The compounds were detected in the eluant with a Bioanalytical Systems model LC4B dual electrochemical detector using two Au–Hg electrodes in series with potentials of −1.2 V and 0.15 V for the upstream and downstream electrodes, respectively. Current (nA) was measured at the downstream electrode. Analytes were quantified from peak area measurements using authentic external standards.
Intracellular SAMe assay by HPLC
Deproteinized tissue extracts (4% metaphosphoric acid) and blood were prepared, and SAMe was determined by an HPLC method, using a 5-μm Hypersil C-18 column (250 × 4.6 mm). The mobile phase consisted of 40 mM ammonium phosphate, 8 mM heptane sulfonic acid (ion-pairing reagent, pH 5.0), and 6% acetonitrile, and was delivered at a flow rate of 1.0 ml/min. SAMe was detected using a Waters 740 UV detector at 254 nm. An internal standard, S-adenosylethionine (SAE), was added to all samples and standard solutions to a concentration of 100 nmol/ml. Protein concentrations were measured by protein assay kit from Bio-Rad (Bio-Rad Laboratories, Hercules, CA) in accordance with the manufacturer’s instructions.
Serum enzyme assay
Serum transaminase activities [alanine aminotransferase (ALT) and aspartate aminotransferase (AST)] were measured colorimetrically using a diagnostic kit (Procedure No.505, Sigma Chemical Co., St. Louis, MO) according to the instructions provided.
Histopathological examination
A small portion of tissues from the right lobe of liver was placed in cassettes and fixed with 10% neutral formalin. The specimens were dehydrated and embedded in paraffin, and tissue sections of 5 μm were stained by hematoxylin and eosin (H&E). Each slide was coded and evaluated by the two of the co-authors using light microscopy. Hepatic lesions were graded on a scale of 0 to 4+, based on fatty degeneration, inflammation, and necrosis as follows:
Score 0, no fatty degeneration, inflammation or necrosis. Score 1+, 5–30% of hepatocytes showing fatty changes, inflammation or necrosis.
Score 2+, 31–50% of hepatocytes showing fatty changes, inflammation or necrosis.
Score 3+, 51–70% of hepatocytes showing fatty changes, inflammation or necrosis.
Score 4+, 71% or more of hepatocytes showing fatty changes, inflammation or necrosis.
RNA extraction from liver
Total RNA was extracted from 500 mg of liver tissue using TRIzol reagent (Invitrogen) and the homogenate was centrifuged. The supernatant was mixed with 300 μl of bromochlorophenol (BCP) and the mixture was centrifuged for 20 min. The upper aqueous phase containing cellular total RNA was extracted and the BCP step was repeated. The aqueous phase was then mixed with 750 μl of isopropanol and an equal amount of the high-salt solution and incubated overnight at −20°C. The mixture was centrifuged and the total RNA pellet collected. The integrity of the RNA was confirmed by visualizing the 18S and 28S ribosomal fragments on an agarose gel.
Semiquantitative reverse-transcription polymerase chain reaction (RT-PCR)
The total extracted RNA (2 μg) was reverse transcribed using oligo (dT), which served as a primer for the first strand cDNA synthesis with the addition of 1 × PCR buffer (5 mM MgCl2, 1 M each of dNTPs, 1 U/μl of RNAse inhibitor) and 2.5 U/μl of ThermoScript reverse transcriptase RT-PCR system (Invitrogen, Carlsbad, CA). The sequences for the primers and the conditions for their use are summarized in Table 1. Each RT sample was assessed for GAPDH cDNA. Genomic DNA was included in the PCR to ensure that there was no genomic DNA contamination in the total RNA samples. The reaction was performed at 42°C for 60 min followed by heat inactivation of the enzymes at 95°C for 5 min, using an Eppendorf Mastercycler gradient thermal cycler (Eppendorf Scientific, Westbury, NY). The cDNA was then subjected to amplification by Taq polymerase (Universal PCR, Invitrogen). The reaction mixture was then denatured at 95°C for 2 min, followed by a cyclic procedure of denaturation at 95°C for 45 s, annealing for 30 s, and elongation for 45 s. The annealing temperature, calculated for each pair of sense and antisense primers are shown in Table 1. This procedure was repeated for 25–35 cycles. Following these amplification steps, a final extension period was carried out at 72°C for 7 min. The PCR products were then resolved on a 1.8% agarose gel prepared in 100 mM Tris, 90 mM boric acid, and 1 mM ethylenediamine tetraacetic acid (EDTA) buffer, and the size of the PCR products were determined using an appropriate DNA size marker. The bands were visualized by ethidium bromide staining and ultraviolet (UV) transillumination. Integrated density values for the genes in question were normalized to the GAPDH values to yield a semiquantitative assessment.
Table 1.
PCR primers and annealing temperatures used
| Gene | Primers | Tm (°C) | RT-PCR products | bp |
|---|---|---|---|---|
| MMP-9 | F: C TAGGCTACAG CTTTGCTGC | 53 | cDNA | 323 |
| R: GTT ATGATGGTGC CACTTGA | ||||
| MMP-13 | F: AAAGAACATGGTGACTTCTACC | 53 | F/R1 | 265 |
| R1: ACTGGATTCCTTGAACGTC | F/R2 | 348 | ||
| R2: AAAACACCAGAGAAGTGTGAC | ||||
| IL 1β | F: TGATGTTCCCATTAGACAGC TGCA | 58 | 419 | |
| R: CCATTGCTGT TTCCTAGGAA GACA | ||||
| TNF-α | F: G AAAGCATGAT CCGAGATGTG GAA | 58 | cDNA | 261 |
| R: GCTTGTCACTCGAGTTTTGAGAAG | genomic DNA | 900 | ||
| R: GCTTGTCACTCGAGTTTTGAGAAG | ||||
| IL-6 | F: GC CAGAGTCATT CAGAGCAATA | 55 | cDNA | 262 |
| R: G TGAGGAATGT CCACAAACTG A | genomic DNA | 1488 | ||
| SOCS1 | F: GAGCCATCCTC GTCCTCGTCT T | 60 | cDNA | 381 |
| R: G CTCGAAGAGG CAGTCGAAGG T | NM_145879 | |||
| TGF-β1 | F: GTGAAACG GAAGCGCATC GAA | 58 | cDNA | 307 |
| R: GCTTCCCGAA TGTCTGACGTA | MUSTGF1G06 | |||
| COLA. I | F: CAGCGGTGAAG AAGGAAAGAG A | 58 | 360 | |
| R: GAATCCGATG TTGCCAGCTTCA | NM_053356 | |||
| GAPDH | F: TGAAGGTCGGTGTCAACGGATTTGGC | 55 | cDNA | 352 |
| R: GATGATG ACCCTTTTGG CACCACCCT |
F = forward, R = reverse
Statistical analysis
All data are expressed as mean ± SEM. Statistical analysis was performed using analysis of variation (ANOVA). The data was further analyzed by a post hoc test for statistical difference (the Tukey-Kramer multiple comparison test). Differences between groups were considered to be statistically significant at P < 0.05.
Results
Rats fed the amino-acid-based deficient diet for two weeks (MCS/MCD) had a normal hematocrit value but decreased (29%) weight (MCS/MCD 202 ± 4 g versus MCS 285 ± 4 g, P < 0.05). The animals fed the deficient diet for five weeks (MCD/vehicle) weighed only one third compared to those on a sufficient diet (MCD 90 ± 3 g versus MCS 285 ± 4 g, P < 0.001, Fig. 1A) and developed anemia (hematocrit: MCS 45 ± 0.4 versus MCD 40 ± 0.2, P < 0.01); they otherwise appeared normal. Daily administration of Meth (two weeks) partially improved hematocrit (Meth/MCD 43 ± 0.5) and bodyweight (19%) (Meth/MCD versus MCD, P < 0.01, Table 2).
Table 2.
Analysis of hematocrit (HCT), S-adenosylmethionine (SAMe), and live glutathione concentrations
| Groups | MCS | Meth | MCD | MCS/MCD | P value |
|---|---|---|---|---|---|
| Weight/g | #285 ± 4 | *110 ± 3 | #*90 ± 3 | 202 ± 4 | #<0.001 *<0.05 |
| HCT | $45 + 0.4 | *43 + 0.5 | $*40 + 0.2 | ND | $<0.01 *<0.05 |
| SAMe nmol/g | $#59.3 ± 4.5 | $19 ± 4.3 | #7 ± 0.8 | $17 ± 3.5 | $<0.01 #<0.001 |
| SAMe/SAH ratio | #1 ± 0.09 | $0.3 ± 0.07 | #$0.09 ± 0.03 | $0.2 ± 0.05 | #<0.001 $<0.01 |
| Liver GSSG nmol/g | *226 ± 24 | 196 ± 31 | *266 ± 28 | 257 ± 17 | *<0.05 |
| Liver GSH/GSSG | *19 | 21 | *13 | 17 | *<0.05 |
Reduced glutathione (GSH) and disulfides (GSSG) measured with HPLC (nmol/g). Rats fed sufficient (MCS) or deficient diet for three weeks (MCS/MCD) or five weeks (MCD). MCD rats were orally treated with methionine (Meth), or vehicle (MCD). Data are expressed as mean ± SEM (ANOVA; further analyzed by a post hoc)
Rats fed the deficient diet developed severe hepatic pathology evidenced (two weeks) by fatty degeneration, inflammation (MCS/MCD score: 2.8 ± 0.5) and progression after five weeks to necrosis (MCD score: 3.6 ± 0.5, P < 0.001). Meth administration partially but significantly improved hepatic lesions (2.4 ± 0.2 Meth/MCD versus MCD, P < 0.01, Fig. 1B–D).
Hepatic transaminases significantly increased after two weeks (MCS/MCD versus MCS, P < 0.01) and further elevated (AST: sixfold; ALT: threefold MCD versus MCS, P < 0.001) after five weeks on the deficient diet. Meth administration significantly suppressed these abnormal enzyme activities (Meth/MCD versus MCD, P < 0.01, Fig. 2).
Fig. 2.

Liver enzymes (AST and ALT) activity (SFU/ml) from dietary groups
Blood (MCS versus MCD, P < 0.001) and hepatic reduced GSH (MCS versus MCD, P < 0.01) were significantly affected after five weeks on the deficient diet and were restored to normal level with Meth administration (Fig. 3). Endogenous hepatic SAMe was significantly reduced (MCS versus MCS/MCD, P < 0.01; MCS versus MCD, P < 0.001) in animals fed the deficient diet and partially but significantly improved with Meth administration (Meth/MCD versus MCD, P < 0.01, Fig. 4).
Fig. 3.

The MCD diet caused profound depletion of blood (nmol/ml) and liver (nmol/g) concentrations of reduced GSH, while Meth supplementation improved these abnormalities (assayed by HPLC)
Fig. 4.

Intracellular SAMe concentration (nmol/g) assayed by HPLC was partially (but significantly) improved in the Meth group [Meth versus MCD, P < 0.05; MCD versus MCS, P < 0.001 (mean ± SEM)]
Finally, rats on the normal diet (MCS) expressed a negligible amount of the inflammatory cytokines and the genes involved in tissue remodeling and fibrosis. The deficient diet (two weeks) significantly upregulated inflammatory cytokines genes for inflammatory cytokines [TNF-α (7.4-fold), IL-6 (21.6-fold), IL-1β (7.2-fold), TGF-β (3.5-fold); Fig. 5). These findings were consistent with the increased expression of genes involved in tissue remodeling and fibrosis [matrix metalloproteinase, MMP-9, (10.5-fold), MMP-13 (3.9-fold), collagen-α1 (8.8-fold)], and suppressor of cytokines signaling 1 (SOCS1, 3.3-fold) expression after only two weeks on the deficient diet (MCS/MCD), (Figs. 6 and 7). Importantly, administration of Meth for two consecutive weeks significantly normalized upregulation of these deleterious gene (Table 3).
Fig. 5.
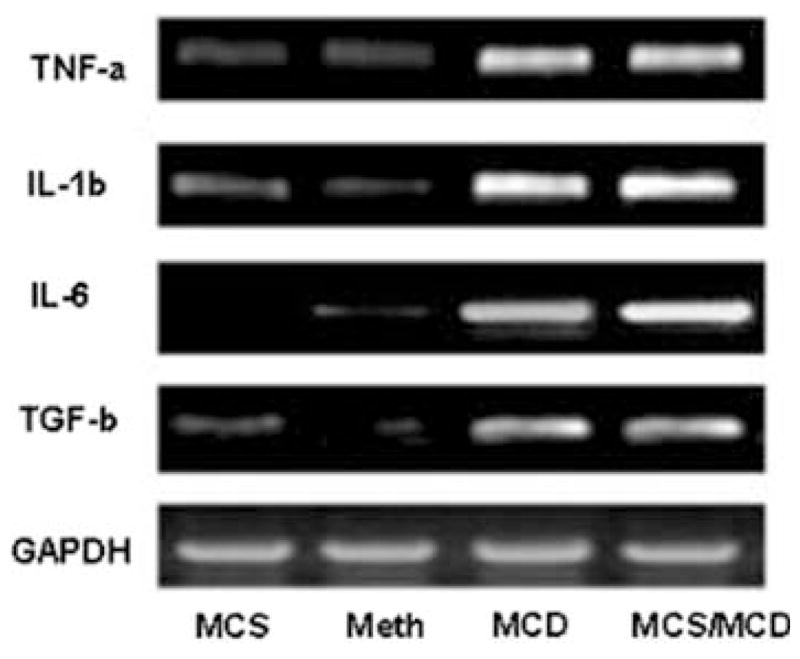
Gel representative RT-PCR analysis showing gene expression of hepatic cytokines in the MCS control diet (lane 1), MCD/Meth (lane 2), MCD (lane 3), and MCS/MCD (lane 4). The ratio of these genes were normalized with housekeeping GAPDH and are summerized in Table 3 (n = 4, mean ± SEM)
Fig. 6.
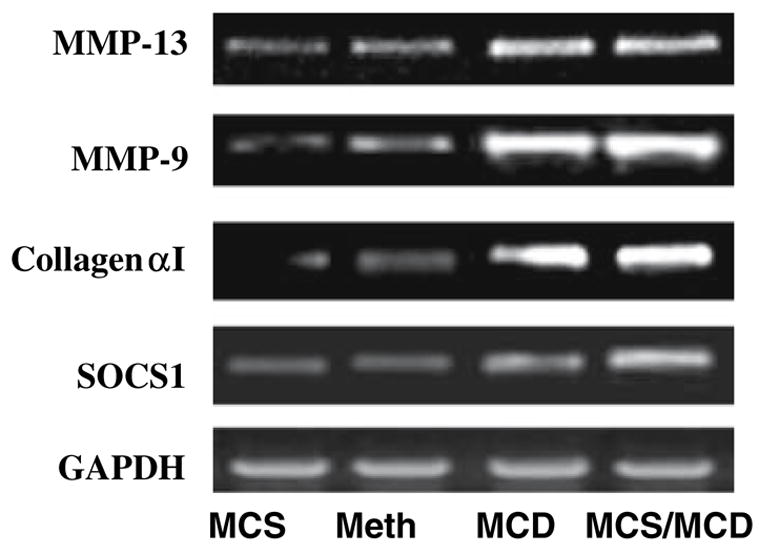
Representative gel analysis of RT-PCR products shows genes involved in tissue remodeling and fibrogensis from rat livers. Lane 1 control: MCS, lane 2: MCD/Meth, lane 3: MCD, and lane 4: MCS/MCD (n = 4; mean ± SEM)
Fig. 7.

Quantitation analysis with densitometry showing the ratio of collagen-α1 gene expression normalized (relative value) with the housekeeping gene GAPDH (MCS versus MCD, P < 0.001; MCS versus MCD/Meth, P < 0.05) (n = 4, mean ± SEM)
Table 3.
Quantitative densitometry from RT-PCR gene expression (mean ± SEM)
| Groups | MCS | Meth | MCD | MCS/MCD | P value |
|---|---|---|---|---|---|
| TNF-α | #0.8 ± 0.1 | 1.3 ± 0.2 | #6.17 ± 0.8 | #5.95 ± 0.4 | #<0.001 |
| IL-6 | #0.5 ± 0.2 | 08 ± 0.1 | #9.3 ± 1 | #10.8 ± 0.4 | #<0.001 |
| IL-1β | #1.0 ± 0.2 | 1.1 ± 0.05 | #7 ± 0.5 | #7.2 ± 0.3 | #<0.001 |
| TGF-β | #1.0 ± 0.04 | 1.0 ± 0.05 | #3.9 ± 0.5 | #3.5 ± 0.1 | #<0.001 |
| SOCS1 | #1.1 ± 0.05 | 1.3 ± 0.2 | #2.4 ± 0.3 | #3.3 ± 0.2 | #<0.001 |
| COLLAGEN-α1 | #0.5 ± 0.2 | 1.5 ± 0.3 | #4.7 ± 0.4 | #4.4 ± 0.2 | #<0.001 |
| MMP-9 | #0.85 ± 0.1 | 1.9 ± 0.1 | #7.3 ± 0.5 | #8.9 ± 0.4 | #<0.001 |
| MMP-13 | #1.4 ± 0.2 | 1.8 ± 0.1 | #6.3 ± 0.4 | #5.4 ± 0.2 | #<0.001 |
Discussion
Nonalcoholic steatosis (NAFLD) and steatohepatitis (NASH) may accompany a variety of clinical disorders including parenteral nutrition, nutritional protein deficiency, congenital metabolic disorders, jejuno-ileal bypass, chronic inflammatory bowel disease, and chronic chemical intoxication [10, 13, 34, 35]. A number of animal models of NAFLD and NASH have been described. Many of these involve abnormalities of the hepatic transmethylation and transsulfuration pathways including mice deficient for the enzymes methionine adenosyltransferase 1A (MAT1A), methylene tetrahydrofolate reductase (MTHFR), and phosphatidylethanolamine N-methyltransferase (PEMT) [36]. Methionine (Meth), a sulfur amino acid, serves as a precursor for the biosynthesis of cysteine and GSH through the trans-sulfuration pathway; however, the reverse reaction does not occur, making Meth of critical importance [37]. Consumption of Meth choline deficient (MCD) diet provokes steatohepatitis. This model mimics nutritional deficiency that produces lesions similar to the histological and biochemical lesion caused by NASH.
In the present study, we explored the mechanistic action for Meth deficiency in the development of hepatic injury in this model. Young rats fed amino-acid-based MCD for two (MCS/MCD) to five consecutive weeks (MCD) lost, respectively, 30% and 65% of their bodyweight, but appeared otherwise normal. This weight loss was attributed predominately to the choline deficiency, since Meth replacement only partially improved this abnormality. Weight loss has been reported previously in rats fed a high-fat Meth-restricted choline-deficient (MCD) diet (not amino acid) after 12 weeks [38]. In the current study, rats developed severe hepatic lesions after two weeks as evidenced by fatty degeneration (steatosis) and inflammation (MCS/MCD score: 2.8 ± 0.5) that progressed to necrosis after five weeks on the deficient diet (MCD score: 3.6 ± 0.5, P < 0.001). MCD rats showed significant hepatic injury without exogenous lipopolysaccharide (LPS) challenge as purportedly required in previous studies [35]. These changes were accompanied by a marked elevation in serum aspartate transaminase (AST, 5.8-fold), and alanine transaminase (ALT, 3.2-fold) enzyme activity as early as after two weeks on deficient diet. Hepatic enzymes normalized and histological damage partially but significantly improved with Meth supplementation (Meth/MCD versus MCD, P < 0.01).
In the current study, there was a significant overexpression of inflammatory genes, such as TNF-α (7.7- fold), IL-6 (17-fold), IL-1β (7-fold), TGF-β (3-fold), and SOCS1 (2.4-fold) in hepatic tissue from rats on deficient diets. Similarly, genes involved in the structure of extracellular matrix, MMP-9 (gelatinase-B, 8.5-fold), MMP-13 (4-fold), collagen-α1 (9.2-fold), were upregulated. Meth administration significantly attenuated the upregulation of these deleterious genes.
Meth is readily oxidized by the reactive oxygen species (ROS) [39, 40]. Meth deficiency results in GSH depletion, which in turn promotes oxidative damage by cellular constituents, including amino acids, lipids, and nucleic acids, and contributes to tissue destruction in a wide variety of diseases, including steatohepatitis [40, 41]. GSH is a crucial cellular antioxidant that neutralizes free radicals, and adequate protein nutrition is necessary for the maintenance of GSH homeostasis. In addition, oral administration of methionine and 2(RS)-n-propylthiazoli-dine-4(R)-carboxylic acid (PTCA) are effective precursors of cysteine for tissue GSH synthesis in animal models for inflammatory complications such as overdose acetaminophen hepatotoxicity [42], dextran sodium sulfate (DSS)-induced colitis [43, 44], and steatohepatitis [45]. GSH is depleted during illness and, as illustrated in the present investigation, animals fed the MCD diet developed marked depletion of hepatic and blood reduced GSH (35%) when compared to those fed the sufficient diet (MCS). However, Meth supplementation and cysteine GSH pro-drug treatments circumvented this deficiency. SAMe deficiency is often associated with GSH deficiency, [35] since SAMe is a precursor for hepatic GSH. Endogenous liver SAMe is also a substrate for de novo biosynthesis of choline. In this study, animals fed an MCD diet developed GSH depletion that accompanied by a reduction in endogenous hepatic SAMe concentrations. Meth replacement normalized reduced blood and hepatic GSH storages caused by MCD diet, and partially improved the hepatic SAMe concentrations.
Previous reports have also demonstrated significantly lower hepatic concentrations of both SAMe and choline after two weeks on Meth-restricted choline-deficient diet [35]. Daily IM injection with SAMe restored hepatic concentrations of SAMe but did not affect hepatic choline levels [35], suggesting that dietary supplementation of choline is necessary to normalize hepatic choline concentrations in these animals. We recently reported that oral administration of SAMe for two consecutive weeks partially but significantly restored hepatic SAMe after induction of hepatic injury in MCD rats [45]. Hepatic SAMe deficiency is associated with increased susceptibility to LPS-induced hepatotoxicity and increased serum TNF-α concentrations [35]. Similarly, acetaminophen toxicity is associated with hepatic SAMe deficiency and increased serum TNF-α levels. In addition, oral administration of SAMe has proven beneficial in acetaminophen-induced hepatotoxicity in mice [42] as well as in alcohol-induced liver injury [46, 47], by improving GSH levels and decreasing TNF-α levels.
The importance of steatosis as a sensitizer to a drug was also demonstrated in a recent work [48]. Male Sprague-Dawley rats were fed a methionine- and choline-deficient diet for 31 days to induce steatosis. On day 32, administration of a nonlethal dose of carbon tetrachloride (CCl4—2 ml/kg, intraperitoneally) yielded 70% mortality in steatotic rats 12–72 h after CCl4 administration, whereas all nonsteatotic rats survived.
Miele et al. clearly established the role of dietary deficiencies in the formation and progression of liver damage in non-alcoholic steatohepatitis in humans [49]. The present study demonstrates that Meth deficiency in a dietary model causes major hepatic pathology and inflammatory/fibrotic gene overexpression as early as two weeks after consumption of an MCD diet. The abnormalities were largely reversible by Meth replacement therapy. These data support the pivotal role played by Meth in the pathogenesis and expression of inflammatory/fibrogenic genes as early as two weeks in this dietary model for steatohepatitis.
Acknowledgments
This study was supported by National Institutes of Health grant NCAM AT1490 (H.S. Oz). Marcia C. Liu provided technical assistance.
Abbreviations
- ALT
Alanine aminotransferase
- AST
Aspartate aminotransferase
- BCP
Bromochlorophenol
- cDNA
Complementary DNA
- GAPDH
Glyceraldehyde-3-phosphate dehydrogenase
- GSH
Reduced glutathione
- GSSG
Oxidized glutathione
- IL-1β-IL-6
Interleukin-1beta and interleukin-6
- MCD
Methionine-choline-deficient diet
- MCS
Methionine-choline-sufficient diet
- MMPs
Tissue matrix metalloproteinases
- Meth
Methionine
- mRNA
Messenger RNA
- NAFL
Non-alcoholic fatty liver
- NASH
Non-alcoholic steatohepatitis
- PCR
Polymerase chain reaction
- SAMe
S-adenosylmethionine
- SOCS
Silencing suppressor of cytokine signaling
- TGF-β
Transforming growth factor beta
- TNF-α
Tumor necrosis factor alpha
Contributor Information
Helieh S. Oz, Center for the Oral Health Research, Department of Internal Medicine, University of Kentucky Medical Center, 800 Rose St., Lexington, KY 40536, USA
Theresa. S. Chen, Department of Pharmacology and Toxicology, University of Louisville Medical School, Louisville, KY, USA
Manuela Neuman, In Vitro Drug Safety and Biotechnology, Department of Pharmacology & Institute of Drug Research, University of Toronto, Toronto, ON, Canada.
References
- 1.Lee RG, Keeffe EB. Non-alcoholic fatty liver: causes and complications. In: Bircher J, Benhamou JP, McIntyre M, et al., editors. Oxford, textbook of clinical hepatology. 2. Oxford University Press; Oxford, UK: 1999. pp. 1251–1257. [Google Scholar]
- 2.Kumar KS, Malet PF. Nonalcoholic steatohepatitis. Mayo Clin Proc. 2000;75:733–739. doi: 10.4065/75.7.733. [DOI] [PubMed] [Google Scholar]
- 3.Angulo P. Nonalcoholic fatty liver disease. N Engl J Med. 2002;346:1221–1231. doi: 10.1056/NEJMra011775. [DOI] [PubMed] [Google Scholar]
- 4.Fong DG, Nehra V, Lindor KD, Buchman AL. Metabolic and nutritional considerations in non-alcoholic fatty liver. Hepatology. 2000;32:3–10. doi: 10.1053/jhep.2000.8978. [DOI] [PubMed] [Google Scholar]
- 5.Begriche K. Mitochondrial dysfunction in NASH: causes, consequences and possible means to prevent it. Mitochondrion. 2006;6:1–28. doi: 10.1016/j.mito.2005.10.004. [DOI] [PubMed] [Google Scholar]
- 6.Farrell GC. Nonalcoholic fatty liver disease: from steatosis to cirrhosis. Hepatology. 2006;43:S99–S112. doi: 10.1002/hep.20973. [DOI] [PubMed] [Google Scholar]
- 7.Matteoni CA, Younossi Z, Gramlich T, Boparai N, Liu YC, McCullough AJ. Nonalcoholic fatty liver disease: a spectrum of clinical and pathological severity. Gastroenterology. 1999;116:1413–1419. doi: 10.1016/s0016-5085(99)70506-8. [DOI] [PubMed] [Google Scholar]
- 8.Powell E, Cooksley WG, Hanson R, et al. The natural history of nonalcoholic steatohepatitis: a followup study of forty-two patients for up to 21 years. Hepatology. 1990;11:74–80. doi: 10.1002/hep.1840110114. [DOI] [PubMed] [Google Scholar]
- 9.Maheshwari A. Cryptogenic cirrhosis and NAFLD: are they related? Am J Gastroenterol. 2006;101:664–668. doi: 10.1111/j.1572-0241.2006.00478.x. [DOI] [PubMed] [Google Scholar]
- 10.Pessayre D, Fromenty B. NASH: a mitochondrial disease. J Hepatology. 2005;42:928–940. doi: 10.1016/j.jhep.2005.03.004. [DOI] [PubMed] [Google Scholar]
- 11.Caldwell S, Chang Y, Nakamoto R, Krugner-Higby L. Mitochondria in nonalcoholic fatty liver disease. Clin Liver Dis. 2004;8:595–617. doi: 10.1016/j.cld.2004.04.009. [DOI] [PubMed] [Google Scholar]
- 12.Browning JD, Horton J. Molecular mediators of hepatic steatosis and liver injury. J Clin Invest. 2004;114:147–152. doi: 10.1172/JCI22422. [DOI] [PMC free article] [PubMed] [Google Scholar]
- 13.Pessayre D, Feldman G, Haouzi D, Fau A, Moreau A, Neuman MG. Hepatocyte apoptosis triggered by natural substances (cytokines, other endogenous molecules and foreign toxins) In: Cameron RG, Fauer G, editors. Handbook of experimental pharmacology: apoptosis modulation by drugs. Chapter 3. Vol. 142. Springer Verlag Publishers; Heidelberg: 1999. pp. 69–109. [Google Scholar]
- 14.Weikert M, Pfeiffer A. Signalling mechanisms linking hepatic glucose and lipid metabolism. Diabeteologia. 2006;49:1732–1741. doi: 10.1007/s00125-006-0295-3. [DOI] [PubMed] [Google Scholar]
- 15.Reddy J, Sambasiva Rao M. Lipid metabolism and liver inflammation. Fatty liver disease and fatty acid oxidation. Am J Physiol Gastrointest Liver Physiol. 2006;290:G852–G858. doi: 10.1152/ajpgi.00521.2005. [DOI] [PubMed] [Google Scholar]
- 16.Neuman MG, Valentino K. Caspases, S-Adenosyl methionine, and anti-tumor necrosis factor alpha signaling for protection in ethanol induced apoptosis in normal human hepatocyte. J Hepatol. 2003;38(suppl 2 abs 686):197. [Google Scholar]
- 17.Neuschwander-Tetri BA, Caldwell SH. Nonalcoholic steatohepatitis: summary of an AASLD single topic conference. Hepatology. 2003;37:1202–1219. doi: 10.1053/jhep.2003.50193. [DOI] [PubMed] [Google Scholar]
- 18.Wang R, Koretz R, Yee H. Is weight reduction an effective therapy for nonalcoholic fatty liver? A systematic review. Am J Med. 2003;115:554–559. doi: 10.1016/s0002-9343(03)00449-2. [DOI] [PubMed] [Google Scholar]
- 19.Enriquez A, Leclercq I, Farrell GC, Robertson G. Altered expression of hepatic CYP2E1 and CYP4A in obese, diabetic ob/ob mice, and fa/fa Zucker rats. Biochem Biophys Res Commun. 1999;255:300–306. doi: 10.1006/bbrc.1999.0202. [DOI] [PubMed] [Google Scholar]
- 20.Weltman MD, Farrell GC, Hall P, lngelman-Sundberg M, Liddle C. Hepatic cytochrome P4502E1 is increased in patients with nonalcoholic steatohepatitis. Hepatology. 1998;27:128–133. doi: 10.1002/hep.510270121. [DOI] [PubMed] [Google Scholar]
- 21.Emery MG, Fisher JM, Chien JY, Kharasch ED, Dellinger EP, Kowdley KV, Thummel KE. CYP2E1 activity before and after weight loss in morbidly obese subjects with nonalcoholic fatty liver disease. Hepatology. 2003;38:428–435. doi: 10.1053/jhep.2003.50342. [DOI] [PubMed] [Google Scholar]
- 22.Raucy JL, Lasker JM, Kramer JC, Salazar DE, Lieber CS, Corcoran GB. Induction of P45OIIE1 in the obese rat. Mol Pharmacol. 1991;39:275–280. [PubMed] [Google Scholar]
- 23.Irizar A, Barnett CR, Flatt PR, Ioannides C. Defective expression of cytochrome P450 proteins in the liver of the genetically obese Zucker rats. Eur J Pharmacol. 1995;293:385–393. doi: 10.1016/0926-6917(95)90059-4. [DOI] [PubMed] [Google Scholar]
- 24.Weltman MD, Farrell GC, Liddle C. Increased hepatocyte CYP2E1 expression in a rat nutritional model of hepatic steatosis with inflammation. Gastroenterology. 1996;111:1645–1653. doi: 10.1016/s0016-5085(96)70028-8. [DOI] [PubMed] [Google Scholar]
- 25.Lieber CS, Leo MA, Mak KM, Xu Y, Cao Q, Ren C, Ponomarenko A, DeCarli LM. Model of nonalcoholic steatohepatitis. Am J Clin Nutr. 2004;79:502–509. doi: 10.1093/ajcn/79.3.502. [DOI] [PubMed] [Google Scholar]
- 26.Lieber CS, Leo MA, Mak KM, Xu Y, Cao Q, Ren C, Ponomarenko A, DeCarli LM. Acarbose attenuates experimental non-alcoholic steatohepatitis. Biochem Biophys Res Commun. 2004;315:699–703. doi: 10.1016/j.bbrc.2004.01.116. [DOI] [PubMed] [Google Scholar]
- 27.Farrell GC. Animal models of steatohepatitis. In: Farrell GC, George J, Hall P, McCullough AJ, editors. Fatty liver disease; NASH and related disorders. Blackwell Publishing; Malden, MA, USA: 2005. p. 91. [Google Scholar]
- 28.Seki S, Kitada T, Sakaguchi H, Nakatani K, Wakasa K. In situ detection of lipid peroxidation and oxidative DNA damage in non-alcoholic fatty liver disease. J Hepatol. 2002;37:56–62. doi: 10.1016/s0168-8278(02)00073-9. [DOI] [PubMed] [Google Scholar]
- 29.Garcia-Monzon C, Martin-Perez E, Lo Iacono O, Fernandez-Bermejo M, Majano PL, et al. Characterization of pathogenic and prognostic factors of nonalcoholic steatohepatitis associated with obesity. J Hepatol. 2000;33:716–724. doi: 10.1016/s0168-8278(00)80301-3. [DOI] [PubMed] [Google Scholar]
- 30.Rashid A, Wu T-C, Huang CC, Chen CH, Lin HZ, et al. Mitochondrial proteins that regulate apoptosis and necrosis are induced in mouse fatty liver. Hepatology. 1999;29:1131–1138. doi: 10.1002/hep.510290428. [DOI] [PubMed] [Google Scholar]
- 31.Feldstein AE, Canby A, Angulo P, Taniai M, Burgart LJ, Lindor KD, Gores GJ. Hepatocyte apoptosis and FAS expression are prominent features of human nonalcoholic steatohepatitis. Gastroenterology. 2003;125:437–443. doi: 10.1016/s0016-5085(03)00907-7. [DOI] [PubMed] [Google Scholar]
- 32.Feldman G, Haouzi D, Moreau A, Durang-Schneider A-M, Bringuier A, Berson A, Mansouri A, Fau D, Pessayre D. Opening of the mitochondrial permeability transition pore causes matrix expansion and outer membrane rupture in FAS-mediated hepatic apoptosis in mice. Hepatology. 2000;31:674–683. doi: 10.1002/hep.510310318. [DOI] [PubMed] [Google Scholar]
- 33.Chen TS, Richie JP, Nagasawa HT, Lang CA. Glutathione monoethyl ester protects against glutathione deficiencies due to aging and acetaminophen in mice. Mech Ageing Dev. 2000;120:127–139. doi: 10.1016/s0047-6374(00)00214-1. [DOI] [PubMed] [Google Scholar]
- 34.Feher J, Lengyel G. A new approach to drug therapy in non-alcoholic steatohepatitis (NASH) J Int Med Res. 2003;31:537–551. doi: 10.1177/147323000303100610. [DOI] [PubMed] [Google Scholar]
- 35.Chawla RK, Watson WH, Eastin CE, Lee EY, Schmidt J, McClain CJ. S-adenosylmethionine deficiency and TNF-alpha in lipopolysaccharide-induced hepatic injury. Am J Physiol. 1998;275:G125–G129. doi: 10.1152/ajpgi.1998.275.1.G125. [DOI] [PubMed] [Google Scholar]
- 36.Zhu x, Song J, Mar M, Edwards LJ, Zeisel SH. Phosphatidylethanolamine N-methyltrasferase (PEMT) knock mice have hepatic steatosis and abnormal hepatic choline metabolite concentrations despite ingesting a recommended dietary intake of choline. Biochemistry J. 2003;370:987–993. doi: 10.1042/BJ20021523. [DOI] [PMC free article] [PubMed] [Google Scholar]
- 37.Baker DH. Utilization of isomers and analogs of amino acids and other sulfur- containing compounds. Prog Food Nutr Sci. 1986;10:133–178. [PubMed] [Google Scholar]
- 38.George J, Pera N, Phung N, Leclercq I, Yun Hou J, Farrell G. Lipid peroxidation, stellate cell activation and hepatic fibrogenesis in a rat model of chronic steatohepatitis. Hepatology. 2003;39:756–764. doi: 10.1016/s0168-8278(03)00376-3. [DOI] [PubMed] [Google Scholar]
- 39.Weissbach H, Etienne F, Hoshi T, Heinemann SH, Lowther WT, Matthews B, St John G, Nathan C, Brot N. Arch Biochem Biophys. 2002;397:172–178. doi: 10.1006/abbi.2001.2664. [DOI] [PubMed] [Google Scholar]
- 40.Yermolaieva O, Xu R, Schinstock C, Brot N, Weissbach H, Heinemann SH, Hoshi T. Methionine sulfoxide reductase A protects neuronal cells against brief hypoxia/reoxygenation. Proc Natl Acad Sci USA. 2004;101:1159–1164. doi: 10.1073/pnas.0308215100. [DOI] [PMC free article] [PubMed] [Google Scholar]
- 41.Matsui H, Ikeda K, Nakajima Y, Horikawa S, Imanishi Y, Kawada N. Sulfur-containing amino acids attenuate the development of liver fibrosis in rats through down-regulation of stellate cell activation. J Hepatol. 2004;40:917–925. doi: 10.1016/j.jhep.2004.02.011. [DOI] [PubMed] [Google Scholar]
- 42.Oz HS, McClain CJ, Nagasaw HT, Ray MB, de Villiers WSJ, Chen TS. Diverse antioxidants protect against acetaminophen hepatotoxicity. J Biochem Mol Toxicol. 2004;18:361–368. doi: 10.1002/jbt.20042. [DOI] [PubMed] [Google Scholar]
- 43.Oz HS, Chen T, McClain C, de Villiers W. Antioxidants a novel therapy in a murine model of colitis. J Nutr Biochem. 2005;16(5):297–304. doi: 10.1016/j.jnutbio.2004.09.007. [DOI] [PubMed] [Google Scholar]
- 44.Oz HS, Chen T, Nagasawa H. Comparative efficacies of two cysteine prodrugs and a glutathione delivery agent in a colitis model. Transl Res. 2007;150:122–129. doi: 10.1016/j.trsl.2006.12.010. [DOI] [PMC free article] [PubMed] [Google Scholar]
- 45.Oz HS, Hee-Jeong IM, Chen TS, de Villiers WJS, McClain CJ. Glutathione enhancing agents protect against steatohepatitis in a model. J Biochem Mol Toxicol. 2006;20:39–47. doi: 10.1002/jbt.20109. [DOI] [PMC free article] [PubMed] [Google Scholar]
- 46.Lu SC. S-Adenosylmethionine. Int J Biochem Cell Biol. 2000;32:391–395. doi: 10.1016/s1357-2725(99)00139-9. [DOI] [PubMed] [Google Scholar]
- 47.McClain CJ, Prakash S, Mokshagundam L, Barve S, Song Z, Hill D, Chen T. Deaciuc I mechanisms of non-alcoholic steatohepatitis. Alcohol. 2004;34:67–79. doi: 10.1016/j.alcohol.2004.07.007. [DOI] [PubMed] [Google Scholar]
- 48.Donthamsetty S, Bhave VS, Mitra MS, Latendresse JR, Mehendale HM. Nonalcoholic fatty liver sensitizes rats to carbon tetrachloride hepatotoxicity. Hepatology. 2007;45(2):391–411. doi: 10.1002/hep.21530. [DOI] [PubMed] [Google Scholar]
- 49.Miele L, Forgione A, Hernandez AP, Gabrieli ML, Vero V, Di Rocco P, Greco AV, Gasbarrini G, Gasbarrini A, Grieco A. The natural history and risk factors for progression of non-alcoholic fatty liver disease and steatohepatitis. Eur Rev Med Pharmacol Sci. 2005;9:273–278. [PubMed] [Google Scholar]