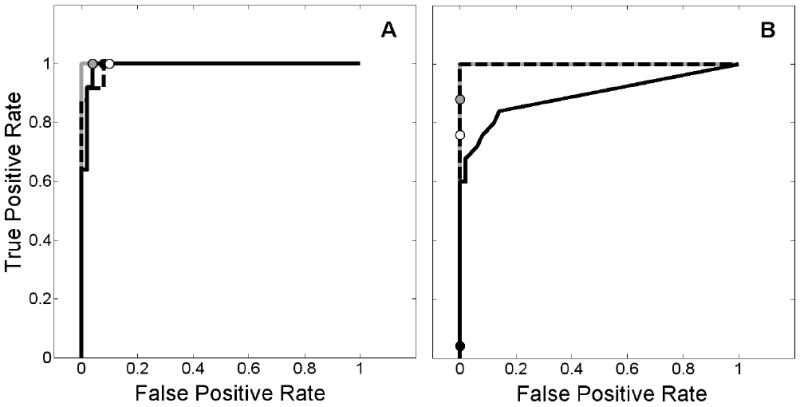
Figure 14.

Receiver operating characteristic (ROC) curves demonstrating the effect of altered tracer delivery on the ability of ART and REF to detect neurotransmitter release events. 95% confidence thresholds are indicated by circles to show the chosen operating point. Left panel (A) corresponds to changes in blood flow, right panel (B) to changes in K1 and/or . ROC curve for ART applied to data with increased delivery to target region is shown as solid gray curve (threshold: gray circle), REF applied to data with increased delivery to target region and decreased delivery to reference region displayed as solid black curve (threshold: solid black circle), and REF applied to data with decreased delivery to reference region only plotted as dashed black curve (threshold: white circle). In B, solid gray and dashed black curves overlay one another.
