

Abstract
Protein–protein binding and signaling pathways are important fields of biomedical science. Here we report simple optical methods for the determination of the equilibrium binding constant Kd of protein–protein interactions as well as quantitative studies of biochemical cascades. The techniques are based on steady-state and time-resolved fluorescence resonance energy transfer (FRET) between ECFP and Venus-YFP fused to proteins of the SUMO family. Using FRET has several advantages over conventional free-solution techniques such as isothermal titration calorimetry (ITC): Concentrations are determined accurately by absorbance, highly sensitive binding signals enable the analysis of small quantities, and assays are compatible with multi-well plate format. Most importantly, our FRET-based techniques enable us to measure the effect of other molecules on the binding of two proteins of interest, which is not straightforward with other approaches. These assays provide powerful tools for the study of competitive biochemical cascades and the extent to which drug candidates modify protein interactions.
Keywords: protein–protein binding, inhibition, Kd, ECFP, fluorescent protein, FRET, time resolved, SUMO, Ubc9, RanBP2, drug screening
The SUMOylation pathway is a good example of a biochemical cascade of multiple protein–protein interactions (Liu et al. 1999; Melchior et al. 2003; Wilson 2004; Hay 2005), as it requires the concerted efforts of several proteins to catalyze the formation of a covalent bond between the small ubiquitin-like modifier SUMO and a variety of protein targets (Hochstrasser 2000; Yeh et al. 2000; Schwartz and Hochstrasser 2003; Tatham et al. 2003a). Disregulation of the SUMO pathway has been linked to diseases including ovarian carcinoma, melanoma, and lung adenocarcinoma (Mo and Moschos 2005).
Quantitative in vitro analysis of protein–protein binding is fundamental to our understanding of complex biochemical pathways (Waksman 2005). Here we present quantitative equilibrium binding assays based on steady-state and time-resolved fluorescence resonance energy transfer (FRET). First, we validate the methods by determining the Kd for SUMO1–Ubc9 and Ubc9–RanBP2 and comparing them to ITC experiments. We then demonstrate the use of FRET to study the biochemical cascade. Previous work suggested that SUMO1, Ubc9, and RanBP2 form a stable complex which catalyzes the final step of SUMO1 conjugation to substrates (Reverter and Lima 2005; Tatham et al. 2005). Our technique enables us to monitor the bound SUMO1–Ubc9 complex while adding RanBP2. Ubc9 has independent binding sites for both RanBP2 and SUMO1; however, our results show that they bind competitively. A trimeric complex of the three proteins only seems to be formed when SUMO1 and Ubc9 are covalently linked. This is an important point, since it suggests that the requirement for covalent linkage between Ubc9 and SUMO is mechanistically significant. Specifically, following SUMOylation of substrates, the bound RanBP2–Ubc9 complex may facilitate the release of Ubc9 from the SUMOylated substrate.
Our FRET-based methods enable the analysis of equilibrium binding in small sample volumes of low concentrations, at a wide range of temperatures and buffer constituents. Furthermore, FRET is ideal for the study of binding partners in the presence of interacting molecules. A further advantage of fluorescent tags is that the absorbance of the probes provides a convenient and accurate determination of protein concentration, a parameter which is not easily accessible but essential, since precise knowledge of the concentrations is a critical parameter in the accurate determination of binding constants. In contrast, the use of tyrosine and tryptophan absorption at 280 nm to determine concentration requires these amino acids to be present and the protein to be denatured. Our technique for studying protein binding is readily applied to multi-well plate format, which allows for the repeated study of the same binding partners under varying conditions, e.g., before and after the addition of potential drug candidates. Proteins are easily labeled when expressed in fusion with cyan fluorescent protein ECFP (Karasawa et al. 2004) and yellow fluorescent protein Venus–YFP (Nagai et al. 2002) (referred to as CFP and YFP from now on) which are widely used as noninteracting tags (Miyawaki et al. 2003) and are shown not to inhibit binding when tagged at flexible termini.
Results
Autofluorescence and energy transfer
Diagrams of the expressed fusion proteins and FRET between tags are shown in Figure 1A. Absorption and emission spectra (excited at 400 nm) were recorded to confirm the fluorescence properties of the expressed fluorescent protein fusions. Spectra of CFP and YFP are shown in Figure 1B. SUMO1, Ubc9, and RanBP2 are nonfluorescent in this range (data not shown). Emission spectra of solutions of 1 μM CFP, 1 μM YFP, and 1 μM CFP–SUMO1 + 1 μM YFP–Ubc9 were contrasted to determine the occurrence of FRET, the dynamic range, and the detection limit, shown in Figure 1C. The solution containing CFP–SUMO1 + YFP–Ubc9 shows decreased CFP emission around 475 nm as well as a sharply increased YFP emission around 530 nm. This increase is significantly larger than can be accounted for by the direct excitation of 1 μM YFP, indicating that SUMO1 and Ubc9 have associated and their fluorescent tags have moved into the range required for energy transfer to occur (typically <10 nm).
Figure 1.

(A) Schematic diagrams of the 6-His-TEV fluorescent protein constructs, FRET signals arising between tags of bound proteins (excitation at 400 nm leads to emission at 530 nm) and the nonbinding case where no FRET takes place (excitation at 400 nm leads to emission at 475 nm). (B) Normalized absorption spectra (dashed lines) and emission spectra (solid lines, excitation 400 nm) of cyan fluorescent protein (CFP) and yellow fluorescent protein (YFP). (C) Fluorescence emission spectra (excitation 400 nm) demonstrating FRET between 1 μM CFP–SUMO1 and 1 μM YFP–Ubc9 fusion proteins (solid black line), emission of the individual components at this concentration (dashed lines) and the sum of their signals (gray solid line).
Steady-state binding assay
In order to determine the equilibrium binding constant Kd from FRET data, we set up a titration in which the acceptor-tagged protein is added to its donor-tagged partner while the emission spectra are monitored. Several processes are monitored in parallel, a control for nonspecific interactions and two further measurements of direct excitation of YFP and dilution of CFP. In the analysis we measure the increasing FRET component of the YFP spectrum at 530 nm, which is proportional to the number of bound pairs. The linear proportionality was validated with a reaction of double-tagged YFP–SUMO1–CFP cleaved at the SUMO1 C terminus by the protease SenP1, leading to a decrease in FRET. The rates were monitored with both electrophoresis gel time points and simultaneously collected fluorescence emission, and clearly demonstrate the full functionality of the fusion protein and validate the use of FRET measurements to quantify protein interactions (see Supplemental Fig. 1).
The emission spectra of the titration of YFP Ubc9 (10-μL increments, 55 μM) into CFP SUMO1 (3 mL, 1.1 μM) are shown in Figure 2A. FRET is observed as previously (see Fig. 1C). The 530-nm peak intensities are plotted in Figure 2B. The curved plot CFP–SUMO1 + YFP–Ubc9 is characteristic of binding. To control for nonspecific interactions, YFP–Ubc9 was titrated into CFP (not fused to SUMO1, same quantities as above). This leads to a linear increase in 530 nm emission (slope 7.56 μM−1). The same titration into buffer gives a measure of direct excitation of YFP, and is also linear (8.95 μM−1). Dilution of the 1.1 μM CFP–SUMO1 solution by an identical titration of buffer leads to a linear decrease (−1.97 μM−1). The sum of the dilution and direct excitation controls is plotted in Figure 2B (6.97 μM−1), and is almost identical to that obtained for the titration of YFP–Ubc9 into unfused CFP, indicating that nonspecific interactions are negligible.
Figure 2.

Steady-state FRET binding assay. (A) Fluorescence emission spectra (excitation 400 nm) recorded during the titration of YFP–Ubc9 into 1.1 μM CFP–SUMO1. YFP–Ubc9 was added in increments up to 8 μM. The solid black line is the pre-titration emission. (B) Fluorescence emission at 530 nm of the FRET binding assay: YFP–Ubc9 added to CFP–SUMO1 (solid black diamonds, data from spectra shown in A); control for nonspecific interactions, YFP–Ubc9 added to 1.1 μM CFP (gray squares); measurement of dilution, buffer added to CFP–SUMO1 (control 1, gray triangles); measurement of direct excitation, YFP–Ubc9 added to buffer (control 2, black triangles). The sum of controls 1 and 2 is displayed as a separate series (white triangles).
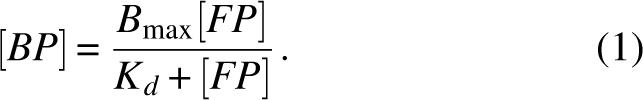
We analyze the data using the saturation level of the YFP emission to convert the FRET signal into the bound protein concentration. A plot of the binding data with the dilution and direct excitation controls subtracted is presented in Figure 3A. The saturation level, determined by an exponential fit, corresponds to 1.1 μM CFP–SUMO1 bound. Using this relation between FRET signal and bound species and a binding stochiometry of 1:1 (Liu et al. 1999), data are converted into the relative amount of bound CFP–SUMO1 and YFP–Ubc9. The free YFP–Ubc9 is calculated in a subtraction for each point and the axis rescaled to give the bound protein (BP) versus free YFP–Ubc9 (FP) binding curve shown in Figure 3B, fitted with the binding hyperbola for one binding site (Motulski and Christopoulos 2003)
Figure 3.

Steady-state FRET binding assay: data analysis. (A) FRET data as a function of total YFP–Ubc9 concentration, following the subtraction of controls accounting for dilution (control 1) and direct excitation (control 2). (B) Bound protein determined from the FRET data as a function of free YFP–Ubc9 concentration, fitted by a hyperbola with B max = 1.1 μM and Kd = 0.59 ± 0.09 μM.
 |
Fitting with B max = 1.1 μM (the maximum of bound protein) gives Kd = 0.59 μM ± 0.09 μM. This is in the same range as the value from isothermal titration calorimetry (ITC) results, Kd ITC = 0.25 μM with a quoted measurement error of 0.07 μM (Tatham et al. 2003b).
The binding assay was also applied in multi-well-plate format, which resulted in Kd = 0.56 ± 0.11 μM for YFP–Ubc9 and CFP–SUMO1. Hence, the FRET-based binding assay is suitable for small-volume and high-throughput measurements (see Materials and Methods; Supplemental Fig. 2).
Binding of Ubc9 to the E3 ligase RanBP2 was quantified in a titration of YFP–Ubc9 into CFP–RanBP2(l) (data not shown), yielding Kd = 0.17 ± 0.04 μM, which is also in the same range of the ITC results for this protein pair, Kd ITC = 0.41 ± 0.21 μM.
Time-resolved FRET binding assay
A second method of quantifying FRET consist of measuring the lifetime of the donor fluorophore (CFP) which decreases upon energy transfer to the acceptor (YFP). Unlike fluorescence intensities, lifetimes are independent of dilution; hence, the only control required is that for nonspecific interactions. Four time-correlated single photon counting (TCSPC) lifetime traces of the emission of CFP–SUMO1 (475 nm, 1 mL, 2 μM) during the titration of YFP–Ubc9 (as indicated), are presented in Figure 4A. The calculated single-exponential lifetimes are plotted as a function of YFP–Ubc9 concentration in Figure 4B. The lifetime decreases from 2.49 ns to 2.01 ns as a result of energy transfer, which agrees well with CFP lifetime measurements in literature (van Kuppeveld et al. 2002). The lifetime fully recovers by the further addition of CFP–SUMO1 (data not shown). In the analysis we compute the saturation level relating to 2 μM bound protein and subtract the bound protein from the total YFP–Ubc9 concentration at each point. This leads to the bound versus free YFP–Ubc9 binding curve shown in Figure 4C. The hyperbolic fit using Equation 1 gives Kd = 0.73 ± 0.15 μM using B max = 2 μM. This is in close agreement with the steady-state methods described above and isothermal titration calorimetry experiments (Tatham et al. 2003b). These results serve as a further validation of the quantitative use of FRET for binding studies.
Figure 4.

Time-resolved FRET binding assay. (A) Selected time-resolved fluorescence traces (excitation 397 nm, emission 475 nm) of solutions with various amounts of YFP–Ubc9 added to CFP–SUMO1, resulting in ratios of 1:0 (pre-titration, black), 1:1 (gray), 1:2 (dark gray), and 1:3 (light gray). The instrumental response is recorded by means of a scattering solution (dashed gray). (B) Fluorescence lifetimes of solutions of CFP-SUMO1 and varying YFP-Ubc9 concentrations. (C) Bound protein versus free YFP–Ubc9 calculated from the CFP lifetime at 475 nm.
Quantifying multi-protein binding
Following the establishment of FRET assays to quantify protein–protein binding, we expand our scope to multi-protein interactions and measure competition by means of the inhibition constant Ki. For this, potential interacting proteins are titrated into solutions of tagged binding partners, and spectra recorded as in the above section.
Figure 5A shows spectra during the titration of untagged RanBP2(l) (5 μL increments up to 3 μM) into CFP–SUMO1 + YFP–Ubc9 (1 mL, 1 μM equimolar). The initial emission peak at 530 nm decreases as RanBP2(l) is added, until the FRET signal is undetectable, indicating dissociation of the initial bound complex. A linear dilution control was performed and subtracted from the emission peak (data not shown). Data was fitted with an exponential and subsequently converted to % of CFP–SUMO1 + YFP–Ubc9 dissociated, giving the inhibition curve presented in Figure 5B. An exponential fit gives IC50 = 0.68 ± 0.06 μM, the amount of RanBP2(l) required to achieve 50% dissociation.
Figure 5.

Multi-protein binding assay. (A) Emission spectra (excitation 400 nm) of a three-protein binding titration, beginning with 1 μM CFP–SUMO1 and 1 μM YFP–Ubc9 solution adding in untagged RanBP2(l) in increments up to 3 μM as indicated. The arrow indicates the decrease in FRET signal at 530 nm. Dilution during the titration cancels the increase in the 475 nm peak due to decreasing energy transfer. (B) Inhibition curve displaying percent of initial CFP–SUMO1 + YFP–Ubc9 complex split as a function of RanBP2(l) added. Data are derived from the 530-nm peak decrease in A and fitted with a single exponential.
The inhibition constant Ki is the binding constant relating to the interaction of the bound complex with binding constant Kd with the inhibiting molecule and is readily derived from the IC50 value (Motulski and Christopoulos 2003):
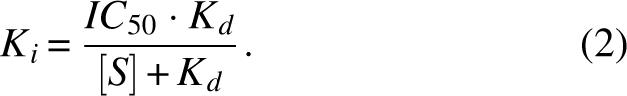 |
Using IC50 = 0.68 ± 0.06 μM, Kd = 0.59 ± 0.09 μM and [S] = 1.0 ± 0.05 μM (the concentration of initial binding protein) gives Ki = 0.25 ± 0.06 μM.
The inhibition of binding by third proteins is readily visualized by plotting the 530 nm/480 nm ratio, which isolates changes in energy transfer from dilution effects, but is not linearly proportional to the number of molecules undergoing FRET. Figure 6A shows the decrease in FRET ratio of CFP–SUMO1 + YFP–Ubc9 (quantities as above) as a function of RanBP2(l) and RanBP2(s) and SUMO1 (5-μL increments up to 3.1 μM). RanBP2(l) demonstrates stronger inhibition than RanBP2(s); however, in both titrations the signals saturate at the same level (530 nm/480 nm ratio of 0.63). The inhibition constant computed from fits of the 530 nm peak data of RanBP2(s) is IC50 = 1.04 ± 0.08 μM, and the resulting Ki = 0.38 ± 0.09 μM. Active inhibition is tested by adding SUMO1, which competes with its tagged and monitored counterpart CFP–SUMO1.
Figure 6.

(A) FRET signal monitored as the 530 nm/480 nm ratio for three titrations beginning with an equimolar solution of 1 μM CFP–SUMO1 and YFP–Ubc9 and adding SUMO1 (circles), RanBP2(s) (squares), and RanBP2(l) (diamonds). (B) FRET signal monitored as the 530 nm/480 nm ratio for a titration beginning with an equimolar solution of 1 μM CFP–RanBP2(1) and YFP–Ubc9 and adding SUMO1.
YFP–RanBP2(l) + CFP–SUMO1 did not display a FRET signal. Glutathione agarose affinity chromatography experiments were conducted to check binding of either RanBP2 fragment to SUMO1. SUMO1-binding affinity was detected for RanBP2(s) but none for RanBP2(l) (see Supplemental Fig. 3). Since RanBP2(l) binds Ubc9 and not SUMO1, the Ki of RanBP2(l) inhibiting SUMO1 and Ubc9 binding is equivalent to the Kd of RanBP2 and Ubc9, i.e., 0.17 ± 0.04 μM. The calculated Ki is close to the Kd but not smaller in value, which indicates that SUMO1 does not interfere in the interaction of the other two proteins following deconjugation from Ubc9. In fact, the inhibition constant from a titration of SUMO1 (5-μL increments up to 210 μM) into CFP–RanBP2(l) + YFP–Ubc9 (1 mL, 1 μM equimolar) shown in Figure 6B is Ki = 10.05 ± 2.66 μM (using IC50 = 69.2 ± 4.0 μM, [S] = 1.00 ± 0.05 μM and Kd = 0.17 ± 0.04 μM). This Ki is considerably higher than that determined for RanBP2(l), confirming that RanBP2 binds Ubc9 strongly while SUMO1 inhibits this interaction minimally.
Discussion
FRET between fluorescent protein tags provides a specific binding signal, utilized here as an optical method to quantify protein–protein binding and multi-protein interactions in vitro. At first we observe FRET due to the specific binding of SUMO1 to Ubc9 and contrast the signals to a nonbinding control (Figs. 1C, 2B).
In steady-state cuvette measurements, we utilize the increase of the acceptor emission at 530 nm as a direct measure of the quantity of bound protein, yielding data for binding curves. The hyperbolic fit in Figure 3B gives an equilibrium binding constant close to the one calculated by ITC (Tatham et al. 2003a) for both SUMO1–Ubc9 and RanBP2(l)–Ubc9. The size of the molecules and the location of the binding surfaces will impact on the efficiency of energy transfer and hence the dynamic range of the assay. Since FRET has an R−6 dependence on the distance between the flexibly attached fluorescent tags, the bulk monitored energy transfer is a weighted average dominated by the closest tags. The detection limit is 0.4 nM of bound complex based on the 3σ noise level of the spectra, the additional fluorescence due to FRET shown in Figure 1C, and the amount of bound protein in this equimolar solution determined from the binding curve. This detection limit is specific to the binding of SUMO to Ubc9 for the reasons mentioned above.
In multi-well-plate format, the FRET binding assay gives similar results, validating the use of this small and versatile format. In contrast to transient signals detected in binding methods such as ITC, this FRET-based method is ideally suited to repeated Kd measurements on the same sample under varying conditions (such as temperature), and under the further addition of compounds such as interacting proteins and potential drugs.
The time-resolved FRET binding assay measures the decrease in fluorescence lifetime of donor CFP-tagged protein as energy is transferred to an increasing amount of bound YFP-tagged protein. This effect is reversible as more CFP-tagged protein is added. As the titration progresses the decrease in lifetime levels off, giving the relation of the amount of bound protein to the shortest lifetime. Converting the data to the bound versus free protein plot and fitting the data gives a Kd that compares well with the steady-state measurements. Together with the comparison to ITC, these measurements validate the use of FRET as a signal of binding and quantitative measurement of the equilibrium binding curve.
The ECFP and Venus–YFP fluorescent proteins used here provide convenient fluorescent tags, since they are a spectrally well-suited FRET pair and possess enhanced quantum yields. Their fusion to the proteins of interest during the cloning stage renders further mutations and chemical labeling superfluous, and also simplifies the purification procedure (Chalfie et al. 1994). A validation experiment using double-tagged SUMO1 (see Supplemental Fig. 2) and the results above confirm that these tags do not reduce the functionality of proteins. Indeed, fluorescent tags increase the accuracy of Kd measurements since they enable the exact determination of the concentrations of the titration constituents by use of the known extinction coefficients of CFP and YFP. This method is superior to colorimetric chemical assays such as Bradford's assay, which are commonly inaccurate for small proteins or for those with unusual amino acid sequences. Another benefit of FRET-based assays is the sensitivity: only 6 nmol are required for a multi-well-plate format assay, including three controls in triplicate.
The major advantage of our FRET-based technique is the application to biochemical cascades and the acquisition of information on specific proteins within a complex of interactions. Our results show competition is readily studied by monitoring FRET signals of a tagged and bound protein pair during the addition of a third, untagged partner.
RanBP2(l)(2532–2767) titrated into CFP–SUMO1 and YFP–Ubc9 decreases the FRET signal to zero. This is due to a separation of the tags well beyond the Forster radius (>10 nm), i.e., the disruption of the bound complex. Since RanBP2(l) binds Ubc9 but not SUMO1 (see Supplemental Fig. 3), we can quantify the interaction of RanBP2(l) with the SUMO1–Ubc9 complex using inhibition relations. The resulting inhibition constant Ki is moderately larger than the binding constant for RanBP2(l) and Ubc9 determined by FRET, indicating that binding to Ubc9 is just slightly weakened by the presence of SUMO1. The effect of SUMO1 on the binding of CFP–RanBP2(l) to YFP–Ubc9 was shown to be significantly weaker. This is in accord with the binding constants which show a stronger affinity of Ubc9 to RanBP2(l) over SUMO1, impeding the binding of SUMO1 to Ubc9 in the presence of RanBP2(l). The same titration with RanBP2(s), which binds both SUMO1 and Ubc9, also interestingly results in a decrease to zero, although multiple mutual binding sites are present and theoretically a trimeric complex could form. Indeed, a trimeric complex is formed if SUMO1 and Ubc9 are covalently linked in the final conjugation stage of SUMO1 (Reverter and Lima 2005). The formation of this complex has been shown to catalyze SUMOylation, and our results emphasize the necessity of the covalent SUMO1–Ubc9 bond for substrate conjugation.
Materials and Methods
cDNA cloning, protein expression, and purification
cDNA encoding SUMO1 wild type and Ubc9 was amplified by PCR, digested with BamH1 and EcoRI (just BamH1 for SUMO1), and ligated into similarly cleaved pHIS–TEV, pHIS–TEV–ECFP, and pHIS–TEV–Venus–YFP plasmids (see Martin et al. 2007 for details of plasmids). In the document text the terms CFP and YFP are substituted for the full fluorescent protein names for simplicity.
cDNA encoding a short fragment of RanBP2(s) (residues 2633–2762, IR1-M-IR2) and a larger fragment of RanBP2(l) (residues 2532–2767) (Tatham et al. 2005) was cloned into pHIS–TEV as described previously (Tatham et al. 2005). cDNA encoding RanBP2(l) (2532–2767) (Tatham et al. 2005) was also subcloned into pHIS–TEV–ECFP. Bacterial expression from this construct produces ECFP–RanBP2(l).
All plasmids containing SUMO1 and Ubc9, as well as pHIS–TEV–ECFP and pHIS–TEV–Venus–YFP were expressed in Escherichia coli BL21 DE3 and purified by Ni2+-NTA sepharose affinity chromatography. Plasmids containing RanBP2 were expressed in E. coli B834 and purified as described (Tatham et al. 2005). All proteins were stored at −70°C in 20 mM NaCl, 50 mM Tris–HCl pH 7.5, 5 mM β-mercaptoethanol. Recombinant protein identities were confirmed by MALDITOF mass spectrometry (University of St. Andrews Mass Spectrometry Unit, UK).
All Venus–YFP and ECFP protein concentrations were determined using the peak absorption of a set of dilutions and the extinction coefficients for ECFP 28,750 M−1 cm−1 at 435 nm (Karasawa et al. 2004) and Venus–YFP 92,000 M−1 cm−1 at 515 nm (Nagai et al. 2002). From this, a 1-μM ECFP solution has a peak absorbance of 0.0288, a Venus–YFP solution of 0.0922.
Absorption and fluorescence measurements
Samples were measured in 3.5-mL quartz cuvettes (Hellma Scientific, 10-mm path length). Absorption spectra were recorded on a Cary 300 absorption spectrometer. Excitation and emission spectra were recorded on a Cary Eclipse fluorimeter (excitation 400 nm, 5-nm slit width, 1-nm intervals, 1-s integration, spectra corrected for instrument response). Excitation at 400 nm improves the dynamic range as the YFP excitation is at a minimum. Measurements were performed at a constant 21°C maintained by a water Peltier system and solutions mixed by inversion.
Multi-well plate assay
Multi-well plates were measured on a BMG Labtech NOVOstar fluorimeter (bottom excitation and collection, excitation filter: 405-20, dual emission collection 480-10 and 530-10). Three dilution series of YFP–Ubc9 were dispensed in triplicate in 3 × 28 wells (15 μL each; to be topped up to 20 μL) in black, clear-bottom 384-well plates (Greiner 3811). The final concentration ranges were 0.0 μM–7.5 μM in 15 steps of 0.1 μM followed by 12 steps of 0.5 μM. Wells were topped up with 5 μL of 4 μM CFP–SUMO1, CFP, or buffer using an automated pipettor. Following the verification that no nonspecific interactions were recorded, the CFP + YFP–Ubc9 data was subtracted from the CFP–SUMO1 + YFP–Ubc9 data and the binding curve analyzed as discussed in the Results section. Measurements were repeated for YFP–Ubc9 and CFP–RanBP2(l).
Time-resolved measurements
Fluorescence lifetimes were recorded with a time-correlated single photon counting (TCSPC) system (Hungerford and Birch 1996), exciting with a pulsed laser diode (393 nm, 60 ps pulse duration). Lifetime traces were recorded with the monochromator at 475 nm, 8-nm slit width, collection time of 10,000 counts in the peak channel. A filter ensured that scattered excitation light did not reach the photon counting detector (Hamamatsu microchannel plate-photomultiplier tube, situated at 90° to the excitation system). The instrument response was recorded using scattering solutions (LUDOX) at 393 nm (without filter) and is shown in Figure 4A. Data was fitted to a sum of exponential decays using iterative reconvolution in the IBH DAS6 decay analysis software.
Electronic supplemental material
The supplemental material consist of:
Validation of linearity of signals and noninterference of fluorescent protein tags;
FRET multi-well plate assay results;
the affinity of two RanBP2 fragments for SUMO1 by glutathione affinity chromatography.
Acknowledgments
The authors thank the DNA Sequencing Unit at the University of Dundee and the Mass Spectrometry Facility at the University of St. Andrews. We also wish to thank Malcolm White for equipment use and the EPSRC and the University of St. Andrews for financial support.
Footnotes
Supplemental material: see www.proteinscience.org
Reprint requests to: Ifor D.W. Samuel, School of Physics and Astronomy, University of St. Andrews, St. Andrews KY16 9SS, UK; e-mail: idws@st-andrews.ac.uk; fax: 0044-1334-46-3104.
Abbreviations: FRET, fluorescence resonance energy transfer; SUMO, small ubiquitin-like modifier; ITC, isothermal titration calorimetry; ECFP, enhanced cyan fluorescent protein; YFP, yellow fluorescent protein; Kd, equilibrium dissociation constant; Ki, equilibrium inhibition constant; IC50, 50% inhibiting concentration.
Article and publication are at http://www.proteinscience.org/cgi/doi/10.1110/ps.073369608.
References
- Chalfie, M., Tu, Y., Euskirchen, G., Ward, W.W., Prasher, D.C. Green fluorescent protein as a marker for gene expression. Science. 1994;263:802–805. doi: 10.1126/science.8303295. [DOI] [PubMed] [Google Scholar]
- Hay, R.T. SUMO: A history of modification. Mol. Cell. 2005;18:1–12. doi: 10.1016/j.molcel.2005.03.012. [DOI] [PubMed] [Google Scholar]
- Hochstrasser, M. Evolution and function of ubiquitin-like protein-conjugation systems. Nat. Cell Biol. 2000;2:153–157. doi: 10.1038/35019643. [DOI] [PubMed] [Google Scholar]
- Hungerford, G., Birch, D.J.S. Single-photon timing detectors for fluorescence lifetime spectroscopy. Meas. Sci. Technol. 1996;7:121–135. [Google Scholar]
- Karasawa, S., Araki, T., Nagai, T., Mizuno, H., Miyawaki, A. Cyan-emitting and orange-emitting fluorescent protein as donor/acceptor pair for fluorescent resonance energy transfer. Biochem. J. 2004;381:307–312. doi: 10.1042/BJ20040321. [DOI] [PMC free article] [PubMed] [Google Scholar]
- Liu, Q., Jin, C., Liao, X., Shen, Z., Chen, D., Chen, Y. The binding interface between an E2 (Ubc9) and a ubiquitin homologue (UBL1) J. Biol. Chem. 1999;274:16979–16987. doi: 10.1074/jbc.274.24.16979. [DOI] [PubMed] [Google Scholar]
- Martin, S.F., Hattersley, N., Samuel, I.D.W., Hay, R.T., Tatham, M.H. A fluorescence-resonance-energy-transfer-based protease activity assay and its use to monitor paralog-specific small ubiquitin-like modifier processing. Anal. Biochem. 2007;363:83–90. doi: 10.1016/j.ab.2006.12.018. [DOI] [PubMed] [Google Scholar]
- Melchior, F., Schergaut, M., Pichler, A. SUMO: Ligases, isopeptidases and nuclear pores. Trends Biochem. Sci. (TIBS) 2003;105:612–618. doi: 10.1016/j.tibs.2003.09.002. [DOI] [PubMed] [Google Scholar]
- Miyawaki, A., Sawano, A., Kogure, T. Lighting up cells: Labelling proteins with fluorophores. Nat. Cell Biol. 2003;5:S1–S7. [PubMed] [Google Scholar]
- Mo, Y.Y., Moschos, S.J. Targeting Ubc9 for cancer therapy. Expert Opin. Ther. Targets. 2005;9:1203–1216. doi: 10.1517/14728222.9.6.1203. [DOI] [PubMed] [Google Scholar]
- Motulski, H.J., Christopoulos, A. Fitting models to biological data using linear and nonlinear regression: A practical guide to curve fitting. GraphPad Software, Inc; San Diego, CA: 2003. [Google Scholar]
- Nagai, T., Ibata, K., Park, E.S., Kubota, M., Mikoshiba, K., Miyawaki, A. A variant of yellow fluorescent protein with fast and efficient maturation for cell-biological applications. Nat. Biotechnol. 2002;20:87–90. doi: 10.1038/nbt0102-87. [DOI] [PubMed] [Google Scholar]
- Reverter, D., Lima, C.D. Insights into E3 ligase activity revealed by a SUMO–RanGAP1–Ubc9–Nup358 complex. Nature. 2005;435:687–692. doi: 10.1038/nature03588. [DOI] [PMC free article] [PubMed] [Google Scholar]
- Schwartz, D.C., Hochstrasser, M. A superfamily of protein tags: Ubiquitin, SUMO and related modifiers. Trends Biochem. Sci. 2003;28:321–328. doi: 10.1016/S0968-0004(03)00113-0. [DOI] [PubMed] [Google Scholar]
- Tatham, M.H., Hay, R.T., Chen, Y. Role of two residues proximal to the active site of Ubc9 in substrate recognition by the Ubc9·SUMO-1 thiolester complex. Biochemistry. 2003a;42:3168–3179. doi: 10.1021/bi026861x. [DOI] [PubMed] [Google Scholar]
- Tatham, M.H., Kim, S., Yu, B., Jaffray, E., Song, J., Zheng, J., Rodriguez, M.S., Hay, R.T., Chen, Y. Role of an N-terminal site of UBC9 in SUMO-1, -2 and -3 binding and conjugation. Biochemistry. 2003b;42:9959–9969. doi: 10.1021/bi0345283. [DOI] [PubMed] [Google Scholar]
- Tatham, M.H., Jaffray, E., Chen, Y., Hay, R.T., Kim, S., Song, J. Unique binding interactions among Ubc9, SUMO and RanBP2 reveal a mechanism for SUMO paralog selection. Nat. Struct. Mol. Biol. 2005;12:67–74. doi: 10.1038/nsmb878. [DOI] [PubMed] [Google Scholar]
- van Kuppeveld, F.J.M., Melchers, W.J.G., Willems, P., Gadella, T.W.J. Homomultimerization of the coxsackievirus 2B protein in living cells visualized by fluorescence resonance energy transfer microscopy. J. Virol. 2002;76:9446–9456. doi: 10.1128/JVI.76.18.9446-9456.2002. [DOI] [PMC free article] [PubMed] [Google Scholar]
- Waksman, G. Proteomics and protein–protein interactions: Biology, chemistry, bionformatics, and drug design. Springer; New York: 2005. [Google Scholar]
- Wilson, V.G. Sumoylation: Molecular biology and biochemistry. Horizon Bioscience; Norfolk, UK: 2004. [Google Scholar]
- Yeh, E.T.H., Gong, L.M., Kamitani, T. Ubiquitin-like proteins: New wines in new bottles. Gene. 2000;248:1–14. doi: 10.1016/s0378-1119(00)00139-6. [DOI] [PubMed] [Google Scholar]