Abstract
The crystal structure of Escherichia coli ribonuclease I (EcRNase I) reveals an RNase T2-type fold consisting of a conserved core of six β-strands and three α-helices. The overall architecture of the catalytic residues is very similar to the plant and fungal RNase T2 family members, but the perimeter surrounding the active site is characterized by structural elements specific for E. coli. In the structure of EcRNase I in complex with a substrate-mimicking decadeoxynucleotide d(CGCGATCGCG), we observe a cytosine bound in the B2 base binding site and mixed binding of thymine and guanine in the B1 base binding site. The active site residues His55, His133, and Glu129 interact with the phosphodiester linkage only through a set of water molecules. Residues forming the B2 base recognition site are well conserved among bacterial homologs and may generate limited base specificity. On the other hand, the B1 binding cleft acquires true base aspecificity by combining hydrophobic van der Waals contacts at its sides with a water-mediated hydrogen-bonding network at the bottom. This B1 base recognition site is highly variable among bacterial sequences and the observed interactions are unique to EcRNaseI and a few close relatives.
Keywords: X-ray, structure–function relation, ribonuclease, substrate specificity, base specificity, RNase
Escherichia coli is by all means the most intensively studied organism on earth. Despite the wealth of genetic and biochemical studies, the availability of its complete genomic DNA sequence and intense efforts in proteomics, we remain far from a complete understanding of E. coli metabolism and physiology. E. coli produces over 20 different endo- and exo-ribonucleases with varying roles ranging from scavenger enzymes to stress-response mediators that regulate the pace of the general metabolism and highly specialized enzymes involved in rRNA, tRNA, or mRNA maturation and mRNA turnover (Nicholson 1997; Buts et al. 2005). E. coli RNase I (EcRNase I) is a 27-kDa monomeric base nonspecific endoribonuclease that belongs to the T2 family (Meador III and Kennell 1990). This family of RNases is of interest, because it is the only family known to have members in all kingdoms of life. T2 family members have been found in fungi, lower and higher animals, as well as in plants (Irie 1997) and include the S-RNases associated with gametophytic self-incompatibility (McClure et al. 1989). T2 RNases typically show only limited substrate specificity (Irie 1999), which contrasts with most other ribonuclease families, although there are some notable exceptions such as RNase MC1 from bitter gourd (Suzuki et al. 2000).
At present, most structural and biochemical studies on T2 family RNases focus on RNase Rh from the fungus Rhizopus niveus and on plant RNases, while very little is known about their bacterial homologs, such as EcRNase I. Crystal structures are available for Nicotiana alata and Pyrus pyrifolia RNases associated with gametophytic self-incompatibility (Ida et al. 2001; Matsuura et al. 2001), the wound-inducible RNases NW and NT from Nicotiana Glutinosa leaves (Kawano et al. 2002, 2006), RNase LE from cultured tomato cells (Tanaka et al. 2000), RNase MC1 from bitter gourd (Nakagawa et al. 1999), and RNase Rh from the filamentous fungus R. niveus (Kurihara et al. 1996). For the bacterial or animal homologs, no crystal structures are available.
Despite being known since 1964 (Neu and Heppel 1964), EcRNase I has received little attention and only limited data have been published on its properties. EcRNase I is a scavenger endoribonuclease present in the periplasm, allowing the recruitment of nucleotides from RNA present in the environment. A non-disulfide bonded version of EcRNase I, known as RNase I*, remains in the cytoplasm (Cannistraro and Kennell 1991). EcRNase I has recently been shown to be a valuable model-protein for the study of oxidative folding in vivo and in vitro (Messens et al. 2007). For these reasons, as well as to obtain a better understanding of the structure–function relationship of EcRNase I, we determined the crystal structure of the free enzyme and its complex with a decadeoxynucleotide.
Results
Overall structure of a bacterial T2 family member
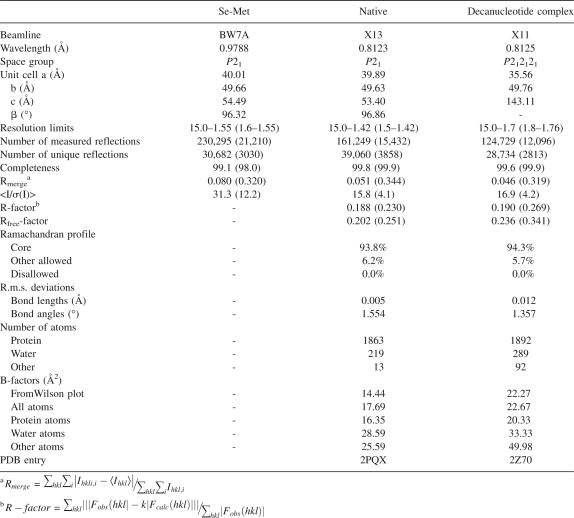
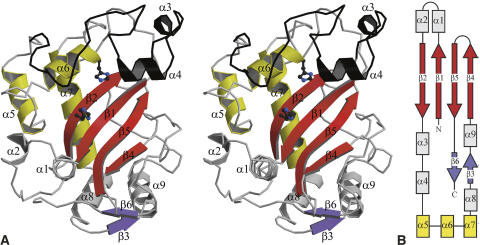
The crystal structure of EcRNase I was determined at high resolution in its free state and in complex with the decadeoxynucleotide d(CGCGATCGCG) (Table 1). The overall structure is reminiscent of the RNase T2 fold that was previously observed in RNase Rh from R. niveus and several RNases from higher plants (Figs. 1, 2A). It consists of a four-stranded antiparallel β-sheet (strands β1, β2, β4, and β5) decorated with six larger (α1, α4, α5, α6, α7, α8, and α9) and two smaller (less than two turns, α2 and α3) α-helices and a small two-stranded antiparallel β-sheet (strands β3 and β6). The major part of the protein is well defined, as it has very clear electron density and is characterized by low atomic B-factors. The only exception is a long loop in the N-terminal half of the protein, Arg31–Lys48, which shows high B-factors and for which the electron density appeared only late during the refinement. This region seems to be intrinsically more mobile, but the observed conformation is unaffected by the presence of the ligand or crystal environment. The main β-sheet, which forms the center of the molecule, is the most rigid part of the molecule with B-factors for the main chain atoms in the range of from 8 to 12 Å2. The structures of EcRNase I in its free and liganded state are very similar without any significant difference in backbone conformation indicating a lock-and-key type of binding. The hydrophobic core contains a small cavity (10.00 Å3) bordered by atoms of the side chains of Leu18, Leu52, Ile155, Lys156, Ala160, Leu164, Phe177, Phe181, Trp185, Ile207, and Ile209. This cavity is entirely hydrophobic and does not contain any ordered water molecule.
Table 1.
Data collection and refinement statistics
Figure 1.
Overall structure of EcRNase I. (A) Stereoview of a ribbon diagram of EcRNase I. Conserved structural elements are colored: β-strands 1, 2, 4, and 5 forming the major β-sheet in red, β-strands 3 and 6 forming the minor β-sheet in purple, and α-helices 5, 6, and 7 in yellow. The stucturally nonconserved regions including α-helices 1, 2, 3, 4, 8, and 9 are shown in gray. The “rim” region (Leu61–Glu101) is highlighted in black. See Materials and Methods for details about the selection of structurally conserved regions. (B) Topology diagram of EcRNase I using the same color coding as in A.
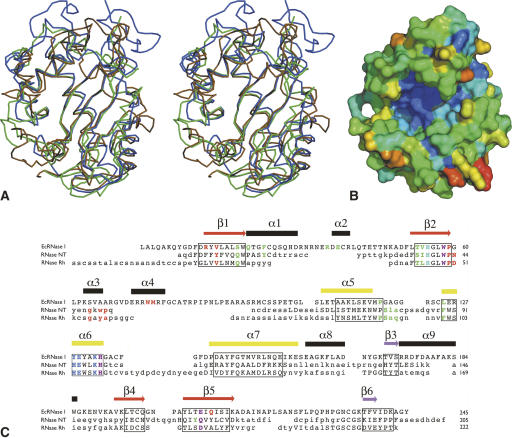
Figure 2.
Variability in the RNase T2 fold. (A) Superposition of the Cα-trace of EcRNase I (ochre) with those of RNase NT from N. Glutinosa as a plant representative (green) and RNase Rh from Rhizopus niveus as a fungal representative (blue). (B) Molecular surface showing residue conservation in bacterial T2-family RNases. The conservation score is color coded, going from dark blue (fully conserved) over light blue, green, yellow, and orange to red (most variable). The view of this surface is roughly identical to the one in Figure 1A. (C) Structure-based sequence alignment of EcRNase I, the plant RNase NT, and the fungal RNase Rh. Secondary structure elements of EcRNase I are indicated above the sequence and color-coded as in Figure 1. Residues that are structurally equivalent to those in EcRNase I are in uppercase. For the residues in lowercase, no structural equivalence is observed. The residues belonging to the structurally conserved core defined using all available RNase T2 coordinates are boxed. Functionally relevant residues are colored in the sequences: B1 site (red), catalytic site (blue), common to B1 site and catalytic site (purple), B2 site (green), common to B2 site and catalytic site (cyan).
A BLAST search with the EcRNase I sequence yields 144 sequences of bacterial origin from the combined SwissProt and trEMBL databases (supplemental Fig. S1). Many of these are linked to an additional N-terminal domain (around 90–140 amino acids). A multiple alignment of these sequences yielded amino acid conservation scores showing, besides the hydrophobic core residues, very high conservation only for amino acids belonging to the active site of the enzyme: Ser19, His55, Trp58, Leu125, Tyr128, Glu129, Lys132, His133, and Glu206 (Fig. 2B). Around this conserved surface, there is a large perimeter of moderately conserved residues. The opposite side of the protein surface contains the most variable amino acids, suggesting it plays no direct functional role.
Bacterial versus plant and fungal RNases
Despite displaying the RNase T2 fold, EcRNase I shows less than 35% sequence identity with plant RNase T2 family members and less than 15% sequence identity with fungal and animal members (Fig. 2C). As a consequence, the crystal structures of bacterial, plant, and fungal RNase T2 family members display significant variability (Fig. 2B,C). Based upon seven available crystal structures, a common core can be defined consisting of all six β-strands as well as helices α5, α6, and α7 (Figs. 1, 2C). A helix is also present in all structures in the neighborhood of α9, but its relative position and orientation is more variable such that it does not fit in our rather stringent definition of common core (see Materials and Methods). Not surprisingly, all residues that are expected to directly or indirectly play a role in catalysis are located in this structural core, in particular strands β2 (His55, Trp58) and β5 (Glu206) and helix α6 (Tyr128, Glu129, Lys132, His133). Outside of this common core, structures between plant, fungal, and bacterial RNase T2 family members can vary widely (Fig. 2A,C). Of the four disulfides in EcRNase I, only the one between Cys194 and Cys232 is located in the common core. The other three disulfides of EcRNase I are not conserved in other RNases, though there are examples of disulfides that are positioned close in space to one or other of these three EcRNase I disulfides. EcRNase I-specific elaborations on this basic fold include a large region (Leu61–Glu101) between β2 and α5, which encompasses the shorter α-helices, α3 and α4. This stretch forms a rim on one side of the active-site groove, which is absent in all plant ribonuclease structures (Fig. 1; supplemental Fig. S1). In the catalytically inactive RNase-related CalsepRRP from Calystegia sepium (Rabijns et al. 2002), a unique long hairpin loop between α5 and α6 partly fills the volume of the EcRNase I Leu61–Glu101 region. In the fungal RNase Rh, a much smaller rim region (Lys52–Ala68) is observed. Thus, as a consequence, the active-site groove of EcRNase I is deeper than the ones observed in all other RNase T2 structures to date. This rim region is highly variable in the bacterial sequences as well and is expected to show significant structural variability between different bacterial RNases. The opposite border of the active site groove (hairpin loop Gly199–Ala202 and the connecting loop between β5 and β6 Gln229–Lys236) shows less drastic structural variability. The conformation of the latter loop in EcRNase I is close to the one observed in RNase Rh.
A hypervariable nonselective B1 base recognition site
Studies on RNases MC1, NW, and NT (Suzuki et al. 2000; Kawano et al. 2002, 2006) revealed that T2-family RNases possess two distinct base recognition sites flanking the catalytic residues. These are called the B1 (at the 5′ end of the scissile phosphodiester bond) and B2 (at the 3′ end of the scissile bond) sites. Most mononucleotide complexes of plant and fungal RNases have only the B2 site occupied. Only for RNase NT are structures available with 5′-AMP, 5′-GMP, and 2′-UMP occupying the B1 site.
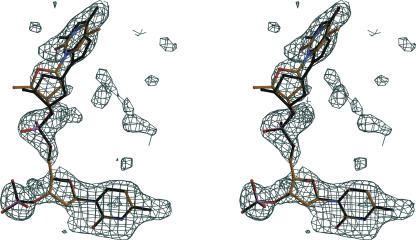
In the complex formed by EcRNase I and d(CGCGATCGCG), the decanucleotide is largely disordered and only density for a dinucleotide segment is visible in the active-site region. The bases of this dinucleotide segment occupy the B1 and B2 sites (Fig. 3). The fractional occupancy of this dinucleotide is estimated at 0.7, indicating that the binding is weak. This agrees with soaking and co-crystallization experiments with mononucleotides in the ligand-free crystals where no binding was observed (see Materials and Methods). The electron density for the base present in the B1 site was interpreted as a mixture of thymine and guanine, both of which occur 5′ to cytosine in our decanucleotide. In the B2 site, a cytosine was modeled. Thus, the decanucleotide is not bound in a unique way but rather shows two or three distinct binding positions on the protein. No significant conformational differences are observed between the ligand-bound and the ligand-free structure.
Figure 3.
Electron density for d(T/GpCp) bound in the active site of EcRNase I. Stereoview of the electron density (SA-OMIT map) calculated for the dinucleotide bound to the active site, which was interpreted as a mixture of d(TC) (colored) and d(GC) (black). The map is contoured at 2.2 σ. Although clearly present, the density for the oligonucleotide is weaker than that for the protein, and the total occupancy was estimated to be 0.7. d(TpCp) and d(GpCp) were both modeled with occupancies of 0.35.
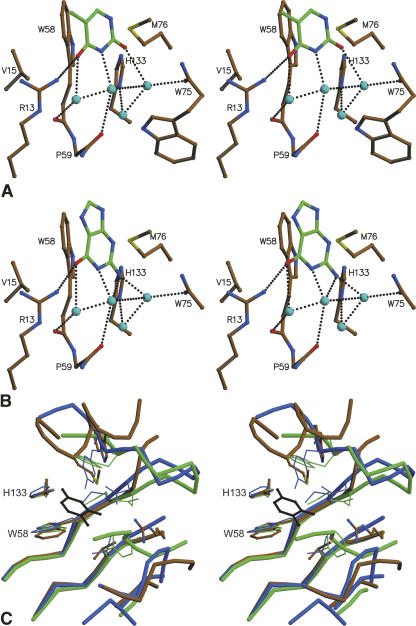
All residues interacting with the base in the B1 site (either direct or via a water bridge) are indicated in Figure 2C. The base in the B1 site stacks parallel to the side chain of Trp58 (Fig. 4A,B). This tryptophan is completely conserved among the different kingdoms (Fig. 2C; supplemental Fig. S1). All other direct interactions, which involve van der Waals contacts with the side chains of Met76, and to a lesser extent Val15 and Trp75 as well as a hydrogen bond between the carbonyl oxygens on C4 (thymine) or C6 (guanine) with the side chain of Arg13, are unique to the E. coli enzyme and its closest relatives. Even within the bacteria, these residues are poorly conserved, making the B1 site highly variable. In general, not only the side chains, but also some of the backbone conformations around the B1 site vary drastically between EcRNase I, RNase Rh, and the different plant RNases for which crystal structures are available (Fig. 4C). Thus, most of the environment around the B1 site is variable and the base:protein interactions observed in the EcRNase I complex are largely unique.
Figure 4.
Interactions in the B1 site. (A) Thymine binding in the B1 site. (B) Guanine binding to the B1 site. Protein residues are colored according to atom type: carbon, brown; oxygen, red; nitrogen, blue; and sulfur, yellow. For the bound base, carbon atoms are shown in green. Water molecules are shown as light blue spheres. Hydrogen bonds are indicated by dotted lines. Relevant amino acids are labeled. (C) Superposition of the B1 sites of EcRNase I (color-coded by atom type, backbone in ochre), RNase NT from Nicotiana Glutinosa leaves (green) and RNase Rh from Rhizopus niveus (blue). Thymine bound in the B1 site of EcRNase I is shown in black.
Most remarkable, however, is a series of three water molecules in the bottom of the B1 binding cleft that bridge the base to the protein (Fig. 4A,B). Except for the single direct hydrogen bond mentioned above, all hydrogen-bonding requirements of the bases are fulfilled using ordered water molecules, and each can act as donor or acceptor, depending on the nature of the bound base. In this way, a true aspecific binding site is generated by a mechanism that, to our knowledge, has not been described before for ribonucleases. Only one of these three waters is pre-positioned in the ligand-free structure. Several water molecules are also expelled from the binding site upon ligand binding, including two waters that mimic the methyl group C5 and the carbonyl O2 of thymine and one water, which is expelled by a movement of the side chain of Arg13 compared with the ligand-free structure.
Cytosine selection in the B2 base recognition site
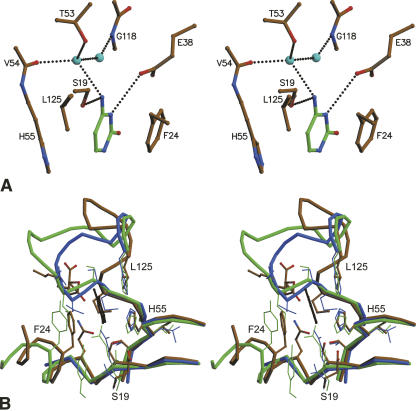
The electron density for the ligand in the B2 site is very well defined and can only be interpreted as a cytosine. All interacting residues (either direct or via a water bridge) are indicated in Figure 2C. The base is sandwiched between the aromatic rings of His55 and Phe24 in a parallel stacking interaction (Fig. 5A). Additional van der Waals contacts occur with the side chain of Leu125 and direct hydrogen bonds are present between the hydroxyl group of Ser19 and the NH2 group (N4) of cytosine and between the side chain of Glu38 and N3 of cytosine. Finally, a water molecule bridges the same NH2 group with the hydroxyl group of Thr53. No obvious hydrogen-bond partners are present for the carbonyl on C2 or for N3. Only His55 is conserved in bacteria, fungi, and plants, as well as in animals (Fig. 2C; supplemental Fig. S1) and plays a dual catalytic/recognition role.
Figure 5.
Interactions in the B2 site. (A) Interactions of cytosine bound to the B2 site in EcRNase I. Protein residues are colored according to atom type: carbon, brown; oxygen, red; nitrogen, blue; and sulfur, yellow. For the bound base, carbon atoms are shown in green. Water molecules are shown as light blue spheres. Hydrogen bonds are indicated by dotted lines. Relevant amino acids are labeled. (B) Superposition of the B2-sites of EcRNase I (color-coded by atom type, backbone in ochre), RNase NT from Nicotiana Glutinosa leaves (green), and RNase Rh from Rhizopus niveus (blue). Guanine bound in the B1 site of EcRNase I is shown in black.
Ser19, Phe24, and Leu125 are well conserved within the bacterial sequences, but not in plant, fungal, and or animal sequences (Fig. 5B; supplemental Fig. S1). Phe24 is usually Phe or Tyr in plant RNases, but can also be truncated to smaller side chains such as Val. Being located in α1 outside the common core, it has no structural equivalent in the fungal RNase Rh. Leu125 is mostly Phe in plants, with some notable exceptions such as Asp in CalsepRRP form Calystegia sepium.
Ser19 is substituted to Thr10 in the self-incompatibility-related RNase SF11, allowing for equivalent interactions with a bound base. All other plant RNase structures, as well as RNase Rh, have Gln at this position (Figs. 2C, 5B; supplemental Fig. S1). This bulkier side chain results in a less deeply bound base, as is observed in the 5′-GMP complexes of RNases NT and NW, and the 5′-UMP complex of RNase MC1. Finally, Thr53 is the most variable residue constituting the B2 site. Yet, most substitutions in bacterial sequences are isosteric: Ser, Val, or Ile.
A novel B3 base recognition site
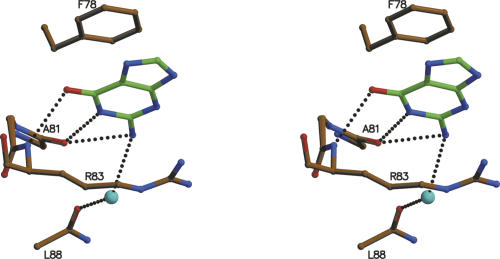
An unexpected third base binding site is observed about 16 Å from the catalytic site (Fig. 6). Here, clear density is observed for a guanine base in a parallel stacking between the side chains (Matsuura et al. 2001) of Phe78 and Arg83 and hydrogen bonding to the backbone NH of Arg83 and the backbone carbonyl of Ala81. A water bridge is formed with the backbone carbonyl of Leu88. The biological significance of this third base binding site remains unclear. Phe78 and Arg83 are conserved only in the closest relatives of E. coli. This part of the amino acid sequence is highly variable and frequently contains deletions, even in other bacterial RNases. Thus, it is doubtful that this is a functional site and binding of guanine at this site may be a fortuitous event.
Figure 6.
Stereoview of the novel B3 base-binding site containing a guanine base. Relevant amino acids are labeled. Color-coding is as in Figure 4A.
Catalytic site or P1 site
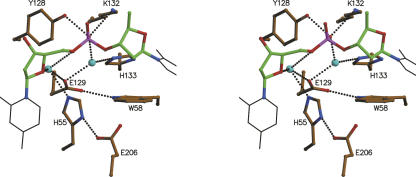
With the exception of Ser19, all highly conserved residues in the bacterial RNase T2 sequences are part of the catalytic site: His55, Trp58, Tyr128, Glu129, Lys132, His133, and Glu206. All of these residues have equivalents in the different structures of fungal and plant RNases, and catalytic roles have been attributed to them (Kurihara et al. 1996; Nakagawa et al. 1999; Ida et al. 2001; Matsuura et al. 2001; Kawano et al. 2002, 2006). By analogy with the plant and fungal ribonucleases, His55 would be the catalytic acid and His133 the catalytic base in EcRNase I. In contrast to observations on a number of mononucleotide complexes of RNase MC1 and NW, neither His55 nor His133 of EcRNase I interact directly with the internal backbone phosphate of the dinucleotide d(G/TC). Rather, this phosphate group is linked to the catalytic site via two water molecules (Fig. 7). These two waters are prepositioned in the ligand-free structure. For the catalytic mechanism, this raises two possibilities.
Figure 7.
Catalytic site of EcRNase I. Stereoview of the interactions in the catalytic or P1 site of EcRNase I. Shown are the relevant active site residues as well as the ribose-phosphate-ribose moiety in ball and stick and the cytosine and thymine bases as thin black lines. Other color-coding is as in Figure 4A. Relevant amino acids are labeled.
First, the two water molecules observed are catalytic waters. In this case, the cleavage of the phosphodiester bond of the substrate would occur in a fashion completely parallel to the slow uncatalyzed hydrolysis of RNA in an aqueous environment. Rate enhancement then comes from the activation of these two water molecules by the nearby “catalytic” residues His55 and His133.
A second and alternative interpretation is that in the structure of the complex, the observed nucleotide conformation is a nonproductive one. The absence of the 2′OH groups may alter the binding mode of the oligonucleotide or we might observe an “initial” binding mode that occurs prior to the “catalytic” binding mode. The large number of studies on ribonuclease T1 and its homologs (Sevcik et al. 1993; Zegers et al. 1998) and on RNase A (Aguilar et al. 1992) have shown that such phenomena may indeed occur and that substrates may initially bind in a nonproductive manner which, in a second step, is transformed into the productive binding mode in which water molecules are expelled from the active site and the phosphate oxygens position themselves correctly relative to the two histidines. As this is the first RNase T2 family member for which a crystal structure is available with a ligand other than a mononucleotide, no definite conclusion can be drawn.
Discussion
We determined the crystal structure of E. coli ribonuclease I at high resolution both in its free and in a bound state. The most striking observation is variability of the base recognition sites among RNase T2 members and the unique strategy used by EcRNase I. Water molecules are often seen to complement the interface between a protein and its ligand (Janin 1999; Raschke 2006). The role of such buried waters has been discussed many times over. Although several authors claim that they contribute to affinity based upon mutagenesis studies and solvent exchange studies, thermodynamic cycle analysis has suggested the absence of a net contribution in an aqueous environment (Langhorst et al. 2000). There is strong evidence, however, that interfacial waters may contribute to specificity, increasing the complementarities between protein and ligand surface. Indeed, some spectacular examples exist where ordered water dominates the polar interactions in macromolecular complexes. An early example is an E. coli tryptophane repressor–operator complex where all polar interactions with the DNA bases occur via water molecules (Otwinowski et al. 1988). Although controversial at first, it was later confirmed that this structure is the biologically relevant one and that the water-mediated interactions contribute to DNA sequence specificity (Joachimiak et al. 1994).
In the crystal structure of EcRNase I in complex with a substrate-mimicking piece of single-strand DNA, the B1 site uses a series of water bridges rather than direct hydrogen bonds to allow recognition of different bases independent of their exact hydrogen-bonding pattern. Such a strategy is powerful, as the hydrogen-bonding potential of water allows it to act as a donor–acceptor switch connecting polar groups that otherwise would not be able to pair in hydrogen bonds. Thus, by sandwiching a base between hydrophobic or aromatic groups and mediating all hydrogen bonds through waters, good affinity can be retained while obtaining a very broad specificity.
Ribonuclease NT, another broad specificity ribonuclease, is the only other T2 family member where a crystal structure is available with several bases occupying the B1 site (2′UMP, 5′GMP, and 5′AMP complexes) (Kawano et al. 2006). In that case, a different strategy is adopted, as all complexes display a number of direct hydrogen bonds between protein and base. In particular, the side chain of Asn44 is capable of making one or two hydrogen bonds with each base. Thus, for RNase NT the broad specificity of the enzyme is directly encoded in the protein structure itself, while EcRNase I uses a “buffer layer” of waters to achieve the same goal.
Materials and Methods
Expression and purification
The gene for EcRNase I (including the part coding for its signal peptide) was cloned into the pET-14b expression vector using the NcoI and BamHI restriction sites. The vector was transformed into E. coli BL21(DE3) pLysS. Cells were grown overnight at 37°C in TB medium with 100 μg/mL ampicillin and 25 μg/mL chloramphenicol without shaking. After subsequent shaking of the culture for a few hours, the cells were induced with 0.2% arabinose at 37°C. Five hours after induction, the cells were harvested by centrifugation at 4°C and resuspended in a 20 mM TRIS pH 8.0, 2.5 mM EDTA buffer solution with 300 g/L sucrose. After osmotic shock (by diluting the cells in the same buffer solution without sucrose), the supernatant was brought to saturation with ammonium sulfate and incubated for 1 h at 4°C. The precipitated proteins were removed by centrifugation (30 min, 10,000 rpm, 4°C), and resuspended in 100 mM MOPS pH 7.5, 0.1 mM EDTA, 5% (v/v) glycerol, and 1.7 M ammonium sulfate. The sample was batchwise incubated with Phenylsepharose FF (GE Healthcare) and the matrix was developed with a 1.5-column volume gradient from 1.7 M to 0.0 M ammonium sulphate in the resuspension buffer. The fractions were analyzed for RNase activity on RNase indicator plates (Quaas et al. 1989). The EcRNase I-containing fractions were dialyzed at 4°C against 20 mM MES, pH 6.1, and 5% (v/v) glycerol in 3500 Da cut-off dialysis tubing (Spectrapor) to obtain a conductivity of 1.5 mS/cm. This sample was purified on a Source30 S column equilibrated in 20 mM MES pH 6.1 and 5% (v/v) glycerol. EcRNase I was eluted with a 20-column volume linear gradient of 0–1 M NaCl, concentrated using a 10-kDa cut-off Vivaspin concentrator and further purified on Superdex75 HR equilibrated in 20 mM TRIS pH 7.5, 150 mM NaCl, and 5% (v/v) glycerol. The molecular mass of the pure protein was checked by mass spectrometry as described (Roos et al. 2007).
Structure determination
Ligand-free crystals of EcRNase I were grown as described (Padmanabhan et al. 2001). X-ray data were collected at EMBL beamlines X13 (native) and BW7A (Se-Met) at the DESY synchrotron (Table 1). The crystals were first equilibrated for 1 min in a cryoprotectant solution consisting of artificial mother liquor enriched with 28% PEG3350 and subsequently flash-frozen in the cryo-stream. The structure was phased using SAD data measured at the Se absorption edge. After integration and scaling using the HKL suite of programs (Otwinowski and Minor 1997), the data were used as input for the Auto-Rickshaw pipeline for automatic structure determination (Panjikar et al. 2005). This pipeline identified the heavy atom sites using SHELXD (Schneider and Sheldrick 2002), while refinement and phase calculation were done with MLPHARE (Collaborative Computational Project, Number 4 1994). The resulting map was solvent-flattened using DM (Collaborative Computational Project, Number 4 1994) and an initial backbone trace (four fragments encompassing 214 residues) was obtained from ARP/wARP (Morris et al. 2002).
The ARP/wARP model was then stripped of its water molecules and refined against the native data set using the MLI target of CNS 1.1 (Brünger et al. 1998). Cross-validation using a test set consisting of 8% of the data randomly omitted was used during all stages of refinement. Missing residues and side chains were built manually using TURBO (TURBO-FRODO: IRIS 4D series), and waters were added automatically with CNS. At the end of the refinement, all waters were checked and a few suspicious ones (with high B-factors or poor density) were removed and a few additional ones were added manually. In the initial stages of refinement, a slow cool protocol was alternated with the refinement of individual atomic B-factors. When the structure was near completion, the slow cool protocol was abandoned in favor of restrained positional refinement. Refinement statistics are given in Table 1.
In order to obtain nucleotide complexes, crystals of EcRNase I were initially soaked with a series of mono- and dinucleotides: 3′-AMP, 2′-AMP, 2′-UMP, 3′-CMP, 3′-GMP, 2′-GMP, 2′5′-GpA, 2′5′-GpU at concentrations of 20 mM. Data collected from these soaks did not reveal any electron density in the active site that could be ascribed to the desired ligand. We then attempted co-crystallizing the same nucleotides as well as the DNA fragments d(TTATTT) and d(CGCGATCGCG) with EcRNase I. The choice for these two DNA fragments was based on the results from other labs that previously attempted to crystallize EcRNase I complexes (Padmanabhan et al. 2001). In the presence of the mono- and dinucleotides, crystals turned out not to contain the desired ligands. No diffracting crystals were obtained in the presence of d(TTATTT), but crystallization of a complex with d(CGCGATCGCG) was successful. These crystals were grown by the hanging-drop vapor-diffusion method using drops made by mixing 1 μL of protein solution (15–18 mg/mL enzyme, 2 mg/mL aqueous DNA) and 0.5 μL of precipitant solution (20% [w/v] PEG8000, 0.1 M Sodium acetate, 1 mM MgCl2, 0.1 M MES pH 6.1), which were suspended over a 0.5-mL reservoir containing precipitant solution. X-ray data were collected on beamline X11 at the DESY synchrotron (Table 1). The crystal was frozen directly in the cryo-stream after a short (1–2 min) pre-incubation in a precipitant solution with the PEG8000 concentration enriched to 35% (w/v). The initial diffraction pattern was indicative of high mosaicity and extended only to 2.9 Å resolution. Subsequent annealing by interrupting the cryo-stream for 3 sec improved the diffraction quality markedly. Data were again integrated and scaled using the HKL suite of programs (Otwinowski and Minor 1997). The structure of this complex was determined by molecular replacement using PHASER (Storoni et al. 2004; McCoy et al. 2005) with the refined coordinates of the ligand-free protein as a search model (log-likelihood gain 2179.7). Refinement with REFMAC (Murshudov et al. 1997) was alternated with model building using COOT (Emsley and Cowtan 2004). After evaluating different total and individual occupancy factors, the total occupancy of the observed dinucleotide ligand in the active site was set to 0.7, with each of the two apparently superimposed dinucleotides d(GC) and d(TC) having an equal occupancy of 0.35. Refinement statistics are given in Table 1. Cavity volumes were calculated with WHATIF (Vriend 1990). Secondary structure elements were identified using the Kabsch and Sander algorithm (Kabsch and Sander 1983) as implemented in PROMOTIF (Hutchinson and Thornton 1996).
Sequence analysis and amino acid conservation scores
Homologous sequences were retrieved from the SwissProt and trEMBL databases (Boeckmann et al. 2003) using a BLAST search (Altschul et al. 1997) with the sequence of EcRNase I (for bacterial RNase T2 family members), RNase Rh from R. niveus (for fungal RNase T2 family members), and RNase NT (for plant RNase T2 family members). Multiple sequence alignments of the retrieved sequences were obtained for each family with ClustalW (Thompson et al. 1994) using the Blosum scoring matrix with opening and end gap penalties of 10 and extending gap and separation gap penalties of 0.05. They are provided as supplemental material. The resulting alignments were used to calculate conservation scores at each amino acid position using ConSurf (Armon et al. 2001). For visualization, the conservation scores were written into the B-factor field of the coordinates files.
Crystal structures of all RNase T2 members present in the Protein Data Bank were superimposed upon EcRNase I with TURBO (TURBO-FRODO: IRIS 4D series). Starting from the active site residues, all pairs of Cα atoms deviating <2 Å were superimposed, and this process was iterated until convergence. From this superposition, the structurally conserved common core was determined by identifying those Cα atoms that have an equivalent (distance <1.5 Å from the corresponding Cα atoms in EcRNase I).
Data deposition
The atomic coordinates and structure factors have been deposited in the Protein Data Bank (www.pdb.org) as entries 2pqx and 2z70.
Electronic supplemental material
A BLAST search with the sequence of EcRNase I yields 144 sequences of bacterial origin from the combined SwissProt and trEMBL databases.
Acknowledgments
This work was made possible thanks to financial support from the Vlaams Instituut voor Biotechnologie (VIB), the Fonds voor Wetenschappelijk Onderzoek Vlaanderen (FWO), and the Onderzoeksraad of the Vrije Universiteit Brussels. S.M.R. is a postdoctoral leader of the VIB, and J.M. and R.L. are project leaders of the VIB. We acknowledge the use of beam time at the EMBL beamlines at the DESY synchrotron. We thank Abel Garcia-Pino for calculating cavity volumes.
Footnotes
Supplemental material: see www.proteinscience.org
Reprint requests to: Remy Loris, Laboratorium voor Ultrastructuur, Vrije Universiteit Brussels, Department of Molecular and Cellular Interactions, VIB, Brussels Centre for Redox Biology, Pleinlaan 2, B-1050 Brussels, Belgium; e-mail: reloris@vub.ac.be; fax: 21-2-6291989; or Joris Messens, Laboratorium voor Ultrastructuur, Vrije Universiteit Brussels, Department of Molecular and Cellular Interactions, VIB, Brussels Centre for Redox Biology, Pleinlaan 2, B-1050 Brussels, Belgium; e-mail: joris.messens@vub.ac.be; fax: 21-2-6291989.
Abbreviations: EcRNaseI, Escherichia coli ribonuclease I; 5′-AMP, 5′ adenosine monophosphate; 5′-GMP, 5′ guanosine monophosphate; 2′-UMP, 2′ uridine monophosphate; 3′-CMP, 3′ cytosine monophosphate; 2′5′-GpA, guanyl-2′5′-adenosine; 2′5′-GpU, guanyl-2′5′-uridine.
Article published online ahead of print. Article and publication date are at http://www.proteinscience.org/cgi/doi/10.1110/ps.073420708.
References
- Aguilar, C.F., Thomas, P.J., Mills, A., Moss, D.S., Palmer, R.A. Newly observed binding mode in pancreatic ribonuclease. J. Mol. Biol. 1992;224:265–267. doi: 10.1016/0022-2836(92)90589-c. [DOI] [PubMed] [Google Scholar]
- Altschul, S.F., Madden, T.L., Schaffer, A.A., Zhang, J., Zhang, Z., Miller, W., Lipman, D.J. Gapped BLAST and PSI-BLAST: A new generation of protein database search programs. Nucleic Acids Res. 1997;25:3389–3402. doi: 10.1093/nar/25.17.3389. [DOI] [PMC free article] [PubMed] [Google Scholar]
- Armon, A., Graur, D., Ben-Tal, N. ConSurf: An algorithmic tool for the identification of functional regions in proteins by surface mapping of phylogenetic information. J. Mol. Biol. 2001;307:447–463. doi: 10.1006/jmbi.2000.4474. [DOI] [PubMed] [Google Scholar]
- Boeckmann, B., Bairoch, A., Apweiler, R., Blatter, M.C., Estreicher, A., Gasteiger, E., Martin, M.J., Michoud, K., O'Donovan, C., Phan, I., et al. The SWISS-PROT protein knowledgebase and its supplement TrEMBL in 2003. Nucleic Acids Res. 2003;31:365–370. doi: 10.1093/nar/gkg095. [DOI] [PMC free article] [PubMed] [Google Scholar]
- Brünger, A.T., Adams, P.D., Clore, G.M., DeLano, W.L., Gros, P., Grosse-Kunstleve, R.W., Jiang, J.S., Kuszewski, J., Nilges, M., Pannu, N.S., et al. Crystallography & NMR system: A new software suite for macromolecular structure determination. Acta Crystallogr. D Biol. Crystallogr. 1998;54:905–921. doi: 10.1107/s0907444998003254. [DOI] [PubMed] [Google Scholar]
- Buts, L., Lah, J., Dao-Thi, M.H., Wyns, L., Loris, R. Toxin-antitoxin modules as bacterial metabolic stress managers. Trends Biochem. Sci. 2005;30:672–679. doi: 10.1016/j.tibs.2005.10.004. [DOI] [PubMed] [Google Scholar]
- Cannistraro, V.J., Kennell, D. RNase I*, a form of RNase I, and mRNA degradation in Escherichia coli . J. Bacteriol. 1991;173:4653–4659. doi: 10.1128/jb.173.15.4653-4659.1991. [DOI] [PMC free article] [PubMed] [Google Scholar]
- Collaborative Computational Project, Number 4. The CCP4 suite: Programs for protein crystallography. Acta Crystallogr. D Biol. Crystallogr. 1994;50:760–763. doi: 10.1107/S0907444994003112. [DOI] [PubMed] [Google Scholar]
- Emsley, P., Cowtan, K. Coot: Model-building tools for molecular graphics. Acta Crystallogr. D Biol. Crystallogr. 2004;60:2126–2132. doi: 10.1107/S0907444904019158. [DOI] [PubMed] [Google Scholar]
- Hutchinson, E.G., Thornton, J.M. PROMOTIF–a program to identify and analyze structural motifs in proteins. Protein Sci. 1996;5:212–220. doi: 10.1002/pro.5560050204. [DOI] [PMC free article] [PubMed] [Google Scholar]
- Ida, K., Norioka, S., Yamamoto, M., Kumasaka, T., Yamashita, E., Newbigin, E., Clarke, A.E., Sakiyama, F., Sato, M. The 1.55 Å resolution structure of Nicotiana alata S(F11)-RNase associated with gametophytic self-incompatibility. J. Mol. Biol. 2001;314:103–112. doi: 10.1006/jmbi.2001.5127. [DOI] [PubMed] [Google Scholar]
- Irie, M. RNaseT1/Rnase T2 family RNases. In: D'Alessio G., Riordan J.F., editors. Ribonucleases: Structures and functions. Academic Press; New York: 1997. pp. 101–129. [Google Scholar]
- Irie, M. Structure-function relationships of acid ribonucleases: Lysosomal, vacuolar, and periplasmic enzymes. Pharmacol. Ther. 1999;81:77–89. doi: 10.1016/s0163-7258(98)00035-7. [DOI] [PubMed] [Google Scholar]
- Janin, J. Wet and dry interfaces: The role of solvent in protein–protein and protein-DNA recognition. Structure. 1999;7:R277–R279. doi: 10.1016/S0969-2126(00)88333-1. [DOI] [PubMed] [Google Scholar]
- Joachimiak, A., Haran, T.E., Sigler, P.B. Mutagenesis supports water mediated recognition in the trp repressor-operator system. EMBO J. 1994;13:367–372. doi: 10.1002/j.1460-2075.1994.tb06270.x. [DOI] [PMC free article] [PubMed] [Google Scholar]
- Kabsch, W., Sander, C. Dictionary of protein secondary structure: Pattern recognition of hydrogen-bonded and geometrical features. Biopolymers. 1983;22:2577–2637. doi: 10.1002/bip.360221211. [DOI] [PubMed] [Google Scholar]
- Kawano, S., Kakuta, Y., Kimura, M. Guanine binding site of the Nicotiana glutinosa ribonuclease NW revealed by X-ray crystallography. Biochemistry. 2002;41:15195–15202. doi: 10.1021/bi026247l. [DOI] [PubMed] [Google Scholar]
- Kawano, S., Kakuta, Y., Nakashima, T., Kimura, M. Crystal structures of the Nicotiana glutinosa ribonuclease NT in complex with nucleoside monophosphates. J. Biochem. 2006;140:375–381. doi: 10.1093/jb/mvj164. [DOI] [PubMed] [Google Scholar]
- Kurihara, H., Nonaka, T., Mitsui, Y., Ohgi, K., Irie, M., Nakamura, K.T. The crystal structure of ribonuclease Rh from Rhizopus niveus at 2.0 Å resolution. J. Mol. Biol. 1996;255:310–320. doi: 10.1006/jmbi.1996.0025. [DOI] [PubMed] [Google Scholar]
- Langhorst, U., Backmann, J., Loris, R., Steyaert, J. Analysis of a water mediated protein–protein interactions within RNase T1. Biochemistry. 2000;39:6586–6593. doi: 10.1021/bi992131m. [DOI] [PubMed] [Google Scholar]
- Matsuura, T., Sakai, H., Unno, M., Ida, K., Sato, M., Sakiyama, F., Norioka, S. Crystal structure at 1.5 Å resolution of Pyrus pyrifolia pistil ribonuclease responsible for gametophytic self-incompatibility. J. Biol. Chem. 2001;276:45261–45269. doi: 10.1074/jbc.M107617200. [DOI] [PubMed] [Google Scholar]
- McClure, B.A., Haring, V., Ebert, P.R., Anderson, M.A., Simpson, R.J., Sakiyama, F., Clarke, A.E. Style self-incompatibility gene products of Nicotiana alata are ribonucleases. Nature. 1989;342:955–957. doi: 10.1038/342955a0. [DOI] [PubMed] [Google Scholar]
- McCoy, A.J., Grosse-Kunstleve, R.W., Storoni, L.C., Read, R.J. Likelihood-enhanced fast translation functions. Acta Crystallogr. D Biol. Crystallogr. 2005;61:458–464. doi: 10.1107/S0907444905001617. [DOI] [PubMed] [Google Scholar]
- Meador J., III, Kennell, D. Cloning and sequencing the gene encoding Escherichia coli ribonuclease I: Exact physical mapping using the genome library. Gene. 1990;95:1–7. doi: 10.1016/0378-1119(90)90406-h. [DOI] [PubMed] [Google Scholar]
- Messens, J., Collet, J.F., Van Belle, K., Brosens, E., Loris, R., Wyns, L. The oxidase DsbA folds a protein with a nonconsecutive disulfide. J. Biol. Chem. 2007;282:31302–31307. doi: 10.1074/jbc.M705236200. [DOI] [PubMed] [Google Scholar]
- Morris, R.J., Perrakis, A., Lamzin, V.S. ARP/wARP's model-building algorithms. I. The main chain. Acta Crystallogr. D Biol. Crystallogr. 2002;58:968–975. doi: 10.1107/s0907444902005462. [DOI] [PubMed] [Google Scholar]
- Murshudov, G.N., Vagin, A.A., Dodson, E.J. Refinement of macromolecular structures by the maximum-likelihood method. Acta Crystallogr. D Biol. Crystallogr. 1997;53:240–255. doi: 10.1107/S0907444996012255. [DOI] [PubMed] [Google Scholar]
- Nakagawa, A., Tanaka, I., Sakai, R., Nakashima, T., Funatsu, G., Kimura, M. Crystal structure of a ribonuclease from the seeds of bitter gourd (Momordica charantia) at 1.75 Å resolution. Biochim. Biophys. Acta. 1999;1433:253–260. doi: 10.1016/s0167-4838(99)00126-0. [DOI] [PubMed] [Google Scholar]
- Neu, H.C., Heppel, L.A. The release of ribonuclease into the medium when Escherichia coli cells are converted to spheroplasts. J. Biol. Chem. 1964;239:3893–3900. [PubMed] [Google Scholar]
- Nicholson, A.W. Escherichia coli ribonucleases: Paradigms for understanding cellular RNA metabolism and regulation. In: D'Alessio G., Riordan J.F., editors. Ribonucleases: Structures and functions. Academic Press; New York: 1997. pp. 1–49. [Google Scholar]
- Otwinowski, Z., Minor, W. Processing of X-ray diffraction data collected in oscillation mode. Methods Enzymol. 1997;276:307–326. doi: 10.1016/S0076-6879(97)76066-X. [DOI] [PubMed] [Google Scholar]
- Otwinowski, Z., Schevitz, R.W., Zhang, R.G., Lawson, C.L., Joachimiak, A., Marmorstein, R.Q., Luisi, B.F., Sigler, P.B. Crystal structure of trp repressor/operator complex at atomic resolution. Nature. 1988;335:321–329. doi: 10.1038/335321a0. [DOI] [PubMed] [Google Scholar]
- Padmanabhan, S., Zhou, K., Chu, C.Y., Lim, R.W., Lim, L.W. Overexpression, biophysical characterization, and crystallization of ribonuclease I from Escherichia coli, a broad-specificity enzyme in the RNase T2 family. Arch. Biochem. Biophys. 2001;390:42–50. doi: 10.1006/abbi.2001.2359. [DOI] [PubMed] [Google Scholar]
- Panjikar, S., Parthasarathy, V., Lamzin, V.S., Weiss, M.S., Tucker, P.A. Auto-Rickshaw: An automated crystal structure determination platform as an efficient tool for the validation of an X-ray diffraction experiment. Acta Crystallogr. D Biol. Crystallogr. 2005;61:449–457. doi: 10.1107/S0907444905001307. [DOI] [PubMed] [Google Scholar]
- Quaas, R., Landt, O., Grunert, H.P., Beineke, M., Hahn, U. Indicator plates for rapid detection of ribonuclease T1 secreting Escherichia coli clones. Nucleic Acids Res. 1989;17:3318. doi: 10.1093/nar/17.8.3318. [DOI] [PMC free article] [PubMed] [Google Scholar]
- Rabijns, A., Verboven, C., Rouge, P., Barre, A., Van Damme, E.J., Peumans, W.J., De Ranter, C.J. Structure of an RNase-related protein from Calystegia sepium . Acta Crystallogr. D Biol. Crystallogr. 2002;58:627–633. doi: 10.1107/s090744490200255x. [DOI] [PubMed] [Google Scholar]
- Raschke, T.M. Water structure and interactions with protein surfaces. Curr. Opin. Struct. Biol. 2006;16:152–159. doi: 10.1016/j.sbi.2006.03.002. [DOI] [PubMed] [Google Scholar]
- Roos, G., Garcia-Pino, A., Van Belle, K., Brosens, E., Wahni, K., Vandenbussche, G., Wyns, L., Loris, R., Messens, J. The conserved active site proline determines the reducing power of Staphylococcus aureus thioredoxin. J. Mol. Biol. 2007;368:800–811. doi: 10.1016/j.jmb.2007.02.045. [DOI] [PubMed] [Google Scholar]
- Schneider, T.R., Sheldrick, G.M. Substructure solution with SHELXD. Acta Crystallogr. D Biol. Crystallogr. 2002;58:1772–1779. doi: 10.1107/s0907444902011678. [DOI] [PubMed] [Google Scholar]
- Sevcik, J., Zegers, I., Wyns, L., Dauter, Z., Wilson, K.S. Complex of ribonuclease Sa with a cyclic nucleotide and a proposed model for the reaction intermediate. Eur. J. Biochem. 1993;216:301–305. doi: 10.1111/j.1432-1033.1993.tb18145.x. [DOI] [PubMed] [Google Scholar]
- Storoni, L.C., McCoy, A.J., Read, R.J. Likelihood-enhanced fast rotation functions. Acta Crystallogr. D Biol. Crystallogr. 2004;60:432–438. doi: 10.1107/S0907444903028956. [DOI] [PubMed] [Google Scholar]
- Suzuki, A., Yao, M., Tanaka, I., Numata, T., Kikukawa, S., Yamasaki, N., Kimura, M. Crystal structures of the ribonuclease MC1 from bitter gourd seeds, complexed with 2′-UMP or 3′-UMP, reveal structural basis for uridine specificity. Biochem. Biophys. Res. Commun. 2000;275:572–576. doi: 10.1006/bbrc.2000.3318. [DOI] [PubMed] [Google Scholar]
- Tanaka, N., Arai, J., Inokuchi, N., Koyama, T., Ohgi, K., Irie, M., Nakamura, K.T. Crystal structure of a plant ribonuclease, RNase LE. J. Mol. Biol. 2000;298:859–873. doi: 10.1006/jmbi.2000.3707. [DOI] [PubMed] [Google Scholar]
- Thompson, J.D., Higgins, D.G., Gibson, T.J. CLUSTAL W: Improving the sensitivity of progressive multiple sequence alignment through sequence weighting, position-specific gap penalties and weight matrix choice. Nucleic Acids Res. 1994;22:4673–4680. doi: 10.1093/nar/22.22.4673. [DOI] [PMC free article] [PubMed] [Google Scholar]
- Vriend, G. WHAT IF: A molecular modeling and drug design program. J. Mol. Graph. 1990;8:52–56. doi: 10.1016/0263-7855(90)80070-v. [DOI] [PubMed] [Google Scholar]
- Zegers, I., Loris, R., Dehollander, G., Fattah Haikal, A., Poortmans, F., Steyaert, J., Wyns, L. Hydrolysis of a slow cyclic thiophosphate substrate of RNase T1 analyzed by time-resolved crystallography. Nat. Struct. Biol. 1998;5:280–283. doi: 10.1038/nsb0498-280. [DOI] [PubMed] [Google Scholar]


