Abstract
We have applied functional MRI (fMRI) based on blood oxygenation level-dependent (BOLD) image-contrast to map odor-elicited olfactory responses at the laminar level in the rat olfactory bulb (OB) elicited by iso-amyl acetate (10−2 dilution of saturated vapor) with spatial and temporal resolutions of 220×220×1,000 μm and 36 s. The laminar structure of the OB was clearly depicted by high-resolution in vivo anatomical MRI with spatial resolution of 110×110×1,000 μm. In repeated BOLD fMRI measurements, highly significant (P < 0.001) foci were located in the outer layers of both OBs. The occurrence of focal OB activity within a domain at the level of individual glomeruli or groups of glomeruli was corroborated on an intra- and inter-animal basis under anesthetized conditions with this noninvasive method. The dynamic studies demonstrated that the odor-elicited BOLD activations were highly reproducible on a time scale of minutes, whereas over tens of minutes the activations sometimes varied slowly. We found large BOLD signal (ΔS/S = 10–30%) arising from the olfactory nerve layer, which is devoid of synapses and composed of unmyelinated fibers and glial cells. Our results support previous studies with other methods showing that odors elicit activity within glomerular layer domains in the mammalian OB, and extend the analysis to shorter time periods at the level of individual glomeruli or groups of glomeruli. With further improvement, BOLD fMRI should be ideal for systematic analysis of the functional significance of individual glomeruli in olfactory information encoding and of spatiotemporal processing within the olfactory system.
A critical problem in the field of olfaction is the role played by spatial activity patterns in the neural basis of olfactory discrimination. Interest in this problem has focused in particular on the olfactory bulb (OB), which is the first site of synaptic processing in the vertebrate olfactory pathway. In the mammal, a variety of functional studies have provided evidence that different odor stimuli elicit different patterns of activity within the glomerular layer (GL) of the OB where axons of the olfactory sensory neurons (OSNs) terminate (see refs. 1–8). However, the methods used to date have been limited in either temporal or spatial resolution, rendering it difficult to assess the contributions of these patterns to odor discrimination. A key to further progress is to develop methods that allow for repeated measurements of odor-induced OB activity with high spatial and temporal resolution throughout the OB in the same animal.
Functional MRI (fMRI) is a noninvasive method that can provide multiple measurements in the same animal. We have developed fMRI protocols, with blood-oxygenation level dependent (BOLD) contrast (9), in the rat brain at a magnetic field strength of 7 Tesla. Using BOLD fMRI, we have mapped the response in the rat brain during electrical forepaw stimulation (10) and observed the activation of single whisker barrels (11). The spatial location and dimensions of the BOLD fMRI activation were well correlated with electrophysiological studies of the barrels (12). These studies have demonstrated that BOLD fMRI at 7 Tesla is capable of mapping highly localized functional activity in the rat brain.
In the present study we extended these methods to mapping odor-elicited activity in the rat OB. The laminar structure in the OB was clearly delineated by in vivo anatomical MRI. Highly significant foci of BOLD fMRI activation were elicited by iso-amyl acetate odor. The laminar distribution of the BOLD fMRI activation within the OB was resolved, and the most significant activations were observed in the outer layers of the OB, in agreement with laminar specific patterns of 2-deoxyglucose autoradiography (2-DG) uptake during odor stimulation (13). Dynamic fMRI studies revealed that during a prolonged exposure, successive activations were reproducible on a time scale of minutes, whereas over tens of minutes they could vary. The results demonstrate that noninvasive BOLD fMRI has the spatial resolution to resolve olfactory activation in specific layers of the rat OB and has the temporal resolution to reveal dynamic changes within tens of seconds of OB activation.
MATERIALS AND METHODS
Animal Preparation.
Male Sprague–Dawley rats (200–300 g) initially were anesthetized with 2% halothane. The skin on top of the skull was removed to expose the skull. A femoral artery was cannulated for monitoring blood pressure, blood gases, and pH levels. After surgery, the anesthetic was switched to urethane (i.p., initial dose 1.5 g/kg body weight, and 0.1 g/kg body weight every 60 min throughout the experiment). The protocol was approved by the Yale Animal Care and Use Committee (YACUC no. 7522).
Odor Delivery.
The air or air plus odor was delivered to the rats through a glass funnel that fit loosely over the nose. Under urethane anesthesia, the animals respirated spontaneously. Air was delivered to the funnel at a constant rate of 10 liters/min. Odorized air was delivered in a 10−2 dilution of saturated vapor of iso-amyl acetate solution. The concentration of odor in the mixed air was controlled by adjusting the flow rate of the odor stream, while the duration of odor exposure could be controlled by a flow valve.
Imaging Experiments.
fMRI experiments (n = 6) were performed on a modified horizontal-bore 7 Tesla Bruker Biospec I spectrometer with fast, low-angle, single-shot (FLASH) gradient-echo imaging sequence. The rat’s head was placed in a head holder to minimize head movement. A circular radio frequency surface coil probe (10-mm diameter) was centered on top of the skull between the eyes of the animal (both sagitally and transversely) to maximize the imaging signal from the OB.
Before the fMRI experiments, high-resolution T1-weighted anatomical images were obtained for the coronal slice of interest (field of view = 1.5 cm, image dimension = 128×128 pixels, in plane resolution = 110×110 μm, slice thickness = 1 mm, relaxation delay = 5 s, and inversion recovery delay = 0.9 s). The coronal slice was located approximately 2–3 mm posterior to the rostral extreme of the OB.
Single-slice, fast, low-angle, single-shot (FLASH) fMRI images were acquired with a field of view of 1.5 cm, slice thickness of 1 mm, dimension of 64×64 pixels, flip angle of 15°-30°, relaxation time of 0.5 or 0.1 s, and echo time of 16 ms. The fMRI images had spatial and temporal resolutions of 220×220×1,000 μm and 36 or 8 s per image. Slice shimming optimized the magnetic field homogeneity in slice of interest and the in vivo water linewidth was typically <25 Hz after shimming. No image averaging was required for fMRI data.
Stimulation Protocol.
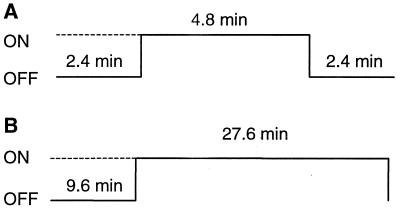
Experiments with odor exposure durations of 4.8 and 27.6 min were performed. The 4.8-min exposure and 27.6-min exposures each were repeated 3–4 times, with 10 min of breathing pure air between successive runs. Each fMRI experiment contained a series of 64 images. Four dummy scans were carried out to reach steady state before image acquisition. For the experiments with 4.8-min odor exposure, 16 images (numbered 1–16) were acquired as “baseline” images during which the rats inhaled pure air, 32 images (numbered 16–48) were “stimulation” images during which the rats inhaled the mixture of pure air and iso-amyl acetate, and 16 images (numbered 49–64) were “recovery” images during which the rats again inhaled pure air. For the 27.6-min exposures, baseline images are 1–16, and stimulation images are 17–64. The 4.8-min exposures were performed before the 27.6-min exposures.
Data Processing.
All functional images were analyzed off-line on a Silicon Graphics Indy workstation (Mountain View, CA) in matlab environment (Natick, MA). After conversion of Biospec I sequentially sampled data and Fourier transformation (14), head movement artifacts were assessed by a center-of-mass (COM) algorithm using noninterpolated fast, low-angle, single-shot (FLASH) images (11). Briefly, thresholded FLASH images were used such that only pixels within the bulb were pertinent for the analysis. The deviations in the COMs of the thresholded images (in x and y directions of a pixel) were plotted against time to reveal the temporal patterns of motion, and images were discarded from analysis if the deviation in the COM was greater than 25% of a pixel size. No attempts were made to correct for physiologic fluctuations in the fMRI data or for misregisteration of images (15). For each run, the mean image of the baseline images (S) was subtracted from the mean of stimulation images (S+ΔS) on a pixel-by-pixel basis. Activated regions were defined by ΔS/S (the odor-elicited relative signal change) maps, or by t-maps created on the basis of Student’s paired t test comparison of the difference images (i.e., ΔS images) between the baseline and stimulation periods. The poststimulation period images were not used to represent baseline signals because the odor-related signal-changes lasted after the odor delivery was stopped. Two types of activation maps were produced. To visualize the dynamic activity throughout the stimulation period, individual activation maps (ΔS/S and t-maps) were obtained from every consecutive four images of the stimulation period. To visualize the activity of the OB response over the entire stimulation period, mean activation maps (ΔS/S and t-maps) for the entire stimulation period were obtained. All ΔS/S maps (thresholded at ΔS/S >0.01) and t-maps (thresholded at P < 0.1 or P < 0.01) then were linearly interpolated to a 128×128 image-matrix, and overlaid onto the corresponding anatomical image to locate the region of interest (ROI) in the laminar structure of the OB. The similar ROIs across different rats were compared on visual perception because data were not adjusted to stereotactic space.
RESULTS
In Vivo MRI of the Laminar Structure of the Rat OB.
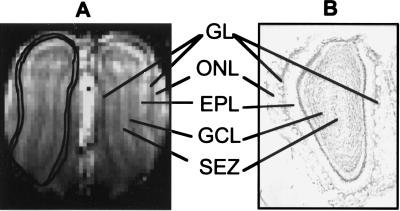
High-resolution anatomical MRI images are needed to overlay the BOLD fMRI activation onto the laminar structure in the OB. Fig. 1A is an anatomical MRI image of a coronal slice in the OB. The T1-weighted image reveals a laminar pattern that is matched with a cresyl-stained coronal section (Fig. 1B). In the anatomical MRI, the olfactory nerve layer (ONL), GL, external plexiform layer (EPL), granule cell layer, and the subependamal zone are clearly identified. In Fig. 1A, the apparent disappearance of the GL and ONL between the lateral and ventral areas in the anatomical MRI is caused by the thinning of these layers in that region at this slice location. Further, the thickness of the anatomical MRI slice (1 mm) renders the image susceptible to the variation of the OB curvature in the rostral-caudal axis. The laminar differentiation in the ventral area is less distinct compared with other parts of the OB because of the lower MRI signal in that region; however, as shown in the left OB of Fig. 1A, the GL can be clearly outlined throughout the bulb. The radially oriented columns that appeared in the rat cortex as exaggerated blood vessels (diameter of 50–200 μm) in coronal T1- and T2*- weighted image at 7 Tesla (10, 11) are noticeably absent in coronal sections of the OB, because the vasculature in the bulb is composed of small vessels with diameters of <20 μm (16).
Figure 1.
The in vivo anatomical MRI of a coronal slice in the rat OBs. The MRI image (A) was acquired with a T1-weighted gradient-echo sequence with in-plane resolution of 110 μm×110 μm and slice thickness of 1 mm. In comparison with a cresyl-stained histological section (slice thickness of 50 μm) from another rat (B), the ONL, GL, EPL, the granular cell layer (GCL), and the subependamal zone (SEZ) all are delineated. In the left bulb in A, the contour of the GL is outlined.
Odor-Elicited BOLD fMRI Activation in the Rat OB.
Results from different rats are presented and compared in this paper. In each rat, multiple runs with odor stimulation of 4.8 or 27.6 min were repeated. The stimulation protocols are shown in Fig. 2 A and B, respectively. Between successive runs, the animals were given at least 10 min to breathe pure air.
Figure 2.
The stimulation protocols for the experiments with (A) 4.8-min and (B) 27.6-min odor exposures. The on periods indicate the duration of odor stimulation. During the off periods, the rats breathed pure air.
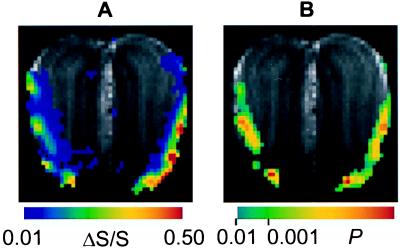
Fig. 3A shows an individual ΔS/S map acquired in 2.3 min during 27.6-min continuous exposure. The foci of large signal changes are located in the lateral and ventral areas and appear approximately symmetrical in both bulbs. The odor-elicited BOLD fMRI signal changes in the OB (>20%) are significantly higher than previously reported in the cortex (4–8%) at the same same field (10, 11). Imaging parameters for BOLD contrast were identical in both the previous rat cortex fMRI data and the current rat OB fMRI data.
Figure 3.
(A) An individual BOLD fMRI activation map (ΔS/S map, thresholded at ΔS/S ≥ 0.01) acquired in a period of 2.3 min (between 23.0 and 25.3 min after the onset of odor exposure) during a prolonged exposure of 27.6 min to iso-amyl acetate (10 −2 dilution of the saturated vapor). The magnitude of odor-elicited signal change (ΔS/S) in each pixel is indicated by the color scale. (B) The same individual activation in A is presented as a t-map thresholded at P < 0.01. The statistical significance (P value, probability of error) of the odor-elicited MRI signal change in each pixel is represented by the corresponding P value in the color scale. All of the activation maps were linearly interpolated from in-plane resolution of 220×220 μm to 110×110 μm and overlaid on the corresponding anatomical MRI.
Fig. 3B is the t-map (thresholded at P < 0.01) of the same activation shown in Fig. 3A. The foci showing the highest statistical significance (P < 0.001) are located in the lateral and ventral regions. A small P value is in general the consequence of a large ΔS/S value. Comparison between the ΔS/S and t maps (Fig. 3 A and B) of the same activation reveals that although most regions of large ΔS/S give rise to a small P value, some pixels of large ΔS/S have relatively low statistical significance, which can be caused by large scan-to-scan variation in the baseline period in these pixels. Regions showing ΔS/S smaller than 10% usually are not represented in the t-map, because of their minor statistical significance caused by the large signal variation during the baseline period discussed later.
The Laminar Distribution of the BOLD Activation and Inter-Animal Reproducibility.
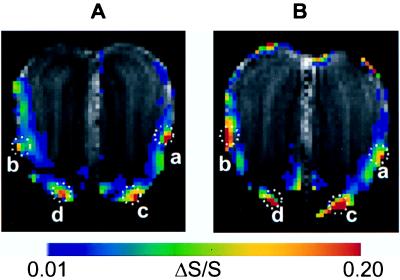
To reveal the laminar distribution of the BOLD activation, ΔS/S maps with in-plane resolution of 220×220 μm were linearly interpolated to a resolution of 110×110 μm and overlaid on the T1-weighted anatomical image of the corresponding slice in the same animal. ΔS/S maps from different rats are compared in Fig. 4 A and B to judge inter-animal reproducibility.
Figure 4.
BOLD fMRI activation maps acquired in different rats (A in rat #3, and B in rat #4). The activation maps are mean ΔS/S maps for 4.8-min continuous exposures. The laminar distribution of activated pixels within each circled area (a, b, c, and d) is summarized in Table 1.
High regional BOLD activations in the lateral and ventral foci of Fig. 4 A and B are labeled as a, b, c, and d and are outlined by dotted circles. The laminar distributions of the BOLD activations for each focus in both rats are shown in Table 1. Overall, the BOLD activation is located in the outer layers (ONL, GL, and EPL), and the activation of the GL occurs mostly in the ventral regions. This is in general agreement with 2-DG uptake in the OB, which showed that the area of high odor-elicited 2-DG uptake was localized in the outer layers of the OB (13). In foci c and d in the ventral areas of the bulb (for both rats), the activation spans the GL, ONL, and EPL (50%, 17%, and 33%, respectively). However, in foci a and b, in the midlateral areas of the OB (for both rats), all of the pixels appear to be located in the ONL. Although the inter-animal reproducibility of BOLD activation cannot be estimated quantitatively because of variations in bulb positioning and/or slice locations across animals, the general spatial location of ventral and lateral foci are in excellent agreement in different animals (Fig. 4 A and B). Further, the inter-animal reproducibility is clearly demonstrated by the laminar distribution of the BOLD activation for corresponding foci, as shown in Table 1. Activation in the dorsal area (Fig. 4B) of the coronal section is not as reproducible across animals. Although the present pixel volume (220×220×1,000 μm) is several times larger than a single glomerulus (150×150×150 μm) in the rat, we emphasize that the in-plane resolution of 220×220 μm allows us to distinguish the laminar distribution of activation in the coronal slice. In the GL, the BOLD signal for activated tissue is very large (>20%) relative to the scan-to-scan variation for resting tissue (≈5%). Because the baseline noise in the OB is 3–4 times higher than in the cortex for the same voxel size (discussed later), almost all of the prestimulation scan-to-scan variation is of physiological origin and should be independent of voxel resolution. With better radio frequency coil design, improved shimming, better MRI acquisition parameters, signal averaging, different anesthesia, and reduction of physiological noise, the fMRI sensitivity of our system can be improved significantly to the point where activity of individual glomeruli should be resolved.
Table 1.
Laminar distribution of BOLD activation foci
| Lateral
|
Ventral
|
|||
|---|---|---|---|---|
| a | b | a | b | |
| Rat #3 | 100% ONL | 100% ONL | 15% ONL | 18% ONL |
| — | — | 46% GL | 55% GL | |
| — | — | 39% EPL | 27% EPL | |
| Rat #4 | 100% ONL | 100% ONL | 9% ONL | 25% ONL |
| — | — | 36% GL | 63% GL | |
| — | — | 55% EPL | 12% EPL | |
The laminar distribution of activation is determined for the foci showing large ΔS/S values in the lateral and ventral regions of Fig. 4 A (rat #3) and B (rat #4). The location of each focus is indicated by the dotted circles in the figure. The laminar position of the activated pixels in each circle is determined, and the number of activated pixels in each layer is compared to the total number of activated pixels in the circles to give the percentage laminar distribution.
The Dynamic Pattern of the Odor-Elicited Activation During Continuous Exposure.
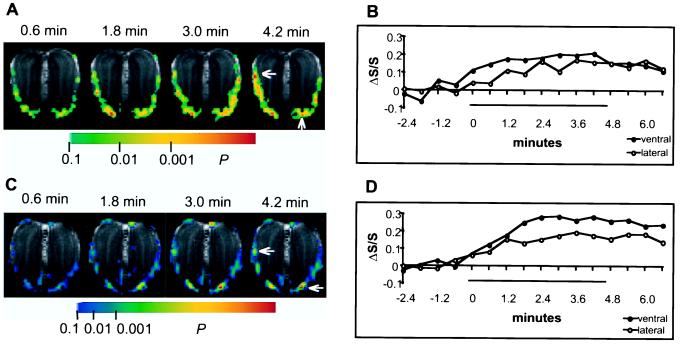
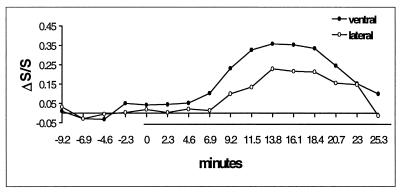
With a temporal resolution of tens of seconds, BOLD fMRI is capable of studying dynamic changes associated with odor responses. Fig. 5 A and C shows individual BOLD activation maps (t-maps) acquired alternatively in periods of 0.6 min for every 1.2 min in different rats during 4.8-min exposures. Fig. 5 B and D shows the corresponding ΔS/S time courses from single voxels (location indicated by arrows) in ventral GL and lateral ONL. Fig. 6 shows the ΔS/S time courses from the same voxels in Fig. 5C during a prolonged exposure of 27.6 min.
Figure 5.
Individual BOLD fMRI activation maps (A, rat #3; C, rat #4) acquired during 4.8-min continuous odor exposure with temporal resolution of 36 s, accompanied by the corresponding time course of the BOLD signal (ΔS/S) from single pixels (B for arrows in A, D for arrows in C) in the ventral GL and the lateral ONL. The bars in B and D represent the duration of odor stimulation, and values on the temporal axis represent the time intervals between the start of every 0.6-min acquisition and the onset of odor stimulation. Each BOLD activation map was thresholded at P < 0.1.
Figure 6.
Time courses of the BOLD signal (ΔS/S) from single pixels (the same as in Fig. 5C) in the ventral GL, lateral ONL during a 27.6-min prolonged exposure. The bar indicates the duration of odor stimulation, and the values on the temporal axis represent the time intervals between the start of every 2.3-min acquisition and the onset of odor stimulation.
During the exposures, the initial BOLD activation does not decrease after continuous odor stimulation (Fig. 5). Successive activations are highly reproducible on a time scale of minutes (Fig. 5), but over tens of minutes the activation varies slowly (Fig. 6). After the termination of the odor exposures, the activation appears to decline very slowly toward baseline and is still evident 2.4 min after stimulation offset when the experiment ended (Fig. 5). In contrast, in Fig. 6 the signal began to decline before the end of stimulation. In the 11 exposures repeated in the same rats as in Figs. 5 and 6, a slow rise of the BOLD signal in the early period of the exposures occurred in nine cases, whereas in other cases the high level of BOLD activation was reached within the first 0.6 min. In all cases, a high temporal correlation exists between the BOLD signals from the lateral ONL and ventral GL (see Figs. 5 and 6).
Close inspection of the time courses in Figs. 5 and 6 revealed that the scan-to-scan variation in the baseline period is significant. The baseline variation in the OB (≈5%) is higher than in the rat whisker barrels in the somatosensory cortex (<2%) (11). Because the data from both studies passed the same stringent movement detection test, movement artifacts were unlikely. However, in the present study of the OB, the rats were under urethane anesthesia and were spontaneously breathing. The large baseline variation could be caused by the relative light anesthesia by urethane and/or the instability of spontaneous nasal inhalation by the animal. These factors might be reduced by switching to a different anesthetic such as α-chloralose, or by artificially controlling the nasal inhalation of the animals with fixed parameters.
DISCUSSION
Using BOLD fMRI we have mapped the odor-elicited responses in the rat OB with high spatial and temporal resolution. The spatial resolution enabled us to resolve the distribution of the odor-elicited activation in different layers of the rat OB and demonstrated the iso-amyl acetate-induced BOLD foci in the lateral ONL, and ventral GL, ONL, and EPL of rat OB. The temporal resolution of down to 36 s revealed that the odor-elicited BOLD activation was stable in the time scale of minutes, but over tens of minutes the activation could vary slowly. Thus, this study indicates that BOLD fMRI can be applied to the complex problem of spatial activity maps in olfaction.
An important aspect of these results is the extent to which they are consistent with previous findings with 2-DG and c-fos mapping methods (1, 6, 7). Although quantitative comparison of the current fMRI data with results of these methods is difficult because of differences in slice location and thickness, qualitative analysis indicates that BOLD fMRI confirms the following properties of odor-induced responses in the OB: (i) exposure to an odor results in a spatially restricted pattern of activity; (ii) the highest activity occurs in the GL and ONL; and (iii) the spatial pattern is reproducible across different animals. The high level of activity in the GL is closely correlated with the high density of synaptic terminals (17). The high energy demands associated with synaptic activity are well documented (11, 12, 18–20), providing the basis for the strong BOLD fMRI signal in the GL. The large BOLD signal in the ONL is in agreement with the high density of unmyelinated nerve fibers, which have been shown to have high energy demands for impulse activity (21).
Measurements of the activity during the prolonged odor exposures revealed several interesting temporal characteristics. It previously has been speculated that prolonged exposure may induce adaptation, either at the level of the OSNs or in the OB circuits, so that afferent-induced activity would decline or disappear. The BOLD fMRI results with temporal resolution of 36 s show that the initial BOLD activation did not decrease after continuous odor exposure, indicating a lack of early adaptation to the onset of odor exposure. Other common temporal characteristics of the odor-elicited BOLD signal are slow changes in olfactory responses over tens of minutes of prolonged odor exposures, and persistence of the BOLD signal after the termination of odor stimulation. There are several possible sources for the slow changes: the sensory input, intrinsic bulbar circuits, or centrifugal modulation. The slow decline of BOLD signal after termination of odor stimulation might be caused by the slow clearance of the odor molecules from the olfactory receptors and the relatively high concentration of the odor stimulus in this study. Centrifugal fibers are widely believed to be responsible for modulation of bulbar circuits and certainly could be involved in the slow temporal variations. It is of interest that such variations have been reported in a study using chronic unit recordings of spiking activity from mitral cells in the OBs of awake behaving rats by Bhalla and Bower (22), who suggested that centrifugal feedback would be the likely agent for these variations. However, we have shown that the slow variations also occurred in the ONL, which is composed of axons of the peripheral OSNs and not regulated by the bulbar circuits or the centrifugal input. This implies that the variations reflect changes in the activity of OSN inputs more than or rather than intrinsic bulbar circuits or centrifugal fibers. Because the odor is brought into the nasal cavity by the airflow during the inspiratory phase of the respiratory cycle, many factors can contribute to the variation of interactions between the OSNs and the odor molecules (e.g., respiratory rate, sniffing rapidity, flaring of nares, breathing cycle, etc.; see refs. 23 and 24). The variations of activity also can be caused by the changes in the effect of anesthesia, which would alter the response sensitivity of the animals to the odor stimulation and/or the nasal inhalation pattern.
The BOLD signal in the odor activation of rat OB was significantly higher than the previously reported activation of whisker barrels in the rat somatosensory cortex. The average odor-elicited BOLD signal in the OB was 20–30%, whereas the BOLD signal in the activation of whisker barrel was 4–5% (11). The BOLD signals were acquired with the same imaging method and similar parameters. The vascular structure inside the OB is composed of capillaries with diameters of less than 20 μm, therefore large vessel artifacts were unlikely. Possible factors contributing to the observed difference in BOLD signals include the synaptic density, metabolism, capillary density, circulation, anesthetics, and types of sensory stimulation. An interesting possibility is that the microvasculature in the OB may be distinct from other parts of brain, and an early report has suggested large increases in capillary recruitment caused by odor stimulation (25). Such an ability of the capillary bed to modify its diffusive capacity for oxygen could cause large BOLD fMRI signal changes, as demonstrated by recent models (26, 27). The glomeruli, which are composed of axon terminals and presynaptic and postsynaptic dendrites, have the highest synaptic density in the OB (17). The observation that the most significant BOLD signal occurred in the GL suggests that synaptic activities gave rise to the BOLD signal. Some level of activation in the EPL, containing dendrodendritic synapses, is also consistent with 2-DG results after odor stimulation (1) and with electrical stimulation of the olfactory nerve (28). The present results are in accord with our previous findings of colocalization of electrical activity and BOLD signal in the rat whisker barrel cortex (12). Interestingly, large BOLD signals also were observed in the ONL, which is composed predominantly of unmyelinated axons and glial cells but devoid of synapses, in agreement with previously observed high 2-DG uptake in the ONL caused by odor stimulation (13) and nerve stimulation (28).
The noninvasive BOLD fMRI should be ideal for studying glomerular specificity by mapping glomerular responses elicited by different odor molecules with a variety of sterochemical structures in the same animal. Previous brain mapping methods are either temporally or spatially limited in mapping the responses in the OB. High spatial resolution methods have been developed for 2-DG (29), but this mapping method is temporally limited because it requires ≈45 min of odor stimulation and only one experiment can be performed on each animal. Electrophysiological recording (30) has high temporal resolution, but it can study only a small number of cells and thus is unable to record the responses in the entire OB. The voltage-sensitive dye imaging method (31) also has high temporal resolution, but it can map only the activities located near an exposed region of the OB. fMRI overcomes all of these limitations, in that the odor-elicited responses in the entire OB can be mapped repeatedly with different odor stimuli in the same animal over short periods of time.
A striking feature of the BOLD fMRI results was that specific voxels consistently showed high levels of activity in successive odor exposures. This result is of interest in view of the molecular evidence for the convergence of subsets of OSNs expressing one receptor type onto one or two specific glomeruli (32–34). With further improvement in spatial resolution, BOLD fMRI has the potential to localize the activation of a single glomerulus with preferential affinity for the structural determinants (35) on a given odor molecule.
CONCLUSION
This BOLD fMRI study of the rat OB supports previous evidence from 2-DG, c-fos, and electrophysiological recordings of laminar restricted patterns of activity in the mammalian OB with odor stimulation. The occurrence of focal OB activity within a domain at the level of individual glomeruli or groups of glomeruli has been corroborated on an intra- and inter-animal basis under anesthetized conditions with this noninvasive method. Although the averaged BOLD activation maps over continuous odor exposures are in general agreement with 2-DG maps, the temporal variations of the activity during the prolonged exposure provide insight into the dynamic nature of the odor-induced patterns. With respect to the BOLD fMRI method, although the activities in the GL and EPL are in accord with the general belief that the BOLD signal is colocalized with synaptic activities, the findings of activation in the ONL, which contains unmyelinated fibers and glial cells and is devoid of synapses has important implications for the interpretation of the cellular basis of the BOLD signal in other parts of the brain. In conclusion, BOLD fMRI at 7 Tesla has the spatial resolution to differentiate olfactory activation in different layers of the rat OB and the temporal resolution to detect dynamic changes of the odor response in the OB. Because of its capability to map noninvasively and repeatedly the entire rat brain, BOLD fMRI is ideal for systematic studies of brain function at the level of individual laminar and modules.
Acknowledgments
We thank Scott McIntyre, Peter Brown, and Terry Nixon for the maintenance and improvement of the spectrometer, and Drs. Douglas Rothman and Kevin Behar for their helpful comments. This work was supported by Grants RO1-DC03710–01 (R.G.S.), RO1-DC00086–31 (G.M.S.), RO1-MH52550–5 (G.M.S.) (Human Brain Project), NS10174 (C.A.G.), and DC00210 (C.A.G.) from the National Institutes of Health.
ABBREVIATIONS
- fMRI
functional MRI
- BOLD
blood oxygen level dependent
- OB
olfactory bulb
- GL
glomerular layer
- ONL
olfactory nerve layer
- EPL
external plexiform layer
- OSN
olfactory sensory neuron
- 2-DG
2-deoxyglucose autoradiography
References
- 1.Steward W B, Kauer J S, Shepherd G M. J Comp Neurol. 1979;185:715–734. doi: 10.1002/cne.901850407. [DOI] [PubMed] [Google Scholar]
- 2.Greer C A, Stewart W B, Teicher M H, Shepherd G M. J Neurosci. 1982;2:1744–1759. doi: 10.1523/JNEUROSCI.02-12-01744.1982. [DOI] [PMC free article] [PubMed] [Google Scholar]
- 3.Jourdan F, Duveau A, Astic L, Holley A. Brain Res. 1980;188:139–154. doi: 10.1016/0006-8993(80)90563-6. [DOI] [PubMed] [Google Scholar]
- 4.Astic L, Saucier D. Brain Res Bull. 1986;16:445–454. doi: 10.1016/0361-9230(86)90172-3. [DOI] [PubMed] [Google Scholar]
- 5.Mori K, Mataga N, Imamura K. J Neurophysiol. 1992;67:786–789. doi: 10.1152/jn.1992.67.3.786. [DOI] [PubMed] [Google Scholar]
- 6.Guthrie K M, Anderson A J, Leon M, Gall C. Proc Natl Acad Sci USA. 1993;90:3329–3333. doi: 10.1073/pnas.90.8.3329. [DOI] [PMC free article] [PubMed] [Google Scholar]
- 7.Sallaz M, Jourdan F. NeuroReports. 1993;4:55–58. doi: 10.1097/00001756-199301000-00014. [DOI] [PubMed] [Google Scholar]
- 8.Senseman D M. J Neurosci. 1996;16:313–324. doi: 10.1523/JNEUROSCI.16-01-00313.1996. [DOI] [PMC free article] [PubMed] [Google Scholar]
- 9.Ogawa S, Menon R S, Tank D W, Ellermann J M, Kim S G, Merkle H, Ugurbil K. Biophysics J. 1993;64:803–812. doi: 10.1016/S0006-3495(93)81441-3. [DOI] [PMC free article] [PubMed] [Google Scholar]
- 10.Hyder F, Behar K L, Martin M A, Blamire B A, Shulman R G. J Cereb Blood Flow Metab. 1994;14:649–655. doi: 10.1038/jcbfm.1994.81. [DOI] [PubMed] [Google Scholar]
- 11.Yang X, Hyder F, Shulman R G. Proc Natl Acad Sci USA. 1996;93:475–478. doi: 10.1073/pnas.93.1.475. [DOI] [PMC free article] [PubMed] [Google Scholar]
- 12.Yang X, Hyder F, Shulman R G. Magn Reson Med. 1997;38:874–877. doi: 10.1002/mrm.1910380604. [DOI] [PubMed] [Google Scholar]
- 13.Sharp F R, Kauer J S, Shepherd G M. J Neurophysiol. 1977;40:800–813. doi: 10.1152/jn.1977.40.4.800. [DOI] [PubMed] [Google Scholar]
- 14.Hyder F, Rothman D L, Blaimire A M. Magn Reson Med. 1995;13:97–103. doi: 10.1016/0730-725x(94)00068-e. [DOI] [PubMed] [Google Scholar]
- 15.Hu X, Le T H, Parrish T, Erhard P. Magn Reson Med. 1995;34:201–212. doi: 10.1002/mrm.1910340211. [DOI] [PubMed] [Google Scholar]
- 16.Ostrowski N L, Lolait S J, Young W S., 3rd Endocrinology. 1994;135:1511–1528. doi: 10.1210/endo.135.4.7925112. [DOI] [PubMed] [Google Scholar]
- 17.Hinds J W, Hinds P L. J Comp Neurol. 1976;169:15–40. doi: 10.1002/cne.901690103. [DOI] [PubMed] [Google Scholar]
- 18.Kossut M, Hand P J, Greenberg J, Hand C L. J Neurophysiol. 1988;60:829–852. doi: 10.1152/jn.1988.60.2.829. [DOI] [PubMed] [Google Scholar]
- 19.Hyder F, Rothman D L, Mason G F, Behar K L, Shulman R G. J Cereb Blood Flow Metab. 1997;17:1040–1047. doi: 10.1097/00004647-199710000-00005. [DOI] [PubMed] [Google Scholar]
- 20.Ueki M, Linn F, Hossmann K A. J Cereb Blood Flow Metab. 1988;8:486–494. doi: 10.1038/jcbfm.1988.89. [DOI] [PubMed] [Google Scholar]
- 21.Ritchie J M. Prog Biophys Mol Biol. 1973;26:147–187. doi: 10.1016/0079-6107(73)90019-9. [DOI] [PubMed] [Google Scholar]
- 22.Bhalla U S, Bower J M. J Comput Neurosci. 1997;4:221–256. doi: 10.1023/a:1008819818970. [DOI] [PubMed] [Google Scholar]
- 23.Bojsen-Moller F, Fahrenkrug J. J Anat. 1971;101:25–37. [PMC free article] [PubMed] [Google Scholar]
- 24.Eccles R. Acta Otolaryngol. 1978;85:431–436. doi: 10.3109/00016487809121472. [DOI] [PubMed] [Google Scholar]
- 25.Cobb S, Talbott J H. Trans Assoc Am Physicians. 1927;42:255–262. [Google Scholar]
- 26.Hyder, F., Shulman, R. G. & Rothman, D. L. (1998) J. Appl. Physiol., in press. [DOI] [PubMed]
- 27.van Zijl P C, Eleff S M, Ulatowski J A, Oja J M, Ulug A M, Traystman R J, Kauppinen R A. Nat Med. 1998;4:159–167. doi: 10.1038/nm0298-159. [DOI] [PubMed] [Google Scholar]
- 28.Greer C A, Stewart W B, Kauer J S, Shepherd G M. Brain Res. 1981;217:279–293. doi: 10.1016/0006-8993(81)90004-4. [DOI] [PubMed] [Google Scholar]
- 29.Benson T E, Burd G D, Greer C A, Landis D M, Shepherd G M. Brain Res. 1985;339:67–78. doi: 10.1016/0006-8993(85)90622-5. [DOI] [PubMed] [Google Scholar]
- 30.Mori K, Yoshihara Y. Prog Neurobiol. 1995;45:585–620. doi: 10.1016/0301-0082(94)00058-p. [DOI] [PubMed] [Google Scholar]
- 31.Cinelli A R, Hamilton K A, Kauer J S. J Neurophysiol. 1995;73:2053–2071. doi: 10.1152/jn.1995.73.5.2053. [DOI] [PubMed] [Google Scholar]
- 32.Ressler K J, Sullivan S L, Buck L B. Cell. 1994;79:1245–1255. doi: 10.1016/0092-8674(94)90015-9. [DOI] [PubMed] [Google Scholar]
- 33.Vassar R, Chao S K, Sitcheran R, Nunez J M, Vosshall L B, Axel R. Cell. 1994;79:981–991. doi: 10.1016/0092-8674(94)90029-9. [DOI] [PubMed] [Google Scholar]
- 34.Mombaerts P, Wang F, Dulac C, Chao S K, Nemes A, Mendelsohn M, Edmondson J, Axel R. Cell. 1996;87:675–686. doi: 10.1016/s0092-8674(00)81387-2. [DOI] [PubMed] [Google Scholar]
- 35.Singer M S, Oliveira L, Vriend G, Shepherd G M. Receptors Channels. 1995;3:89–95. [PubMed] [Google Scholar]


