
Figure 6.
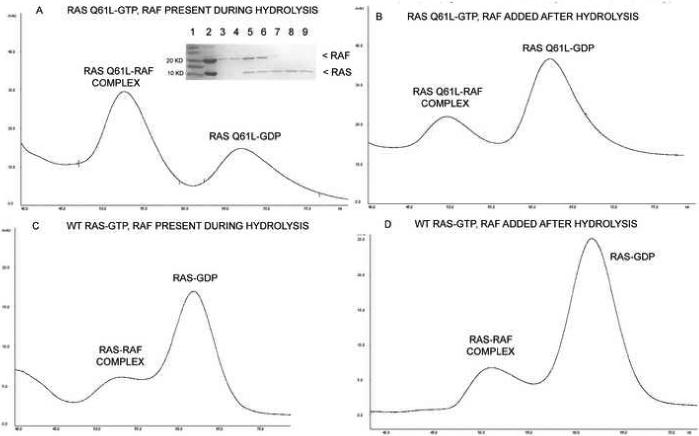
Gel filtration chromatography results from the hydrolysis experiments. A) RasQ61L incubated with Raf. The contents of the elution peaks are shown in the inserted SDS gel. Lane 1: MW markers; Lane 2: sample injected into the column; Lanes 3 and 4: Raf, which tends to aggregate at 4°C and elute near the void volume (not shown in elution profile); Lanes 5 and 6: fractions taken from the first elution peak showing a 1:1 ratio of Raf and Ras; Lanes 7, 8 and 9: second elution peak containing the Ras protein. B) RasQ61L incubated without Raf. C) Wild type Ras incubated with Raf. D) Wild type Ras incubated without Raf. For results shown in B and D Raf was added before gel filtration.