Abstract
Prostaglandin D2 (PGD2) is an extensively studied sleep-promoting substance, but the neuroanatomical basis of PGD2-induced sleep is only partially understood. To determine potential regions involved in this response, we used Fos immunohistochemistry to identify neurons activated by infusion of PGD2 into the subarachnoid space below the rostral basal forebrain. PGD2 increased nonrapid eye movement sleep and induced striking expression of Fos in the ventrolateral preoptic area (VLPO), a cluster of neurons that may promote sleep by inhibiting the tuberomammillary nucleus, the source of the ascending histaminergic arousal system. Fos expression in the VLPO was positively correlated with the preceding amount of sleep and negatively correlated with Fos expression in the tuberomammillary nucleus. PGD2 also increased Fos immunoreactivity in the basal leptomeninges and several regions implicated in autonomic regulation. These observations suggest that PGD2 may induce sleep via leptomeningeal PGD2 receptors with subsequent activation of the VLPO.
Wakefulness, rapid eye movement (REM) sleep, and non-REM (NREM) sleep are driven by unique patterns of neuronal activity in specific wake- and sleep-generating systems. The immediate early gene product, Fos, is a useful marker of neuronal activation (1) that has facilitated the identification of wake- and sleep-active neurons. Using Fos immunohistochemistry, we recently identified a discrete cluster of neurons within the ventrolateral preoptic area (VLPO) that may play a critical role in the generation of sleep (2). The VLPO sends specific GABAergic (GABA = γ-aminobutyric acid) and galanin-ergic efferents to the core of the tuberomammillary nucleus (TMN) (3), the source of the ascending histaminergic arousal system and receives afferents from the suprachiasmatic nucleus and retina (unpublished observations). Firing rates of most VLPO neurons are low during wakefulness and twice as high during NREM and REM sleep (R. Szymusiak, personal communication), and lesions of the preoptic area that include the VLPO result in a marked reduction in sleep (4, 5). Taken together, these findings indicate that the VLPO may play a critical role in the promotion of both NREM and REM sleep.
Prostaglandin D2 (PGD2) is an extensively studied sleep-promoting substance that may produce sleep through activation of the VLPO. Injection of PGD2 into the subarachnoid space produces large increases in NREM sleep, and injections just anterior and ventral to the VLPO produce the greatest response (6). Conversely, inhibition of PGD2 synthesis with selenium compounds produces severe insomnia (7). PGD2’s sleep-promoting effect may be mediated via the meninges as PGD2 receptor mRNA is found only in the leptomeninges but not in brain parenchyma (8, 9). Morairty and colleagues recently showed that animals with lesions of the VLPO region lack the increased sleep typically induced by PGD2 (S. Morairty, personal communication), suggesting that PGD2’s somnogenic effects may be mediated through the VLPO.
To determine which neural regions are involved in the response to PGD2, we used Fos immunohistochemistry to identify neurons activated by infusion of PGD2 into the subarachnoid space. PGD2 increased NREM sleep and induced striking expression of Fos in the VLPO, the basal leptomeninges, and in several other brain regions that may contribute to sleep.
MATERIALS AND METHODS
Animals and Surgical Preparation.
Twelve specific pathogen-free, male Sprague–Dawley rats weighing 260–330 g were used in this study. The animals had unrestricted access to food and water and were housed in a room maintained at 21.5–22.5°C. Experimental procedures were approved by the Animal Care and Use Committee of Osaka Bioscience Institute. Under pentobarbital anesthesia (50 mg/kg i.p.), rats underwent surgery for implantation of electrodes for electroencephalogram and electromyogram recordings and placement of a stainless steel cannula (0.35 mm OD) for infusion of PGD2. The cannulae were inserted in a midline position, 1.1 mm anterior to bregma, to a depth of 7.8 mm below the dura. The cannulae thus were directed at the subarachnoid space under the rostral basal forebrain, the area defined as a PGD2-sensitive sleep-promoting zone (6). Postoperatively, the animals were housed individually for 8–10 days in a sound-proof chamber maintained on a 12:12-h light-dark cycle (lights on at 08:00).
Sleep Physiology Technique and Data Analysis.
Before the experiment, 0.9% saline was continuously infused for 3 days through the implanted cannulae at the rate of 0.4 μl/min. On the experimental day, PGD2 (200 pmol/0.4 μl saline per min) was infused from 20:00 to 22:00 in the experimental group, whereas infusion of 0.9% saline was continued in animals of the control group. Both solutions had a pH of 7.0 and osmolality of 285. Details of the scoring of sleep-wake stages and the experimental system have been described previously (10).
Histochemical Techniques.
Two hours after the initiation of the infusion, the animals were deeply anesthetized with pentobarbital (150 mg/kg i.p.) and perfused transcardially with 0.9% saline for 5 min followed by 500 ml of phosphate-buffered 4% paraformaldehyde (pH 7.0). The brains were postfixed, equilibrated in sucrose, and stored at 4°C. Four series of coronal sections were cut at 40 μm on a freezing microtome.
Fos immunohistochemistry was performed as previously described (11). Briefly, sections were incubated with a rabbit primary antiserum for the N-terminal domain of Fos with no known crossreactivity with any identified Fos-related antigens (Ab5, Oncogene Science; 1:150,000 dilution). Sections subsequently were incubated with a biotinylated goat anti-rabbit IgG (Vector Laboratories; 1:1,000 dilution) and then reacted with avidin-biotin complex (ABC, Vector Elite Kit, 1:500 dilution). A combination of diaminobenzidine tetrahydrochloride, nickel ammonium sulfate, and cobalt chloride was used for the chromogen reaction, producing a black reaction product in cell nuclei. Omission of the primary antiserum or incubation of the tissue in antiserum that had been preadsorbed with the Fos antigen (peptide-2, Oncogene; 15 μM) resulted in no specific staining.
Histologic Data Analysis.
Sections were observed with a Leitz Laborlux microscope for neurons containing Fos-like immunoreactivity (Fos-IR). We quantified the relative number of cells containing Fos-IR for two key sleep/wake regulatory regions, the VLPO and the TMN. PGD2 produced a distinct pattern of neuronal Fos in several other regions, and we therefore quantified Fos-IR in the supraoptic nucleus (SON), the paraventricular nucleus of the hypothalamus, the laterodorsal subnucleus of the bed nucleus of the stria terminalis (BSTLD), the lateral subdivision of the central nucleus of the amygdala (CeL), the ventrolateral column of the periaqueductal gray, the central and external lateral subnuclei of the parabrachial nucleus (PBcl and PBel), and the nucleus of the solitary tract just anterior to the area postrema. These nuclear regions were identified by using darkfield microscopy. A treatment-blinded examiner counted clearly stained Fos-immunoreactive nuclei bilaterally in three consecutive sections containing the largest part of the nucleus, and those six counts then were averaged. Because the parabrachial nucleus and the CeL are relatively small, only two sections were counted per animal. PGD2 induced marked Fos-IR in the meninges, and thus in parenchymal regions abutting the meninges (VLPO, TMN, and SON) cells were not counted within 50 μm of the meninges. Because the boundaries of the VLPO are indistinct, the area of quantification was delineated with a rectangle located 160 μm caudal to the organum vasculosum of the lamina terminalis (OVLT) such that the medioventral edge abutted the lateral edge of the optic chiasm and extended 700 μm laterally and 300 μm dorsally into the lateral preoptic area (2). In all other regions, Fos-immunoreactive nuclei were counted within the full extent of a nucleus or subnucleus.
Statistical Analysis.
Mann–Whitney rank-sum tests were used to compare amounts of sleep and wakefulness between the PGD2 and vehicle groups during the 2-hr infusion period. Counts of Fos-immunoreactive nuclei in each anatomic region were compared by using Mann–Whitney tests with separate variances and a Bonferroni correction (Systat, Evanston, IL); P was considered significant if < 0.005 because 10 regions were studied. Counts of Fos-immunoreactive nuclei were not corrected for double-counting errors (12) because there was no change in sizes of labeled structures between groups and only relative, not absolute, values were sought. Cell counts and sleep/wake activity were correlated by using the Pearson correlation coefficient.
RESULTS
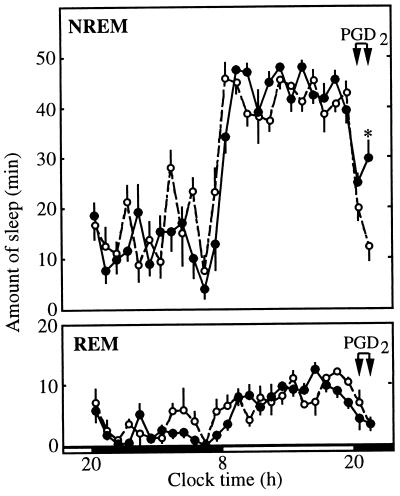
Compared with the infusion of vehicle, infusion of 200 pmol/min PGD2 increased the amount of NREM sleep but had little effect on REM sleep (Fig. 1). This effect was most evident in the second hour of the infusion (21:00–22:00) when NREM increased to 29.9 min compared with only 12.5 min in the vehicle-treated group (P < 0.01). Both groups had 3.4 min of REM during this period. Baseline recordings between 20:00 and 22:00 on the previous day revealed no differences between the groups in the amounts of NREM, REM, or wakefulness (data not shown).
Figure 1.
Effect of PGD2 on NREM and REM sleep. PGD2 (•) or vehicle (○) was infused near the preoptic recess from 20:00 to 22:00. During the second hour of this infusion, PGD2 increased the amount of NREM sleep compared with infusion of vehicle. PGD2 did not alter the amount of REM sleep. n = 6 in each group; ∗, P < 0.01.
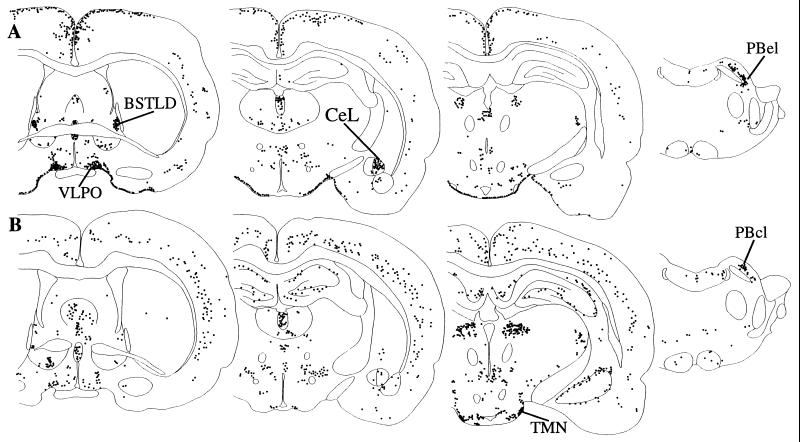
All brains consistently displayed Fos-IR in several regions (Fig. 2). In the forebrain, scattered cells were common in the glomerular and plexiform layers of the olfactory bulb. The cannula tracks passed vertically through the genu of the corpus callosum, usually terminating between the diagonal bands of Broca, just dorsal to the preoptic cistern; Fos-IR often was abundant within 100 μm of the cannula track, typically within the anterior cingulate and infralimbic cortices. In the thalamus, Fos-IR was common in the paraventricular nucleus of the thalamus, with occasional stained nuclei in the mediodorsal and central medial nuclei, the zona incerta, and lateral habenular nucleus. Moderate Fos-IR often was noted in the ventral lateral and medial geniculate nuclei. Hippocampal neurons contained variable amounts of Fos-IR in both groups. In the hypothalamus, neurons of the median preoptic nucleus often displayed moderate amounts of Fos-IR, particularly just above the OVLT. Fos-IR was not seen in the OVLT, subfornical organ, or other circumventricular organs. Scattered Fos-IR was noted infrequently in the anterior hypothalamic nucleus, dorsomedial nucleus of the hypothalamus, the dorsomedial subnucleus of the ventromedial nucleus, the lateral hypothalamic area, the supramammillary nucleus, and the posterior hypothalamic area. In the hindbrain, Fos-immunoreactive nuclei were common in the pontine nuclei, the superior and inferior colliculi, the spinal trigeminal nucleus, the parvocellular division of the lateral reticular nucleus, and the cochlear nuclei.
Figure 2.
A series of line drawings illustrating the distribution of Fos-IR after infusion of PGD2 (A) or vehicle (B). PGD2 induces Fos within the VLPO, BSTLD, CeL, and the basal meninges. Vehicle infusion is associated with intense Fos-IR in the TMN and moderate Fos-IR in the cortex. Within the parabrachial nucleus, PGD2 induces Fos-IR in the PBel but does not increase Fos-IR in the central lateral subnucleus over the amounts seen in controls. These drawings illustrate the Fos pattern seen in individual rats that received PGD2 (case R1335) or vehicle (R1337); Fos-IR in the cingulate cortex after PGD2 and in the hippocampus after vehicle only were seen in occasional animals.
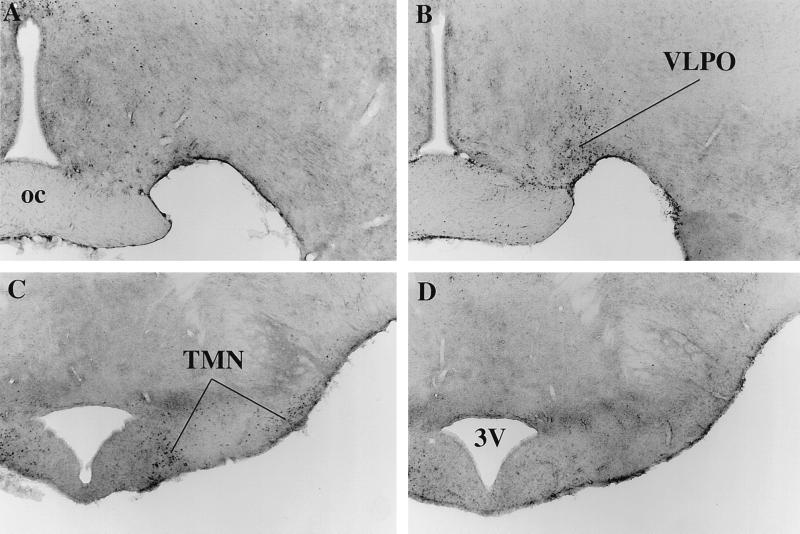
The VLPO of vehicle-treated rats contained very little Fos-IR, but the VLPO of PGD2-treated rats contained numerous Fos-immunoreactive nuclei (Fig. 3 A and B). This region of neuronal Fos-IR was most intense lateral to the optic chiasm, just behind the OVLT, and diminished caudally over 150 μm to terminate before the emergence of the SON. This region of staining extended dorsally into the lateral preoptic area without a distinct border. Occasional Fos-immunoreactive neurons were noted in the VLPO of vehicle-treated rats, but these were more diffuse and lacked the distinct clustering seen in the PGD2-treated animals.
Figure 3.
Effects of PGD2 on Fos-IR in key sleep/wake regulatory regions. Bright-field photomicrographs of the preoptic area demonstrate little Fos-IR after infusion of vehicle (A), but Fos-immunoreactive neurons are numerous in the VLPO after PGD2 (B). In the posterior hypothalamus, the TMN contains many Fos-immunoreactive neurons after infusion of vehicle (C), but not after PGD2 (D). oc, optic chiasm; 3V, third ventricle.
In contrast, Fos-IR was very common in the TMN of vehicle-treated rats, but rare in those treated with PGD2 (Fig. 3 C and D). These predominantly awake rats had large numbers of Fos-immunoreactive nuclei in the ventrolateral and medial clusters of the TMN, although fewer cells were seen in the caudal (postmammillary) part of the ventrolateral group.
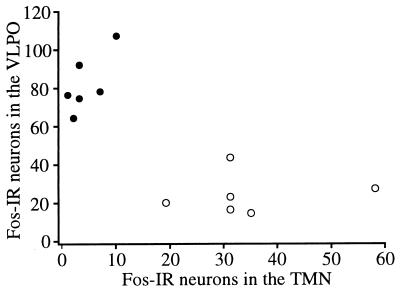
To verify these observations more rigorously, Fos-immunoreactive neuronal nuclei were counted in the VLPO and the ventrolateral subdivision of the tuberal TMN. More than three times as many Fos-immunoreactive nuclei were present in the VLPO of PGD2-treated rats compared with the vehicle controls (83 vs. 25 cells, respectively, P < 0.005). Conversely, the TMN of PGD2-treated rats contained one-eighth as many Fos-positive nuclei as seen in the vehicle-treated rats (4 vs. 34 cells, P < 0.005). Because the VLPO and TMN may have reciprocal, inhibitory projections (2, 3), we examined the relation of Fos expression in the VLPO to Fos in the TMN. Fos expression in the VLPO and TMN exhibited a moderately strong negative correlation (Pearson r = −0.76) (Fig. 4).
Figure 4.
Fos-IR within the VLPO is inversely correlated with Fos-IR in the TMN. Rats treated with PGD2 (•) have abundant Fos-IR in the VLPO, but have little Fos-IR in the TMN. Conversely, rats treated with vehicle (○) have variable but moderate amounts of Fos-IR in the TMN, but relatively few Fos-immunoreactive neurons in the VLPO. Pearson r = −0.76.
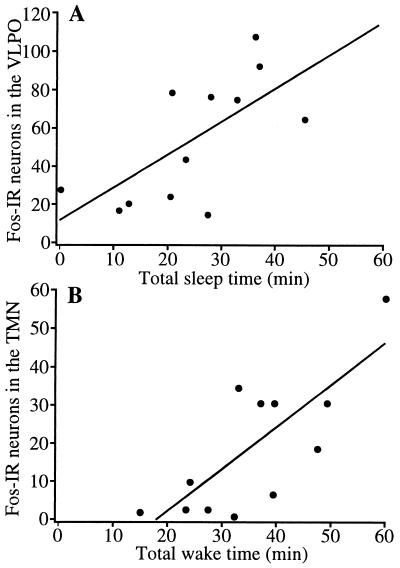
As we have shown previously for spontaneous sleep (2), Fos-IR in the VLPO of animals treated with PGD2 or vehicle was positively correlated with the total amount of sleep in the hour before the animal was killed (Pearson r = 0.67, P < 0.02) (Fig. 5). In addition, Fos-IR in the TMN correlated well with the amount of wakefulness in the hour preceding sacrifice (Pearson r = 0.76, P < 0.005).
Figure 5.
Fos-IR in sleep/wake regulatory regions is correlated with the total amount of sleep or wakefulness. (A) Increased sleep in the hour preceding sacrifice is associated with abundant Fos expression in VLPO neurons. r = 0.67; P < 0.02. (B) Increased time spent awake is associated with an increased number of Fos-immunoreactive neurons in the TMN. r = 0.76; P < 0.005.
Vehicle-treated rats also had Fos-IR in other regions that may be involved in the generation of sleep and wakefulness. For example, Fos-immunoreactive neurons were common in laminas 2, 3, and 5 of the frontal, parietal, and occipital cortices of most vehicle-treated rats, but were uncommon in PGD2-treated animals. In all rats, Fos-IR was very rare in the basal forebrain, suprachiasmatic nucleus, the reticular nucleus of the thalamus, and in hindbrain arousal regions such as the dorsal raphe, laterodorsal and pedunculopontine nuclei, ventral tegmentum, interpeduncular nucleus, and locus coeruleus; within these regions, no differences were evident between the PGD2 and vehicle groups.
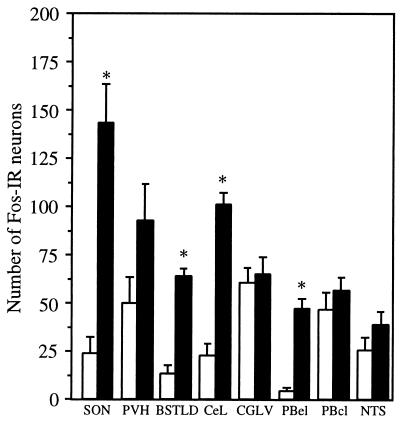
Treatment with PGD2 elicited a striking pattern of Fos-IR in several regions traditionally implicated in autonomic regulation (Figs. 2 and 6). PGD2 treatment produced a 6-fold increase in the number of Fos-immunoreactive nuclei throughout the SON. PGD2 treatment produced a sharply demarcated cluster of Fos-IR in the BSTLD, with occasional stained nuclei in the anterolateral subnucleus, but Fos-IR was uncommon in other subnuclei. The CeL also exhibited very focal Fos-IR after PGD2, with little staining in the medial subdivision or other regions of the amygdala. Between the BSTLD and CeL, occasional scattered Fos-immunoreactive nuclei were seen in the sublenticular portions of the extended amygdala in PGD2-treated rats. Fos-IR was very common in the lateral division of the parabrachial nucleus with moderately intense Fos-IR in the central lateral subnucleus of all animals. In contrast, markedly specific expression of Fos was present in the external lateral subnucleus, with nearly 12 times as many Fos-positive nuclei in the PGD2-treated brains. Fos-IR occasionally was present in the internal lateral, ventral lateral, and dorsal lateral parabrachial subnuclei.
Figure 6.
Infusion of PGD2 increases the relative number of Fos-immunoreactive neurons in several autonomic regions. Clear increases are evident in the SON, BSTLD, CeL, and PBel. Small, but statistically insignificant, increases are present in the paraventricular nucleus (PVH), ventrolateral column of the periaqueductal gray (CGLV), central lateral subnucleus of the parabrachial nucleus (PBcl), and nucleus of the tractus solitarius (NTS). Empty bars represent vehicle-treated rats, and filled bars represent rats treated with PGD2; ∗, P < 0.005.
PGD2 produced smaller increases in Fos-IR in several other regions. PGD2 inconsistently induced moderate Fos-IR in the cingulate and adjacent frontal cortex. Moderate Fos-IR was common in the paraventricular nucleus of the hypothalamus and in the ventrolateral column of the periaqueductal gray of PGD2-treated rats, but no quantitative difference was evident between groups. Only scattered Fos-IR was seen in the lateral column of the periaqueductal gray. Fos-immunoreactive nuclei appeared more common in the nucleus of the solitary tract of PGD2-treated rats, particularly in the medial subdivision, but this difference was not statistically significant. PGD2 did not elicit a distinct pattern of Fos in the rostral or caudal ventrolateral medulla, or the infralimbic and entorhinal cortices.
These regions produce coordinated autonomic responses, and Fos-IR in one region was often indicative of Fos expression in other autonomic regulatory sites. Pearson correlations were highly significant (R > 0.9, P < 0.002) between the number of Fos-immunoreactive nuclei in the PBel and the BSTLD, CeL, and SON. The BSTLD and the CeL have very similar connections, and this is reflected in their extraordinarily synchronous Fos expression (r = 0.99, P < 0.0001). Though not as tightly linked, Fos-IR in the VLPO was positively correlated with Fos-IR in the SON, BSTLD, CeL, and PBel (R > 0.85, P < 0.02).
All PGD2-treated rats had intense expression of Fos within the basal leptomeninges. This Fos-IR was most evident in the leptomeninges below the hypothalamus (Fig. 7) and was accompanied by moderate Fos-IR within the cell-sparse parenchyma anterior to the OVLT, just below the diagonal band of Broca. Lesser amounts of meningeal Fos were common around the mammillary body with extension down around the brainstem, but Fos was uncommon in the meninges overlying the cerebral or cerebellar hemispheres. In regions of high meningeal Fos-IR, small penetrating blood vessels often were accompanied by spindle-shaped Fos-immunoreactive nuclei within the first 100–200 μm of the Virchow-Robin space. No Fos-IR was seen in the leptomeninges of vehicle-treated rats or in the choroid plexus or ependyma of any rat.
Figure 7.
Infusion of PGD2 (A) but not vehicle (B) induces marked Fos-IR in the leptomeninges, especially between the optic chiasm (oc) and the horizontal nucleus of the diagonal band of Broca (HDB).
DISCUSSION
We found that infusion of PGD2 into the subarachnoid space just anterior to the preoptic area induced Fos-IR in the VLPO in association with an increase in NREM sleep. This neuronal activation was accompanied by increased Fos-IR in the basal meninges, BSTLD, CeL, and PBel, with a decrease of Fos in putative wake-active neurons of the TMN. These observations suggest that PGD2 may induce sleep via meningeal PGD2 receptors with subsequent activation of the VLPO.
Combining PGD2 infusion with Fos immunohistochemistry allowed us to identify candidate brain regions involved in sleep and wakefulness, but some technical limitations should be noted. Penetration of the brain by the cannula produced a small amount of injury and induced Fos within the infralimbic and anterior cingulate cortices, hindering the interpretation of Fos-IR within these regions. Among the major subcortical arousal regions, only the TMN consistently produced Fos in our control rats; several brain regions known to be physiologically active during wakefulness such as the locus coeruleus or basal forebrain did not contain Fos-IR even in this predominantly awake group. The presence of Fos is a useful indicator of neuronal activity, but the absence of Fos does not exclude participation of these other regions in state control. In fact, other researchers have reported Fos-IR in locus coeruleus neurons during wakefulness (13), and the lack of locus coeruleus Fos in our study may be caused by the use of a different strain of rats or a new primary antiserum that is very specific for Fos but not Fos-related antigens.
The physiology and neurochemistry of PGD2 has been extensively studied, and our observations indicate potential neuroanatomic pathways through which PGD2 may induce sleep. PGD2 does not promote sleep when infused below the posterior hypothalamus (6), and it is thus unlikely that wake-promoting neurons of the TMN are directly inhibited by PGD2. PGD2 induces sleep most effectively when infused into the subarachnoid space just anterior to the preoptic area (6), and PGD2 can increase the firing rates of sleep-active preoptic neurons (14). Within the preoptic area, sleep-active neurons are most abundant in the VLPO region (R. Szymusiak, personal communication). We now have shown that PGD2 induces Fos-IR in the VLPO in proportion to the production of sleep. Considered together, these observations indicate that PGD2 may stimulate sleep-active VLPO neurons.
The VLPO may induce sleep through inhibition of wake-promoting TMN neurons. The VLPO projects heavily to the proximal dendrites and soma of TMN neurons, and most of these axons contain GABA and galanin (2, 3). Neurons of the TMN are tonically active during waking, less active during NREM sleep, and cease firing during REM sleep (15). GABA levels are elevated in the posterior hypothalamus during sleep (16), and electrical stimulation of the lateral preoptic area can elicit GABAA-mediated inhibitory postsynaptic potentials in TMN neurons (17). Galanin also hyperpolarizes and decreases the firing rate of TMN neurons (18). The highly sensitive Fos antiserum used in our current study has permitted anatomic identification of wake-active TMN neurons and the demonstration of an inverse relationship between Fos-IR in the VLPO and TMN. These findings indicate that when the VLPO is active, the TMN is inactive, thus further supporting the hypothesis that GABAergic or galanin-ergic projections from the VLPO contribute to the inhibition of the TMN during sleep.
Our observation that PGD2 induces Fos-IR in the leptomeninges suggests that PGD2 activates the VLPO via leptomeningeal PGD2 receptors. This route appears most likely because PGD2 receptors are found ubiquitously in the leptomeninges (8, 9), but are rare within the preoptic area (19, 20). In addition, PGD2 is most effective when infused into the subarachnoid space just anterior to the VLPO, but is less effective in the parenchyma (6). Satoh and colleagues recently demonstrated that PGD2-induced sleep is attenuated by an adenosine A2 antagonist (21). Thus, PGD2 may promote sleep by inducing meningeal cells to release paracrine signaling molecules such as adenosine, which subsequently excite nearby sleep-active VLPO neurons. However, meningeal Fos-IR is not evident in spontaneously sleeping rats. If PGD2 contributes to spontaneous sleep, it must do so at a lower concentration than used in these experiments, a concentration sufficient to induce Fos in the VLPO but not in the meninges.
Expression of Fos in the BSTLD, CeL, and PBel may be related to the production of sleep, autonomic changes associated with sleep, or autonomic perturbations independent of sleep. Sterman and Clemente found that stimulation of the amygdala can induce sleep (22), and sleep-active neurons have been identified in the CeL and other regions of the amygdala (23, 24). We have found that spontaneously sleeping rats and those sleeping after sleep deprivation have more Fos-IR in the BSTLD and CeL than rats that were awake in the hour preceding sacrifice (unpublished observations). Thus, some of these regions may promote sleep or the autonomic changes that accompany sleep. PGD2 also can directly influence a variety of autonomic functions, including osmoregulation, temperature regulation, neuroendocrine control, pain perception, and vasomotor control. For example, intraventricular injection of PGD2 can elicit transient increases in vasopressin and blood pressure (25), and PGD2-induced Fos-IR in the SON and paraventricular nucleus of the hypothalamus may be related to vasopressin release. Further studies are needed to define the precise role of these regions in the control of sleep and autonomic function.
We have demonstrated that infusion of PGD2 increases NREM sleep, induces Fos in the VLPO and leptomeninges, and decreases Fos in the TMN. We hypothesize that via leptomeningeal receptors, PGD2 activates VLPO neurons that inhibit the TMN, thus promoting sleep. Future experiments to identify the role of PGD2 in spontaneous sleep and to determine the precise mechanisms by which PGD2 activates the VLPO should provide important insights into the molecular mechanisms of sleep.
Acknowledgments
We are grateful to Prof. T. Kaneko (Kyoto University), Prof. S. Inouye (Tokyo Medical and Dental University), and Prof. N. Mizuno (Tokyo Metropolitan Institute for Neuroscience) for critical readings of this manuscript and useful discussion. This study was supported by grants from the National Institutes of Health (NS-33987 to C.S and T.S.), the Ministry of Education, Science, and Culture of Japan (P97149 to D.G.; 07558108 and 07457033 to Y.U.), and the Ministry of Health and Welfare of Japan (100107 to O.H.).
ABBREVIATIONS
- REM
rapid eye movement
- NREM
non-REM
- VLPO
ventrolateral preoptic area
- TMN
tuberomammillary nucleus
- PGD2
prostaglandin D2
- GABA
γ-aminobutyric acid
- Fos-IR
Fos-like immunoreactivity
- SON
supraoptic nucleus
- BSTLD
laterodorsal subnucleus of the bed nucleus of the stria terminalis
- CeL
lateral subdivision of the central nucleus of the amygdala
- PBel
external lateral subnuclei of the parabrachial nucleus
- OVLT
organum vasculosum of the lamina terminalis
References
- 1.Sagar S M, Sharp F R, Curran T. Science. 1988;240:1328–1331. doi: 10.1126/science.3131879. [DOI] [PubMed] [Google Scholar]
- 2.Sherin J E, Shiromani P J, McCarley R W, Saper C B. Science. 1996;271:216–219. doi: 10.1126/science.271.5246.216. [DOI] [PubMed] [Google Scholar]
- 3.Sherin, J. E., Elmquist, J. K., Torrealba, F. & Saper, C. B. (1998) J. Neurosci. in press. [DOI] [PMC free article] [PubMed]
- 4.Sallanon M, Denoyer M, Kitahama K, Aubert C, Gay N, Jouvet M. Neuroscience. 1989;32:669–683. doi: 10.1016/0306-4522(89)90289-3. [DOI] [PubMed] [Google Scholar]
- 5.Szymusiak R, McGinty D. Exp Neurol. 1986;94:598–614. doi: 10.1016/0014-4886(86)90240-2. [DOI] [PubMed] [Google Scholar]
- 6.Matsumura H, Nakajima T, Osaka T, Satoh S, Kawase K, Kubo E, Kantha S S, Kasahara K, Hayaishi O. Proc Natl Acad Sci USA. 1994;91:11998–12002. doi: 10.1073/pnas.91.25.11998. [DOI] [PMC free article] [PubMed] [Google Scholar]
- 7.Matsumura H, Takahata R, Hayaishi O. Proc Natl Acad Sci USA. 1991;88:9046–9050. doi: 10.1073/pnas.88.20.9046. [DOI] [PMC free article] [PubMed] [Google Scholar]
- 8.Oida H, Hirata M, Sugimoto Y, Ushikubi F, Ohishi H, Mizuno N, Ichikawa A, Narumiya S. FEBS Lett. 1997;417:53–56. doi: 10.1016/s0014-5793(97)01253-2. [DOI] [PubMed] [Google Scholar]
- 9.Gerashchenko, D., Beuckmann, C. T., Kanaoka, Y., Eguchi, N., Gordon, W. C., Urade, Y., Bazan, N. G. & Hayaishi, O. (1998) J. Neurochem., in press. [DOI] [PubMed]
- 10.Gerashchenko D, Matsumura H. Am J Physiol. 1996;270:R855–R863. doi: 10.1152/ajpregu.1996.270.4.R855. [DOI] [PubMed] [Google Scholar]
- 11.Elmquist J K, Scammell T E, Jacobson C D, Saper C B. J Comp Neurol. 1996;371:85–103. doi: 10.1002/(SICI)1096-9861(19960715)371:1<85::AID-CNE5>3.0.CO;2-H. [DOI] [PubMed] [Google Scholar]
- 12.Konigsmark B W. In: Methods for the Counting of Neurons. Nauta W J H, Ebbesson S O E, editors. Heidelberg: Springer; 1970. pp. 315–338. [Google Scholar]
- 13.Tononi G, Pompeiano M, Cirelli C. Brain Res Bull. 1994;35:589–596. doi: 10.1016/0361-9230(94)90173-2. [DOI] [PubMed] [Google Scholar]
- 14.Koyama Y, Hayaishi O. Brain Res Bull. 1994;33:367–372. doi: 10.1016/0361-9230(94)90278-x. [DOI] [PubMed] [Google Scholar]
- 15.Vanni-Mercier G, Sakai K, Jouvet M. C R Acad Sci III. 1984;298:195–200. [PubMed] [Google Scholar]
- 16.Nitz D, Siegel J M. Am J Physiol. 1996;271:R1707–R1712. doi: 10.1152/ajpregu.1996.271.6.R1707. [DOI] [PMC free article] [PubMed] [Google Scholar]
- 17.Yang Q Z, Hatton G I. Brain Res. 1997;773:162–172. doi: 10.1016/s0006-8993(97)00932-3. [DOI] [PubMed] [Google Scholar]
- 18.Schonrock B, Busselberg D, Haas H L. Agents Actions. 1991;33:135–137. doi: 10.1007/BF01993148. [DOI] [PubMed] [Google Scholar]
- 19.Shimizu T, Yamashita A, Hayaishi O. J Biol Chem. 1982;257:13570–13575. [PubMed] [Google Scholar]
- 20.Watanabe Y, Watanabe Y, Hamada K, Bommelaer-Bayt M C, Dray F, Kaneko T, Yumoto N, Hayaishi O. Brain Res. 1989;478:143–148. doi: 10.1016/0006-8993(89)91486-8. [DOI] [PubMed] [Google Scholar]
- 21.Satoh S, Matsumura H, Suzuki F, Hayaishi O. Proc Natl Acad Sci USA. 1996;93:5980–5984. doi: 10.1073/pnas.93.12.5980. [DOI] [PMC free article] [PubMed] [Google Scholar]
- 22.Sterman M B, Clemente C D. Exp Neurol. 1962;6:91–102. doi: 10.1016/0014-4886(62)90080-8. [DOI] [PubMed] [Google Scholar]
- 23.Jacobs B L, McGinty D J. Exp Neurol. 1971;33:1–15. doi: 10.1016/0014-4886(71)90097-5. [DOI] [PubMed] [Google Scholar]
- 24.Szymusiak R, McGinty D. Brain Res Bull. 1989;22:423–430. doi: 10.1016/0361-9230(89)90069-5. [DOI] [PubMed] [Google Scholar]
- 25.Inoue M, Crofton J T, Share L. Am J Physiol. 1991;261:R420–R426. doi: 10.1152/ajpregu.1991.261.2.R420. [DOI] [PubMed] [Google Scholar]


