

Summary
A C-to-A base substitution has been identified at bp -571 in the IL-10 promoter and has been linked to numerous diseases. To investigate the role of this polymorphism on IL-10 production, T cells, B cells and monocytes were enriched from peripheral blood from subjects either homozygous for the C or A allele. Treatment of monocytes and B cells with lipopolysaccharide from individuals homozygous for the C allele resulted in higher levels of IL-10 production as compared to monocytes from individuals homozygous for the A allele. Though not statistically significant, when B cells were treated with anti-IgM or T cells with concanavalin A higher levels of IL-10 were produced from individuals homozygous for the A allele. Changes in IL-10 protein production were paralleled by similar changes in IL-10 mRNA production. These results demonstrate that changes in IL-10 production observed due to the -571 genotype depend on both cell type and stimulus.
Keywords: Interleukin-10, polymorphism, genetics, lymphocytes
Introduction
IL-10 is a unique cytokine displaying both pro- and anti-inflammatory effects in immunoregulation [1]. In humans, monocytes are the major source for IL-10 production [2, 3] with additional amounts being generated by T cells, B cells [4, 5], myeloid dendritic cells (DC) [6] and mast cells [7]. Of the T cell subsets, the regulatory T cells are the primary cell types responsible for IL-10 production [8, 9]. As part of its anti-inflammatory capability, IL-10 inhibits Th1 production of IFN-γ and IL-2 and Th2 production of IL-4 and IL-5 [10, 11]. IL-10 inhibits monocyte MHC class II, B7.1/B7.2 (CD80/CD86) expression, and accessory cell function [12]. It is the inhibition of accessory cell function that may be the primary means by which IL-10 inhibits cytokine production by Th1 and Th2 lymphocytes. Expression of IL-10 by immature antigen-presenting cells in the respiratory tract of healthy individuals represents an established pathway for induction and maintenance of tolerance to antigens [13, 14].
Genetic variation in promoter structure is one mechanism that leads to altered expression of genes [15, 16]. Changes in IL-10 production due to a polymorphism could result in a failure to maintain a milieu promoting tolerance or anergy. A C-to-A exchange in the IL-10 promoter located 571 base pairs upstream from the transcription start site has been described [17]. If an extended haplotype is examined (composed of SNPs at -1061, -798, and -571), the A allele is only found as an ATA haplotype, while the C allele can exist in an ACC or GCC haplotype [18]. Some studies have suggested that these single nucleotide polymorphisms, and possibly the broader haplotypes, might be responsible for differences in promoter strength of the IL-10 gene. Specifically, it has been demonstrated that the C-to-A nucleotide exchange at position -571 results in increased promoter activity in B cells and that the transcription factors Sp1 and Sp3 can bind to a region immediately upstream of the polymorphism. The region including the Sp1/Sp3 site and adjoining polymorphism functions as a transcriptional repressor, and the C-to-A base exchange relieves the repression mediated by Sp1 [19]. We demonstrated that the A allele was associated with elevated total serum IgE in subjects heterozygotic or homozygotic for this base exchange [20]. In addition, this polymorphism has also been linked with increased severity of a number of diseases including asthma, rheumatoid arthritis, systemic lupus erythromatosus (SLE) and inflammatory bowel disease [21-24], and is associated with changes in tumorigenesis and transplantation tolerance [25] and rapid progression to AIDS in individuals infected with HIV [26]. Each of these represents immune diseases that predictably could be associated with a loss of either tolerance or repression of immune responses.
While our study demonstrated higher levels of IL-10 promoter activity for the A-containing allele in B cells, several other investigators have shown that cells with the C-containing allele had higher levels of IL-10 production. Many of these studies have relied on whole cell blood cultures or partially purified peripheral blood mononuclear cells stimulated with lipopolysaccharide to observe this effect [27, 28]. Others have used purified T cells and stimulated with concanavalin A or anti-CD3/CD28 with mixed results in terms of IL-10 production [17, 29]. In the present study, we analyzed IL-10 production from highly enriched populations of T cells, B cells and monocytes under various stimulation conditions in individuals either homozygous for the C or A allele at position -571 of the IL-10 promoter.
Methods
Subjects
Heparinized venous blood was obtained with informed consent from healthy human volunteers (18-55 years old) using a protocol approved by the Human Investigation Committee at the University of Virginia.
Genotyping of IL-10 promoter polymorphism
Real-time PCR was used to genotype the single nucleotide polymorphism (C-to-A) at nucleotide -571 of the IL-10 promoter. DNA was extracted from anti-coagulated blood using a Wizard Genomic DNA Purification kit (Promega, Madison, WI). Amplification of the IL-10 promoter was performed using the following primers: 5′-GCGAGAATCCTAATGAAATCGG-3′ and 5′-TATCCTCAAAGTTCCCAACG-3′. Detection of the C and A alleles was accomplished through the differential hybridization of fluorescently labeled probes to the amplified product. The probe for the C allele was 5′FAM-CCCCGCCTGTCCTGTAGGAAG-BHQ-1 and for the A allele 5′HEX-CCCCGCCTGTACTGTAGGAAG-BHQ-1 (Integrated DNA Technologies, Inc., Coralville, IA). PCR consisted of 40 cycles of 30 sec each at 95°, 55° and 72° in a Bio-Rad iCycler thermocycler (Bio-Rad, Hercules, CA) with real time detection occurring at 72°.
Cell culture
Peripheral blood mononuclear cells (PBMCs) were isolated through Ficoll-Hypaque (Sigma, St Louis, MO) density centrifugation. CD14+ monocytes were enriched from PBMCs using positive selection magnetic affinity column purification (CD14+; Miltenyi Biotec, Auburn, CA). CD4+ T cells were enriched from PBMCs using positive magnetic affinity column purification (CD4+; Miltenyi Biotec) and CD4+CD25+ T cells were purified using the Regulatory T cell Isolation Kit (Miltenyi Biotec). CD19+ B cells were enriched from PBMCs using positive magnetic affinity column purification (CD19+; Miltenyi Biotec). The purity of each cell population as measured by flow cytometry was CD4+ T cells (>99%), CD4+CD25+ T cells (>90%), monocytes (>91%) and B cells (>86%) [30].
Cells were washed and resuspended (1.5 × 10⁶ cells/ml) in complete RPMI-1640 medium containing 0.01 mol/L HEPES (Invitrogen, Carlsbad, CA), 10,000 U/ml penicillin and 10 μg/ml streptomycin supplemented with 10% autologous serum and maintained at 37°C in 5% CO2. Cells were stimulated with lipopolysaccharide (LPS) (1 μg/ml) (Sigma), concanavalin A (Con A) (10 μg/ml) (Sigma), anti-IgM (10 μg/ml) (Kirkegaard & Perry Laboratories, Gaithersburg, Maryland), anti-CD3 (1.0 μg/ml) (Sigma), anti-CD28 (1.0 μg/ml) (Sigma), or phorpol 12-myristate 13-acetate (PMA) (0.1 μg/ml) (Sigma) and ionomycin (0.1 μg/ml) (Sigma). These concentrations were chosen from preliminary studies involving dose-response curves that demonstrated optimal activity or from other published studies. For studies involving changes in mRNA expression, cells were stimulated for 16 hrs before RNA was harvested with the exception of PMA/iomomycin stimulation, which was harvested at 2 hrs. For studies involving protein expression, cells were stimulated for 24 hrs and supernatants collected.
Cytokine determination
IL-10 (Biosource, Camarillo, CA) levels were measured in supernatants from cultured cells using a commercial enzyme-linked immunosorbent assay (ELISA) kit, according to the manufacturer’s instructions. The sensitivity for the assay was <0.78 pg/mL for IL-10.
Reverse transcription of mRNA
Total RNA was extracted from cells using a SV Total RNA Isolation® kit (Promega, Madison, WI). Conversion of the mRNA to cDNA was performed using a Taqman Reverse Transcription kit (Roche, Branchburg, NJ) as previously described [31]. Briefly, 200ng of RNA were added to each reaction along with oligo dT primers, 5.5 mM MgCl2, 2 mM dNTPs, RNasin and reverse transcriptase. Reactions went through one cycle of 10 min at 25° C, 30 min at 48° C and 5 min at 95° C in a Bio-Rad iCycler thermocycler (Bio-Rad, Hercules, CA). The cDNA was amplified by PCR using appropriate primer pairs for IL-10, transforming growth factor (TGF)-β1 and the housekeeping gene β-actin. Primers for TGF-β1 and β-actin have been previously described [31]. Primers and probe used for detection of IL-10 are as follows: IL-10 forward 5′-GAGAACCAAGACCCAGACATCAAG-3′, IL-10 reverse 5′-CATTCTTCACCTGCTCCACGG-3′ and IL-10 probe 5′-FAM-CTCAGGCTGAGGCTACGGCGC-BHQ1-3′. Quantification of changes in receptor expression induced by cytokines was performed using the comparative CT method. Briefly, the amount of target, normalized to an endogenous reference and relative to a calibrator was calculated by 2-ΔΔCT with ΔΔ CT = (threshold cycle unstimulated gene of interest-threshold cycle unstimulated housekeeping gene)-(threshold cycle stimulated gene of interest-threshold cycle stimulated housekeeping gene). The comparative CT method was validated by showing that the efficiencies of target and reference amplification were equal across a range of mRNA concentrations. Primer pairs and probes for each reaction were synthesized by Integrated DNA Technologies.
Statistical analysis
Data are expressed as means ±SEM. Statistical significance was determined using the Wilcoxon test with a value of p<0.05 being considered statistically significant.
Results
Influence of IL-10 -571 promoter polymorphism on IL-10 production in purified leukocyte populations
We were interested in the effect of the -571 C-to-A polymorphism on IL-10 production from purified cell populations obtained from peripheral blood. Subjects were recruited and screened for the IL-10 polymorphism and individuals homozygous for each allele were subsequently used in the studies (CC; n=11: AA;n=6). Monocytes were separated from peripheral blood using magnetic bead affinity chromatography and cultured for 24 hrs in the presence or absence of LPS. Figure 1 shows the IL-10 levels in supernatants from individuals homozygous for each allele. Unstimulated monocytes from CC-containing individuals had a trend towards slightly higher levels of spontaneous IL-10 production as compared to AA-containing individuals (43±11 vs 21±8 pg/ml, respectively). Significantly higher levels of IL-10 were produced (p<0.03) in response to LPS from monocytes obtained from individuals homozygous for the C allele (443±53 pg/ml) as compared to those homozygous for the A allele (267±44 pg/ml).
Figure 1.
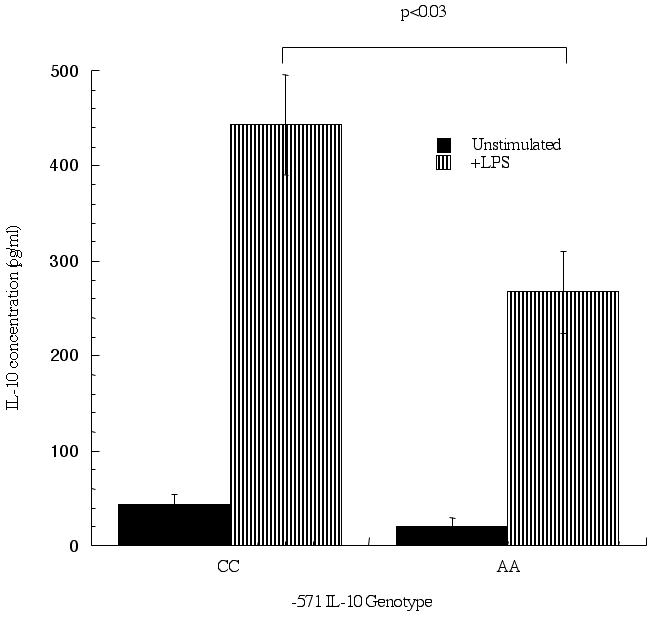
Differential IL-10 production from monocytes containing the -571 C-to-A promoter polymorphism. Monocytes were enriched from peripheral blood using magnetic bead affinity purification and cultured for 24 hrs in the presence or absence of LPS (10 μg/ml). Supernatants were collected and IL-10 levels measured, separated according to IL-10 genotype: homozygous CC (n=11) and AA (n=6). P<0.05 is considered statistically significant.
In a second set of experiments, IL-10 production from T cells was measured under various stimulation conditions. As observed with the monocytes, unstimulated T cells (Figure 2) had a trend towards higher spotaneous levels of IL-10 in individuals with the CC genotype at position -571 as compared to the AA genotype (6±3 vs 1±1, respectively). No differences in IL-10 levels were seen when anti-CD3/anti-CD28 or PMA/ionomycin were used as stimuli. In contrast, higher levels of IL-10 were observed from AA-containing individuals (158±61 pg/ml) as compared to CC-containing individuals (118±31 pg/ml) when Con A was used as a stimulus, though this number did not reach statistical significance. It has been suggested that Con A stimulation increases IL-10 production in T cells with a regulatory phenotype. In order to test this directly, we purified CD4+CD25+ T cells from peripheral blood of individuals with either the CC- or AA-genotype at position -571 of the IL-10 promoter and stimulated the cells for 24 hrs with Con A. In contrast to stimulation of total CD4+ T cells, very low levels of IL-10 were produced from the CD25= population of CD4= cells. Individuals homozygous for the A allele (n=3) at position -571 produced 2.73 pg/ml of IL-10 following Con A stimulation, while individuals homozygous for the C allele (n=6) produced 1.72 pg/ml. The level of IL-10 was below the limits of detection for unstimulated cells. The CC-containing group was separated to look at the extended IL-10 haplotype and IL-10 production. No differences were observed between individuals homozygous for the GCC haplotype (1.89 pg/ml; n=3) or the ACC haplotype (1.58 pg/ml; n=3).
Figure 2.
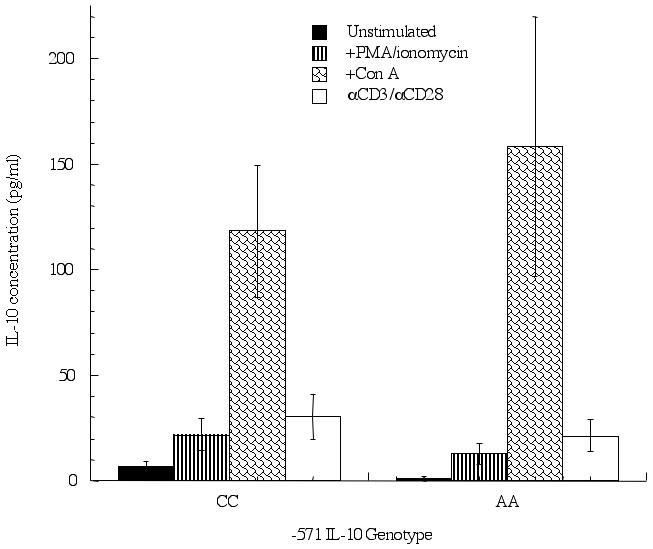
IL-10 production from T cells containing the -571 C-to-A promoter polymorphism differs depending on stimuli in a genotype-specific manner. T cells were enriched from peripheral blood using magnetic bead affinity purification and cultured for 24 hrs in the presence or absence of PMA/ionomycin (0.1 μg/ml), Con A (10 μg/ml) or anti-CD3/anti-CD28 (1 μg/ml). Supernatants were collected and IL-10 levels measured, separated according to IL-10 genotype: homozygous CC (n=11) and AA (n=6). P<0.05 is considered statistically significant.
B cells were also purified and IL-10 production measured. Again, unstimulated B cells from individuals homozygous for the C allele (20±6 pg/ml) had higher levels of IL-10 production compared to B cells taken from individuals homozygous for the A allele (2±2 pg/ml) and this did reach statistical significance (p<0.02). As with monocytes, stimulation of B cells with LPS resulted in significantly (p<0.03) higher levels of IL-10 being produced in CC-containing individuals (Figure 3) (CC; 82±24 pg/ml: AA; 26±8 pg/ml). The situation was reversed when anti-IgM was used to stimulate the B cells, as AA-containing individuals (AA; 34±11 pg/ml: CC; 17±9 pg/ml) produced more IL-10, though this difference was not significant. When the C/C group was separated to look at the extended IL-10 haplotype, consisting of the -1061 (A-to-G) and -798 (T-to-C) polymorphisms, no significant differences were observed in IL-10 production for the various stimuli (GCC/GCC 7.9±4.4 pg/ml; n=5, ACC/ACC 10.1±10.1 pg/ml; n=2 GCC/ACC 11.56±0 pg/ml; n=1).
Figure 3.
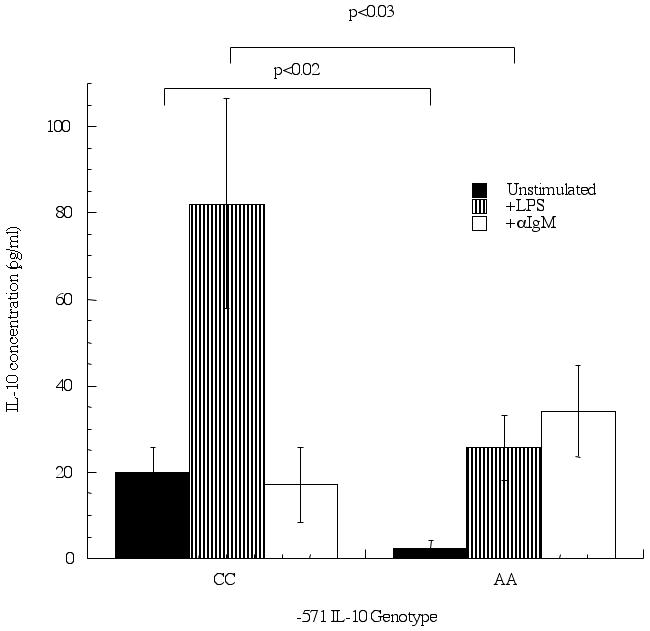
B cells display differential IL-10 production on promoters containing the -571 C-to-A polymorphism in response to diverse stimuli. B cells were enriched from peripheral blood using magnetic bead affinity purification and cultured for 24 hrs in the presence or absence of LPS (10 μg/ml) or anti-IgM (10 μg/ml). Supernatants were collected and IL-10 levels measured, separated according to IL-10 genotype: homozygous CC (n=11) and AA (n=6). P<0.05 is considered statistically significant.
Differences in IL-10 protein production correlate with changes in IL-10 mRNA
Having demonstrated that changes in IL-10 production due to various stimuli correlated with the -571 IL-10 genotype, we wanted to determine if this was solely due to changes in protein production or were the observed differences secondary to changes in IL-10 promoter activity as would be predicted. To address this, cells were cultured under the above conditions, from individuals with the AA or CC genotype at position -571, harvested and mRNA collected. Quantitative PCR was performed looking at IL-10 transcript levels with comparison being made to unstimulated cells. Data from all cell types and stimuli are presented in Table 1. The mRNA data mirrors the results obtained from culture supernatants. In order to confirm that the observed changes were specific for IL-10 and not simply a global stimulus of cytokine production, TGF-β1 mRNA transcripts were measured (Table 2). In contrast to the IL-10 transcripts, the TGF-β1 transcript level did not match the results of the IL-10 supernatants demonstrating specificity for IL-10 stimulation.
Table 1.
IL-10 mRNA expression from cell cultures of purified peripheral blood from individuals homozygous for the C allele or homozygous for the A allele at position -571 of the IL-10 promoter
| Genotype | Cell-type | LPS | PMA/ionomycin | ConA | αCD3/αCD28 | αIgM |
|---|---|---|---|---|---|---|
| CC (n=11)1 | T cell | ND | 4.7±2.3 | 60.4±45.2 | 16.9±6.1 | ND |
| B cell | 27.4±15.2 | ND | ND | ND | 0.6±0.3 | |
| mono | 108.7±70.0 | ND | ND | ND | ND | |
| AA (n=6) | T cell | ND | 3.3±1.4 | 116.2±79.6 | 16.6±5.1 | ND |
| B cell | 8.1±2.9 | ND | ND | ND | 12.0±5.0* | |
| mono | 51.9±28.0 | ND | ND | ND | ND |
Data presented as a fold change in comparison to unstimulated which was set at 1.
p<0.005 AA in comparison to CC genotype
ND= not determined
Table 2.
TGF-β1 mRNA expression from cell cultures of purified peripheral blood from individuals homozygous for the C allele or homozygous for the A allele at position -571 of the IL-10 promoter
| Genotype | Cell-type | LPS | PMA/ionomycin | ConA | αCD3/αCD28 | αIgM |
|---|---|---|---|---|---|---|
| CC (n=11)1 | T cell | ND | 5.8±2.9 | 2.1±1.0 | 0.7±0.1 | ND |
| B cell | 0.8±0.2 | ND | ND | ND | 0.3±0.1 | |
| mono | 0.6±0.3 | ND | ND | ND | ND | |
| AA (n=6) | T cell | ND | 2.1±0.5 | 0.3±0.1 | 0.7±0.2 | ND |
| B cell | 2.8±1.3* | ND | ND | ND | 4.2±3.4 | |
| mono | 1.0±0.6 | ND | ND | ND | ND |
Data presented as a fold change in comparison to unstimulated which was set at 1.
p<0.05 AA in comparison to CC genotype
ND= not determined
Discussion
Many groups have investigated the effect of the -571 IL-10 C-to-A promoter exchange on IL-10 production and have reported varying results. The most common finding is that stimulation of PBMCs with LPS results in higher IL-10 production from individuals with a C allele at position -571 [27, 32]. In contrast, Huizinga et al found that in whole blood cultures, individuals with a A allele produced higher levels of IL-10 when LPS was used to stimulate the cells [33]. Part of these differences may be explained by results showing that the dose of LPS can influence the amount of IL-10 that is produced. It was demonstrated that at low LPS concentrations, cells from individuals with the C allele produced more IL-10 than cells from individuals with the A allele. However, at high doses of LPS there were no differences in IL-10 production among the different genotypes [34]. Using purified monocytes (Figure 1) and B cells (Figure 3), our results support the concept that individuals with the C allele both spontaneously and upon LPS stimulation produce higher levels of IL-10 as compared to individuals with the A allele in these cell types. Others have reported a similar phenomena using PBMCs and Con A, anti-CD3/CD28 or interferon-α as a stimulus [17, 29, 35, 36]. Though not statistically significant, a slight increase in IL-10 production was observed in purified T cells from individuals with the C allele when stimulated with either PMA/ionomycin or anti-CD3/CD28 (Figure 2). Unlike previous reports, T cells stimulated with Con A (Figure 2) had higher levels of IL-10 production when obtained from individuals with the A allele and B cells stimulated with anti-IgM displayed the same trend (Figure 3). Our results are consistent with a recent report that showed peripheral blood mononuclear cells stimulated with phytohemagglutinin, from individuals homozygous for the A allele at position -571, produced higher levels of IL-10 than individuals homozygous for the C allele, though in their study there was additional contribution to IL-10 production from other SNPs on the IL-10 promoter [37]. Some of these differences in comparison to the other reports may reflect individual variability in representation of distinct mononuclear cell populations amongst PBMCs.
The -571 base exchange occurs between what we confirmed as being an Sp family member binding site and a sequence with similarity to that recognized by members of the ets family (AGGAA) [19]. The transcription factor(s) that specifically binds to this region of the IL-10 promoter has not yet been identified, however, the binding affinity of this factor was influenced by the C-to-A base exchange (unpublished data). Sp1 is a ubiquitous factor that is important in both transcriptional activation and repression. The interaction of Sp1/Sp3 with this region of the IL-10 promoter was associated with decreased promoter function [19]. A variety of transcription factors would be activated following stimulation of cells and action through different signaling cascades. The interaction of Sp1/Sp3 with other transcription factors may lead to the opposite functions of activation and repression observed for this polymorphism depending on the cell line and stimulation used. In part, this will depend on the expression levels and function of these factors in the differing cell types. These may include the proteins that bind adjacent to the -571 site and different factors that bind to other regions of the IL-10 promoter and interact with the proteins that bind to this site. Part of the extended haplotype for the IL-10 single nucleotide polymorphisms includes a G-to-A base exchange at position -1061 from the transcription start site. The transcription factor PU.1 binds to the A allele at position -1061 with higher affinity than to the G allele and results in lower transcriptional activity [28]. Given that the A allele at position -571 always segregates with the A allele at position -1061, it is possible that an interaction can occur between the transcription factors that bind to these sites. Studies of Con A treated T cells suggested that stimulation leads to production of T cells with a regulatory phenotype [38]. We tested whether or not there were differences in IL-10 production from thymic derived natural T regulatory cells that correlated with IL-10 genotype. The natural T regulatory cells in our studies produced low levels of IL-10 when stimulated with Con A and no differences were observed when subjects were separated by IL-10 genotype. Given that differences were not observed in a natural T regulatory cell population, it is tempting to speculate that genetic differences exist in the ability of induced T regulatory cells to function, as these cells in contrast to natural T regulatory cells use IL-10 to mediate their suppressive effects. Induced T regulatory cells are not prevalent in the PBMC population and would not have confounded our CD25+ T cell results.
Our data supports the concept that the IL-10 -571 polymorphism can lead to either increased or decreased IL-10 production. The differences being due to the cell type producing the IL-10 and the stimulus used to induce production. These differences could have profound effects on disease as high IL-10 production early could inhibit the immune response helping to prevent disease or be deleterious later in the disease progression as it could amplify established pathways.
Acknowledgements
This work was supported by American Lung Association Grant AL440-ALA (to JWS) and AI01793 (to LB)
Abbreviations used in this paper
- Con A
concanavalin A
- ELISA
enzyme-linked immunosorbent assay
- DC
dendritic cell
- LPS
lipopolysaccharide
- PBMCs
peripheral blood mononuclear cells
- PMA
phorbol 12-myristate 13-acetate
- SLE
systemic lupus erythromatosus
- TGF
transforming growth factor
Footnotes
Publisher's Disclaimer: This is a PDF file of an unedited manuscript that has been accepted for publication. As a service to our customers we are providing this early version of the manuscript. The manuscript will undergo copyediting, typesetting, and review of the resulting proof before it is published in its final citable form. Please note that during the production process errors may be discovered which could affect the content, and all legal disclaimers that apply to the journal pertain.
References
- [1].Borish LC, Steinke JW. Cytokines and chemokines. J. Allergy Clin. Immunol. 2003;111:S460–475. doi: 10.1067/mai.2003.108. [DOI] [PubMed] [Google Scholar]
- [2].de Waal Malefyt RD, Abrams JS, Bennett B, Figdor CG, de Vries JE. Interleukin 10 (IL-10) inhibits cytokine synthesis by human monocytes: an autoregulatory role of IL-10 produced by monocytes. J. Exp. Med. 1991;174:1209–1220. doi: 10.1084/jem.174.5.1209. [DOI] [PMC free article] [PubMed] [Google Scholar]
- [3].Wanidworanun C, Strober W. Predominant role of tumor necrosis factor-alpha in human monocyte IL-10 synthesis. J. Immunol. 1993;151:6853–6861. [PubMed] [Google Scholar]
- [4].Go NF, Castle BE, Barrett R, Kastelein R, Dang W, Mosmann TR, Moore KW, Howard M. Interleukin 10, a novel B cell stimulatory factor: unresponsiveness of X chromosome-linked immunodeficiency B cells. J. Exp. Med. 1990;172:1625–1631. doi: 10.1084/jem.172.6.1625. [DOI] [PMC free article] [PubMed] [Google Scholar]
- [5].Fillatreau S, Sweenie CH, McGeachy MJ, Gray D, Anderton SM. B cells regulate autoimmunity by provision of IL-10. Nature Immunol. 2002;3:944–950. doi: 10.1038/ni833. [DOI] [PubMed] [Google Scholar]
- [6].de Saint-Vis B, Fuigier-Vivier I, Massacrier C, Gaillard C, Vanbervliet B, Ait-Yahia S, Banchereau J, Liu YJ, Lebecque S, Caux C. The cytokine profile expressed by human dendritic cells is dependent on cell subtype and mode of activation. J. Immunol. 1998;160:1666–1676. [PubMed] [Google Scholar]
- [7].Thompson-Snipes L, Dahr V, Bond MW, Mosmann TR, Moore KW, Rennick DM. Interleukin 10: a novel stimulatory factor for mast cells and their progenitors. J. Exp. Med. 1991;173:507–510. doi: 10.1084/jem.173.2.507. [DOI] [PMC free article] [PubMed] [Google Scholar]
- [8].Akdis CA, Blesken T, Akdis M, Wuthrich B, Blaser K. The role of IL-10 in specific immunotherapy. J. Clin. Invest. 1998;102:98–106. doi: 10.1172/JCI2250. [DOI] [PMC free article] [PubMed] [Google Scholar]
- [9].Mason D, Powrie F. Control of immune pathology by regulatory T cells. Curr. Opin. Immunol. 1998;10:649–655. doi: 10.1016/s0952-7915(98)80084-8. [DOI] [PubMed] [Google Scholar]
- [10].Del Prete G, De Carli M, Almerigogna F, Giudizi MG, Biagiotti R, Romagnani S. Human IL-10 is produced by both type 1 helper (Th1) and type 2 helper (Th2) T cell clones and inhibits their antigen-specific proliferation and cytokine production. J. Immunol. 1993;150:353–360. [PubMed] [Google Scholar]
- [11].de Waal Malefyt RD, Yssel H, de Vries JE. Direct effects of IL-10 on subsets of human CD4+ T cell clones and resting T cells. Specific inhibition of IL-2 production and proliferation. J. Immunol. 1993;150:4754–4765. [PubMed] [Google Scholar]
- [12].de Waal Malefyt RD, Haanen J, Spits H, Roncarolo MG, te Velde A, Figdor CG, Johnson K, Kastelein R, Yssel H, de Vries JE. Interleukin 10 (IL-10) and viral IL-10 strongly reduce antigen-specific human T cell proliferation by diminishing the antigen-presenting capacity of monocytes via downregulation of class II major histocompatibility complex expression. J. Exp. Med. 1991;174:915–924. doi: 10.1084/jem.174.4.915. [DOI] [PMC free article] [PubMed] [Google Scholar]
- [13].Enk AH, Angeloni VL, Udey MC, Katz SI. Inhibition of Langerhans cell antigen-presenting function by IL-10. A role for IL-10 in induction of tolerance. J. Immunol. 1993;151:2390–2398. [PubMed] [Google Scholar]
- [14].Becker JC, Czerny C, Brocker EB. Maintenance of clonal anergy by endogenously produced IL-10. Int. Immunol. 1994;6:1605–1612. doi: 10.1093/intimm/6.10.1605. [DOI] [PubMed] [Google Scholar]
- [15].Rosenwasser LJ, Klemm DJ, Dresback JK, Inamura H, Mascali JJ, Klinnert M, Borish L. Promoter polymorphisms in the chromosome 5 gene cluster in asthma and atopy. Clin. Exp. Allergy. 1995;25(Suppl 2):74–78. doi: 10.1111/j.1365-2222.1995.tb00428.x. [DOI] [PubMed] [Google Scholar]
- [16].Drazen JM, Yandava CN, Dube L, Szczerback N, Hippensteel R, Pillari A, Israel E, Schork N, Silverman ES, Katz DA, Drajesk J. Pharmacogenetic association between ALOX5 promoter genotype and the response to anti-asthma treatment. Nature Genetics. 1999;22:168–170. doi: 10.1038/9680. [DOI] [PubMed] [Google Scholar]
- [17].Turner DM, Williams DM, Sankaran D, Lazarus M, Sinnott PJ, Hutchinson IV. An investigation of polymorphism in the interleukin-10 gene promoter. Eur. J. Immunogenet. 1997;24:1–8. doi: 10.1111/j.1365-2370.1997.tb00001.x. [DOI] [PubMed] [Google Scholar]
- [18].Gibson AW, Edberg JC, Wu J, Westendorp RGJ, Huizinga TWJ, Kimberly RP. Novel single nucleotide polymorphisms in the distal IL-10 promoter affect IL-10 production and enhance the risk of systemic lupus erythematosus. J. Immunol. 2001;166:3915–3922. doi: 10.4049/jimmunol.166.6.3915. [DOI] [PubMed] [Google Scholar]
- [19].Steinke JW, Barekzi E, Hagman J, Borish L. Functional analysis of -571 IL-10 promoter polymorphism reveals a repressor element controlled by Sp1. J. Immunol. 2004;173:3215–3222. doi: 10.4049/jimmunol.173.5.3215. [DOI] [PubMed] [Google Scholar]
- [20].Hobbs K, Negri J, Klinnert M, Rosenwasser LJ, Borish L. Interleukin-10 and transforming growth factor-beta promoter polymorphisms in allergies and asthma. Am. J. Respir. Crit. Care Med. 1998;158:1958–1962. doi: 10.1164/ajrccm.158.6.9804011. [DOI] [PubMed] [Google Scholar]
- [21].Lim S, Crawley E, Woo P, Barnes PJ. Haplotype associated with low interleukin-10 production in patients with severe asthma. Lancet. 1998;352:113. doi: 10.1016/S0140-6736(98)85018-6. [DOI] [PubMed] [Google Scholar]
- [22].Lyon H, Lange C, Lake S, Silverman EK, Randolph AG, Kwiatkowski D, Raby BA, Lazarus R, Weiland KM, Laird N, Weiss ST. IL10 gene polymorphisms are associated with asthma phenotypes in children. Genet. Epidemiol. 2004;26:155–165. doi: 10.1002/gepi.10298. [DOI] [PMC free article] [PubMed] [Google Scholar]
- [23].Hajeer AH, Lazrus M, Turner D, Mageed RA, Vencovsky J, Sinnott P, Hutchinson IV, Ollier WER. IL-10 gene promoter polymorphisms in rheumatoid arthritis. Scand. J. Rheumatol. 1998;27:142–145. doi: 10.1080/030097498441029. [DOI] [PubMed] [Google Scholar]
- [24].Lazarus M, Hajeer AH, Turner D, Sinnott P, Worthington J, Ollier WER, Hutchinson IV. Genetic variation in the interleukin 10 gene promoter and systemic lupus erythematosus. J. Rheum. 1997;24:2314–2317. [PubMed] [Google Scholar]
- [25].Middleton PG, Taylor PR, Jackson G, Proctor SJ, Dickinson AM. Cytokine gene polymorphisms associating with severe acute graft-versus-host disease in HLA-identical sibling transplants. Blood. 1998;92:3943–3948. [PubMed] [Google Scholar]
- [26].Shin HD, Winkler C, Stephens JC, Bream J, Young H, Goedert JJ, O’Brien TR, Vlahov D, Buchbinder S, Giorgi J, Rinaldo C, Donfield S, Willoughby A, O’Brien SJ, Smith MW. Genetic restriction of HIV-1 pathogenesis to AIDS by promoter alleles of IL10. Proc. Natl. Acad. Sci. USA. 2000;97:14467–14472. doi: 10.1073/pnas.97.26.14467. [DOI] [PMC free article] [PubMed] [Google Scholar]
- [27].Crawley E, Kay R, Sillibourne J, Patel P, Hutchinson I, Woo P. Polymorphic haplotypes of the interleukin-10 5′ flanking region determine variable interleukin-10 transcription and are associated with particular phenotypes of juvenile rheumatoid arthritis. Arthritis Rheum. 1999;42:1101–1108. doi: 10.1002/1529-0131(199906)42:6<1101::AID-ANR6>3.0.CO;2-Y. [DOI] [PubMed] [Google Scholar]
- [28].Reuss E, Fimmers R, Kruger A, Becker C, Rittner C, Hohler T. Differential regulation of interleukin-10 production by genetic and environmental factors-a twin study. Genes Immun. 2002;3:407–413. doi: 10.1038/sj.gene.6363920. [DOI] [PubMed] [Google Scholar]
- [29].Hoffmann SC, Stanley EM, Cox ED, Craighead N, DiMercurio BS, Koziol DE, Harlan DM, Kirk AD, Blair PJ. Association of cytokine polymorphic inhertiance and in vitro cytokine production in anti-CD3/CD28-stimulated peripheral blood lymphocytes. Transplantation. 2001;72:1444–1450. doi: 10.1097/00007890-200110270-00019. [DOI] [PubMed] [Google Scholar]
- [30].Early SB, Barekzi E, Negri J, Hise K, Borish L, Steinke JW. Concordant modulation of cysteinyl leukotriene receptor expression by IL-4 and IFN-γ on peripheral immune cells. Am. J. Respir. Cell Mol. Biol. 2007;36:715–720. doi: 10.1165/rcmb.2006-0252OC. [DOI] [PMC free article] [PubMed] [Google Scholar]
- [31].Steinke JW, Crouse CD, Bradley D, Hise K, Lynch K, Koutakis SE, Borish L. Characterization of interleukin-4 stimulated nasal polyp fibroblasts. Am. J. Respir. Cell. Mol. Biol. 2004;30:212–219. doi: 10.1165/rcmb.2003-0071OC. 2004. [DOI] [PubMed] [Google Scholar]
- [32].Suarez A, Castro P, Alonso R, Mozo L, Gutierrez C. Interindividual variations in constitutive interleukin-10 messenger RNA and protein levels and their association with genetic polymorphisms. Transplantation. 2003;75:711–717. doi: 10.1097/01.TP.0000055216.19866.9A. [DOI] [PubMed] [Google Scholar]
- [33].Huizinga TWJ, Keijsers V, Yanni G, Hall M, Ramage W, Lanchbury J, Pitzalis C, Drossaers-Bakker WK, Westendorp RGJ, Breedveld FC, Panayi G, Verweij CL. Are differences in interleukin 10 production associated with joint damage? Rheumatology. 2000;39:1180–1188. doi: 10.1093/rheumatology/39.11.1180. [DOI] [PubMed] [Google Scholar]
- [34].Schippers EF, van ’t Veer C, van Voorden S, Martina CA, Huizinga TWJ, le Cessie S, van Dissel JT. IL-10 and toll-like receptor-4 polymorphisms and the in vivo and ex vivo response to endotoxin. Cytokine. 2005;29:215–228. doi: 10.1016/j.cyto.2004.12.005. [DOI] [PubMed] [Google Scholar]
- [35[.Edwards-Smith CJ, Jonsson JR, Purdie DM, Bansal A, Shorthouse C, Powell EE. Interleukin-10 promoter polymorphism predicts initial response of chronic hepatitis C to interferon alfa. Hepatology. 1999;30:526–530. doi: 10.1002/hep.510300207. [DOI] [PubMed] [Google Scholar]
- [36].Luik A, Knapp S, Thursz M, Thomas HC, Schlaak JF. Autoregulatory role of interleukin-10 in hepatitis C patients treated with IFN-alpha. J. Interferon Cytokine Res. 2004;24:585–593. doi: 10.1089/jir.2004.24.585. [DOI] [PubMed] [Google Scholar]
- [37].van den Biggelaar AH, Hua TD, Rodrigues LC, Kremsner PG, Yazdanbakhsh M, Kube D. Genetic variation in IL-10 is associated with atopic reactivity in Gabonese schoolchildren. J. Allergy Clin. Immunol. 2007;120:973–975. doi: 10.1016/j.jaci.2007.06.044. [DOI] [PubMed] [Google Scholar]
- [38].Erhardt A, Biburger M, Papadopoulos T, Tiegs G. IL-10, regulatory T cells, and Kupffer cells mediate tolerance in concanavalin A-induced liver injury in mice. Hepatology. 2007;45:475–485. doi: 10.1002/hep.21498. [DOI] [PubMed] [Google Scholar]