Abstract
OBJECTIVE
Ischemic preconditioning (PR) protects hearts from ischemia-reperfusion injury. The purpose of the present study was to examine the protective effect of PR and postconditioning (PT) against hypoxia-reoxygenation injury and H2O2-induced damage in isolated rat hearts.
METHODS AND RESULTS
Hearts from male Sprague-Dawley rats were perfused with Krebs-Henseleit solution by Langendorff methods and subjected to two protocols. In protocol A, control hearts underwent 45 min of hypoxia and 30 min of reoxygenation. Three PT cycles of 10 s of ischemia and 10 s of reperfusion after 45 min of hypoxia increased the recovery of the pressure-rate product. Three PR cycles of 3 min of ischemia and 5 min of reperfusion before hypoxia were also protective, and decreased the release of glutamic oxaloacetic transaminase. A combination of PR and PT resulted in greater protection than either alone. In protocol B, control hearts underwent perfusion with H2O2 (120 μM) until the left ventricular end-diastolic pressure was elevated to 50 mmHg, and then H2O2 was washed out for 30 min. Three PT cycles of 30 s of ischemia and 30 s of reperfusion before the 30 min washout increased the level of recovery of the pressure-rate product and decreased left ventricular end-diastolic pressure to baseline levels.
CONCLUSIONS
The results of the present study indicate that PT protects hearts from hypoxia-reoxygenation injury and H2O2-induced damage. In addition, PR combined with PT offers more effective protection than PR or PT alone.
Keywords: Hydrogen peroxide, Langendorff perfusion, Postconditioning, Preconditioning
Ischemic preconditioning (PR) is an endogenous cardioprotective phenomenon that was initially demonstrated by Murry et al (1). Brief, nonfatal episodes of ischemia and reperfusion protect the myocardium from the injury caused by subsequent prolonged ischemia and reperfusion. PR significantly enhances the recovery of cardiac function, reducing infarct size and the appearance of apoptosis in hearts subjected to ischemia and reperfusion (2,3). Recently, ischemic postconditioning (PT), another procedure in which the heart is subjected to brief episodes of ischemia and reperfusion during the early phase of reperfusion after prolonged ischemia, was also shown to be protective. In several different animal models, PT reduced infarct size, maintained coronary artery endothelial function and converted persistent ventricular fibrillation into a regular rhythm (4–6). However, the relationship between PR and PT remains to be elucidated, and the cardioprotection of PT may be different than that of PR. If this hypothesis is true, a combination of PR and PT would exert a greater effect than either alone.
The generation of reactive oxygen species (ROS) is known to be a major cause of ischemia-reperfusion injury (7–9). There is a burst of ROS generation after the onset of reperfusion, and this is followed by a persistently elevated generation (10,11). It has been suggested that the brief period of PT applied at the onset of reperfusion is critical to cardioprotection and may be involved in attenuating the generation of ROS (4,5). Therefore, after perfusing with H2O2 (a type of ROS), PT is not effective throughout the washout period because there is no generation of ROS during the washout. However, there is also a study that found that ROS can induce ROS release (12), and if this is the case, PT may be effective after washout of H2O2. Accordingly, we designed the present study to examine the protective effects of PT compared with PR against hypoxia-reoxygenation injury and H2O2-induced damage in Langendorff-perfused rat hearts. In addition, we examined whether PR combined with PT would be more effective in protection than either PR or PT alone.
METHODS
The present study was conducted in accordance with the Guide for the Care and Use of Laboratory Animals (13). The protocol was approved by the Animal Experimentation Committee at the Juntendo University School of Medicine (Tokyo, Japan).
Langendorff perfusion
Preparation of hearts and perfusion protocols
Male Sprague-Dawley rats, weighing 290 g to 380 g, were used. Rats were sacrificed and their hearts were excised quickly to establish Langendorff perfusion. Each heart was perfused with modified Krebs-Henseleit (KH) solution (containing NaCl 116.0 mM, NaHCO3 25.0 mM, MgSO4 1.2 mM, KCl 4.7 mM, KH2PO4 1.2 mM, CaCl2 2.5 mM and glucose 5.5 mM; pH 7.4) in a retrograde direction at a constant flow rate of 13 mL/min without recirculation. The KH solution was warmed to 37°C and oxygenated with a 95% O2 and 5% CO2 gas mixture to elevate the partial pressure of oxygen to over 400 mmHg. During the period of hypoxia, the glucose in the perfusate was replaced with sucrose, and the solution was saturated with a 95% N2 and 5% CO2 gas mixture (partial pressure of oxygen of 20 mmHg or less) (hypoxic solution). A latex balloon was inserted through the mitral annulus into the left ventricular cavity, and distilled water (0.1 mL to 0.2 mL) was injected into the balloon until it was inflated to just above the level required to produce visible elevation of the left ventricular end-diastolic pressure (LVEDP). The left ventricular developed pressure (LVDP), LVEDP, heart rate (HR) and coronary perfusion pressure (CPP) were monitored throughout the experiment. The extent of irreversible myocardial damage was assessed by determining the amount of glutamic oxaloacetic transaminase (GOT) released into the coronary effluent. The GOT activities in 10 μL aliquots were estimated using a dry chemical method with a commercially available kit (Fujifilm Co Ltd, Japan). The released GOT activity was normalized to the units per gram of dry tissue per minute.
Experimental protocols
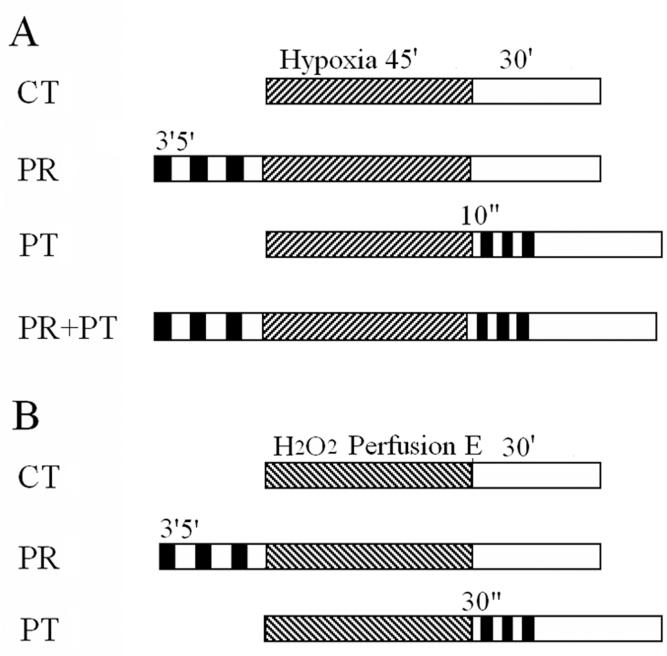
After stabilization for 20 min, hearts were challenged with one of the following treatments. In protocol A (hypoxia-reoxygenation perfusion) (Figure 1A): control (CT) group (n=8) hearts were subjected to hypoxia for 45 min and reoxygenation for 30 min without any other intervention; the PR group (n=8) hearts were subjected to three cycles of 3 min of ischemia and 5 min of reperfusion, which were followed by hypoxia-reoxygenation as in protocol A for the CT group; the PT group (n=8) hearts were subjected to 45 min of hypoxia, followed by three cycles of 10 s of ischemia and 10 s of reperfusion before 30 min of reoxygenation; and the PR plus PT (PR+PT) group (n=9) hearts were subjected to three cycles of 3 min of ischemia and 5 min of reperfusion, followed by 45 min of hypoxia and then three cycles of 10 s of ischemia and 10 s of reperfusion before 30 min of reoxygenation. In protocol B (H2O2 washout perfusion) (Figure 1B): CT group (n=8) hearts were perfused with KH solution containing 120 μM H2O2 until the LVEDP was elevated to 50 mmHg, and were then washed with normal KH solution for 30 min; the PR group (n=8) hearts were subjected to three cycles of 3 min of ischemia and 5 min of reperfusion, followed by H2O2 perfusion and then were washed out as in protocol B for the CT group; the PT group (n=7) hearts were subjected to perfusion with H2O2 (120 μM), followed by three cycles of 30 s of ischemia and 30 s of reperfusion before 30 min of washout; and the PR+PT group (n=4) hearts were subjected to a combination of PR and PT procedures used in protocol B. Different durations for ischemia-reperfusion for the PT groups of protocol A and B were chosen because selected durations exhibited the best protection for each group.
Figure 1.
Experimental protocols. A The control (CT) group (n=8) was challenged with 45 min (m) of hypoxia (striped bar) and 30 min of reoxygenation (open bar); the ischemic preconditioning (PR) group (n=8) received three cycles of 3 min of ischemia (closed bar) and 5 min of reperfusion (open bar) before hypoxia; the ischemic postconditioning (PT) group (n=8) received three cycles of 10 s of ischemia and 10 s of reperfusion before 30 min of reoxygenation; the PR plus PT (PR+PT) group (n=9) received three cycles of PR and three cycles of PT. B The CT group (n=8) was perfused with H2O2 (striped bar) until the left ventricular end-diastolic pressure was elevated to 50 mmHg (E) and then H2O2 was washed out for 30 min (open bar); the PR group (n=8) received three cycles of 3 min of ischemia and 5 min of reperfusion before perfusion with H2O2; the PT group (n=7) received three cycles of 30 s of ischemia and 30 s of reperfusion before a 30 min washout
The cardiac contractile activity was evaluated by the pressure-rate product (PRP; defined as LVDP multiplied by HR). The values of PRP during the hypoxia-reoxygenation period were expressed as a percentage of the normal value (the value at end of stabilization).
Statistics
Data are presented as means ± SEM. Differences between means were analyzed using the unpaired Student’s t test for paired samples, and by ANOVA and the Bonferroni method as deemed appropriate. P<0.05 was considered significant.
RESULTS
Changes in cardiac function and GOT release during hypoxia-reoxygenation perfusion
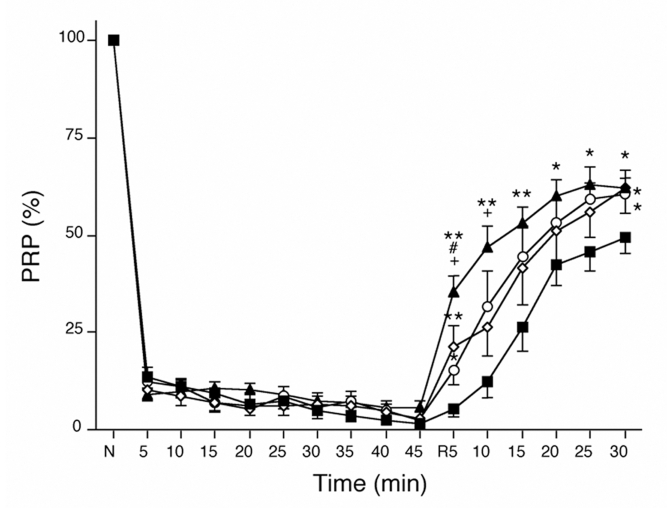
At the end of 20 min of stabilization, there were no differences among groups in CPP, HR, LVEDP and LVDP (Table 1). On hypoxic perfusion, the PRP decreased rapidly by approximately 90% in the first 5 min, and gradually and continually decreased further to 1.6±1.0% (CT group), 2.6±0.8% (PR group), 2.8±1.2% (PT group) and 5.8±1.5% (PR+PT group) after 45 min of hypoxia (Figure 2). After 5 min of reoxygenation, the PRP recovered to 5.5±2.3% in the CT group, 21.3±5.3% in the PR group, 15.2±3.8% in the PT group and 35.3±4.3% in the PR+PT group. The recoveries of PRP were quicker in the PR (P<0.01 versus the CT group) and PT groups (P<0.05 versus the CT group) than in the CT group, and the PR+PT group had the fastest recovery (P<0.01 versus the CT group). After reoxygenation for 30 min, the PRP levels were 49.5±4.0% in the CT group, 62.3±4.3% in the PR group (P<0.05 versus the CT group), 60.4±5.0% in the PT group (P<0.05 versus the CT group) and 62.1±2.7% in the PR+PT group (P<0.05 versus the CT group). The values for the PR, PT and PR+PT groups were similar.
TABLE 1.
Characteristics of isolated perfused hearts during hypoxia-reoxygenation experiments
| Factors
|
|||||
|---|---|---|---|---|---|
| Time | Group | CPP (mmHg) | Heart rate (beats/min) | LVEDP (mmHg) | LVDP (mmHg) |
| Baseline | CT | 59±3 | 284±8 | 0 | 120±6 |
| PR | 59±3 | 290±8 | 0 | 122±4 | |
| PT | 56±2 | 289±8 | 0 | 113±4 | |
| PR+PT | 64±2 | 281±6 | 0 | 126±5 | |
| 45 min of hypoxia | CT | 95±10 | 27±19 | 81±6 | 13±8 |
| PR | 88±7 | 49±25 | 80±8 | 19±9 | |
| PT | 85±6 | 25±11 | 65±6 | 29±11 | |
| PR+PT | 81±2 | 55±18 | 56±5 | 51±14 | |
| 30 min of reperfusion | CT | 86±7 | 247±8 | 31±4 | 70±5 |
| PR | 95±9 | 278±13 | 35±7 | 76±4 | |
| PT | 94±3 | 266±15 | 24±3 | 75±5 | |
| PR+PT | 104±5 | 278±16 | 17±2* | 81±6 | |
All values are expressed as means ± SEM.
P<0.05 versus the control (CT) group. CPP Coronary perfusion pressure; LVDP Left ventricular developed pressure; LVEDP Left ventricular end-diastolic pressure; PR Ischemic preconditioning; PT Ischemic postconditioning; PR+PT PR plus PT
Figure 2.
Time courses of the changes in the pressure-rate product (PRP) during hypoxia-reoxygenation. The recoveries of PRP were quicker in the hearts of the ischemic preconditioning (PR) group (open diamonds) and ischemic postconditioning (PT) group (open circles) than in the hearts of the control group (closed squares), and the PR plus PT group (closed triangles) had the quickest recovery. *P<0.05 and **P<0.01 versus the control group; #P<0.05 versus the PR group; +P<0.05 versus the PTgroup. N Normal; R Reoxygenation
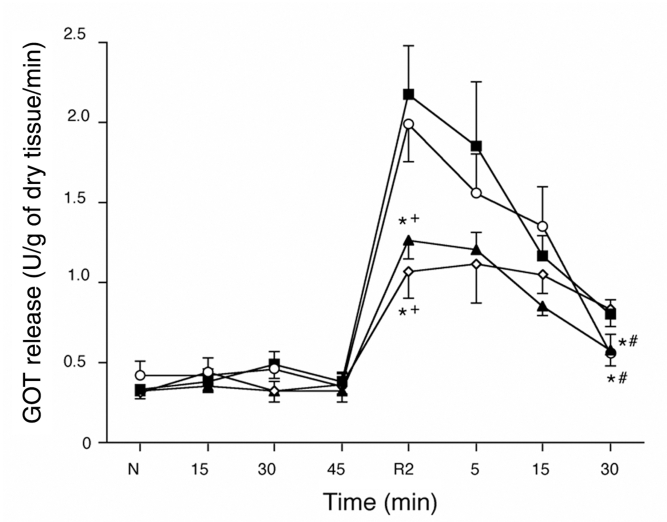
The release of GOT from the myocardium remained near baseline during the 45 min hypoxic period, but it increased rapidly during the first 2 min of reoxygenation and then decreased gradually, but remained above the baseline level in all groups (Figure 3). The amount of GOT released was lower in the PR and PR+PT groups than in the CT and PT groups during the first 2 min (P<0.05 versus the CT and PT groups). However, the release of GOT after 30 min of reoxygenation was lower in the PT and PR+PT groups than in the CT and PR groups (P<0.05 versus the CT and PR groups).
Figure 3.
Time courses of the amount of glutamic oxaloacetic transaminase (GOT) released during hypoxia-reoxygenation. After the first 2 min of reoxygenation (R), the amounts of GOT released were lower in the hearts of the ischemic preconditioning (PR) group (open diamonds) and the PR plus ischemic postconditioning (PT) group (closed triangles) than in the hearts of the control group (closed squares) or PT group (open circles). *P<0.05 versus the control group; #P<0.05 versus the PR group; +P<0.05 versus the PT group. N Normal
Changes in cardiac function and GOT release during H2O2 washout perfusion
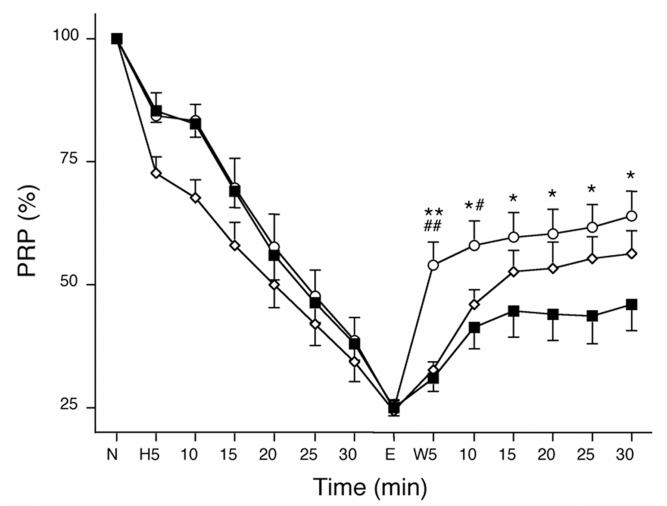
The duration of H2O2 perfusion was determined by the elevation of LVEDP. Washout of H2O2 began when the LVEDP was elevated to 50 mmHg. At the end of a 20 min stabilization period, the CPP, HR and LVDP values were similar to those during hypoxia and reoxygenation, and there were no differences among the groups (Table 2). After the 30 min washout, the recovery of LVEDP and LVDP in the PT group was better than that in the CT group. In this protocol, the PR+PT group was not different than the PT group (data not shown). The durations of H2O2 perfusion were 38.3±1.7 min for the CT group, 38.6±2.9 min for the PR group and 38.6±2.8 min for the PT group (not significant). At the beginning of the H2O2 perfusion, the PRP decreased faster in the hearts of the PR group than in the hearts of the CT or PT group, but it decreased to approximately 25% at the end of H2O2 perfusion in all groups (Figure 4). During the first 5 min of washout, the recovery of PRP was fastest in hearts of the PT group (P<0.01 versus the CT and PR groups) and was still greater than in the hearts of the CT groups after 30 min of washout (P<0.05 versus the CT group). Although the recovery of the PRP after PR was not statistically different than that in the CT group at the end of 30 min of washout, the difference between the PR and CT groups tended to increase with time. After 30 min of washout, the recovery of PRP was 45.9±5.4% in the hearts of the CT group, 56.1±4.9% in the PR group and 64.0±4.7% in the PT group. There were no significant changes in HR in all groups throughout the experiments. Therefore, the LVDP followed a pattern similar to the PRP (data not shown).
TABLE 2.
Characteristics of isolated perfused hearts during H2O2 washout experiments
| Factors
|
|||||
|---|---|---|---|---|---|
| Time | Group | CPP (mmHg) | Heart rate (beats/min) | LVEDP (mmHg) | LVDP (mmHg) |
| Baseline | CT | 57±1 | 297±9 | 0 | 114±3 |
| PR | 55±2 | 298±6 | 0 | 110±3 | |
| PT | 56±3 | 268±7 | 0 | 114±3 | |
| End time of perfusion with H2O2 | CT | 86±2 | 301±10 | 50 | 28±2 |
| PR | 81±3 | 307±9 | 50 | 26±1 | |
| PT | 81±2 | 275±13 | 50 | 28±2 | |
| 30 min of washout | CT | 82±3 | 297±10 | 39±5 | 53±6 |
| PR | 77±3 | 296±8 | 36±6 | 63±7 | |
| PT | 78±4 | 264±13 | 25±4* | 74±3* | |
All values are expressed as means ± SEM.
P<0.05 versus the control (CT) group. CPP Coronary perfusion pressure; LVDP Left ventricular developed pressure; LVEDP Left ventricular end-diastolic pressure; PR Ischemic preconditioning; PT Ischemic postconditioning
Figure 4.
Time courses of the changes in the pressure-rate product (PRP) during H2O2 washout perfusion (W). Recovery of the PRP was fastest in the hearts of the ischemic postconditioning group (open circles) after the first 10 min, and was still better in the ischemic postconditioning group hearts than in the control (CT) group hearts (closed squares) during the 30 min washout. However, the recovery of the PRP in the ischemic preconditioning group (open diamonds) was not significantly different than that of the CT group at the end of washout. *P<0.05 and **P<0.01 versus the CT group; #P<0.05 and ##P<0.01 versus the ischemic preconditioning group. E End time of perfusion with H2O2; N Normal
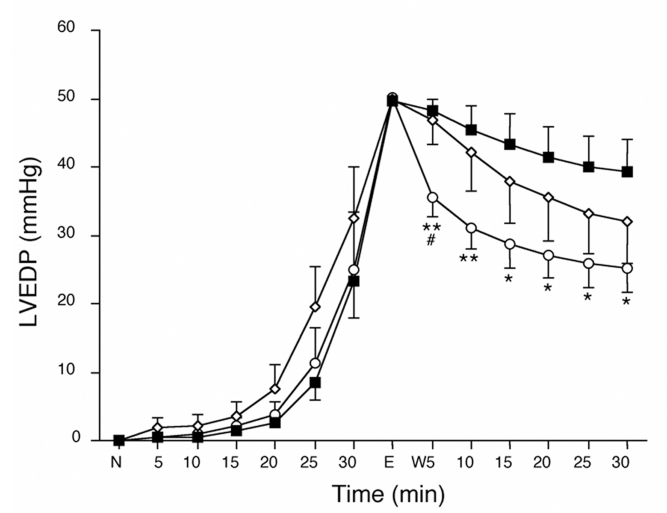
In all groups, the LVEDP increased only slightly after 20 min of H2O2 perfusion, but it then increased rapidly to 50 mmHg (Figure 5). The washout-induced decrease in LVEDP in the PT group was the fastest among the groups after 5 min, and LVEDP levels in the PT group were significantly lower than in the CT group at the end of the washout period.
Figure 5.
Time courses of left ventricular end-diastolic pressure (LVEDP) during H2O2 washout perfusion (W). The LVEDP was normalized at the ‘normal point’ (N) and then evaluated at various times. The decrease in LVEDP in hearts of the ischemic postconditioning group (open circles) was lowest among the groups after 5 min, and was still lower than in the hearts of the control (CT) group (closed squares) during washout. The decrease in LVEDP in the hearts of the ischemic preconditioning group (open diamonds) was not statistically different than that in the hearts of the CT group at the end of washout. *P<0.05 and **P<0.01 versus the CT group; #P<0.05 versus the ischemic preconditioning group. E End time of perfusion with H2O2
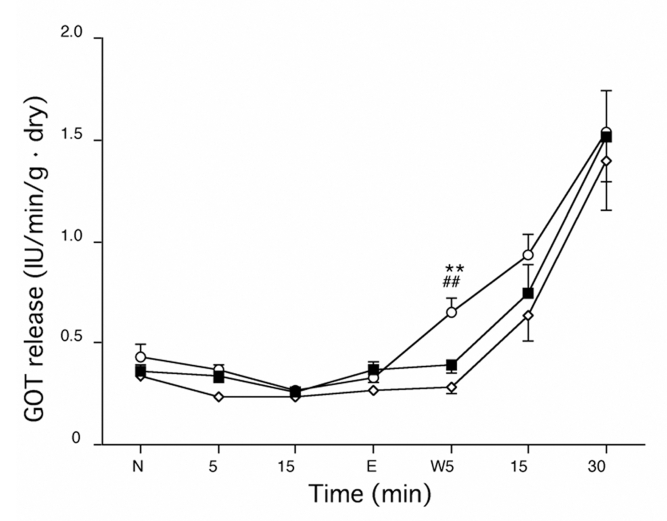
Myocardial GOT release remained near baseline during H2O2 perfusion and then increased gradually during the washout period (Figure 6). The amount of GOT release was lower in the hearts of the PR and CT groups than in those of the PT group (P<0.05 versus the CT group) after the first 5 min of washout, but after 30 min of washout, there were no differences in GOT release among the groups.
Figure 6.
Time course of the release of glutamic oxaloacetic transaminase (GOT) during H2O2 washout perfusion (W). The amount of GOT release was lower in the hearts of the ischemic preconditioning group (open diamonds) and control group (closed squares) than in the hearts of the ischemic postconditioning group (open circles) after the first 5 min of washout. There were no differences in GOT release among the groups at the end of washout. **P<0.05 versus the control group; ##P<0.05 versus the ischemic preconditioning group. E End time of perfusion with H2O2; N Normal
DISCUSSION
Our studies have demonstrated that PT shows a protective effect against hypoxia-reoxygenation injury in the isolated perfused rat heart, and the effect is similar to PR. In addition, the protective effects of combined PR and PT appear to be additive. Our studies also show that PT protects the heart from H2O2-induced damage, and the effect is better than that of PR using our particular protocols.
In the hypoxia-reoxygenation perfusion experiments, the recoveries of PRP produced by PR or by PT after 5 min and 30 min of reoxygenation were similar (Figure 2). This is concordant with recent evidence that PT is as effective as PR in reducing infarct size and preserving endothelial function (4). However, the values of GOT release in the PR group were lower than in the PT group. These results indicate that the protective mechanisms of PR and PT may be different. This suggested to us that the protective action of the combination of PR and PT may be greater than either alone, and our studies supported this hypothesis. The recovery of PRP after PR+PT was faster than after PR or PT alone after 5 min of reoxygenation, and was still better than the CT group throughout the period of reoxygenation. The GOT release after PR+PT was lower than that after PT at 2 min of reoxygenation and was also lower than that of PR at 30 min of reoxygenation (Figure 3). Although PT facilitated contractile recovery, it did not protect the heart from irreversible damage (ie, GOT release). However, PR+PT decreased GOT release to the level of that in the PR group, indicating the cardioprotective effects of both groups are also additive. This conclusion is in agreement with the recent findings that combined PR and PT in the in vivo rabbit heart induced additive protection (14), but disagrees with reports that the infarct sizes after PR or PT and PR+PT were not significantly different in an isolated rat heart (15) and canine model in vivo (16). This discrepancy may be attributable to the different protocols and parameters used in those experiments (15). In addition, under in vivo conditions (16), various factors, such as hormonal and autonomic nervous activities, may affect myocardial function.
We noted that the release of GOT after PT was not different than that of the CT group after 2 min of reoxygenation (Figure 3) and was even larger than the CT group after the 5 min washout of H2O2 (Figure 6). Some myocytes may have suffered from irreversible damage during hypoxia or H2O2 perfusion, and PT would probably accelerate the death of these myocytes.
ROS have been implicated in the myocardial dysfunction associated with ischemia-reperfusion injury (17). PT protects the heart by attenuating the production of ROS immediately after reperfusion (5). H2O2 is one source of reactive oxygen intermediates. Therefore, we perfused rat hearts with H2O2 to mimic the reperfusion injury that is induced by ROS during reperfusion. The concentration of 120 μM of H2O2 was chosen because there was no effect on heart functions when the concentration of H2O2 was less than 100 μM, and the functions decreased quickly and hardly recovered with washout when the concentration of H2O2 was more than 150 μM. The elevation of LVEDP was more significant than the decrease in LVDP at 30 min of H2O2 perfusion, and the level of recovery of heart functions was strongly dependent on the level of LVEDP. Therefore, the end point of perfusion with H2O2 was determined while LVEDP was elevated to 50 mmHg (data not shown).
Our original assumption was that PT applied at the beginning of the washout period would not affect the H2O2-induced injury because H2O2 is removed by the washout and PT is supposed to protect the heart by decreasing the generation of ROS. However, interestingly, PT did protect the hearts from H2O2-induced injury. The recovery of PRP in the PT group was faster at 5 min and still better than in the CT group throughout the washout period. Zorov et al (12) have described a positive feedback loop of ROS-induced ROS release. Therefore, in our studies, after perfusion with H2O2, ROS may have been released and caused further damages. Consequently, PT could inhibit the burst of ROS at beginning of washout. This may be one of the reasons why PT offers very effective protection against H2O2-induced injury in isolated rat hearts. Moreover, Zweier et al (10) have identified a spectral peak of an oxygen-centred free radical that appears during the first 10 s of reperfusion, and Ambrosio et al (11) observed that the peak of free radical generation of both carbon-and oxygen-centred radicals occurs at 15 s to 20 s following reperfusion. Our study also showed that PT applied by three cycles of 10 s of ischemia and 10 s of reperfusion is more effective than that of 30 s (data not shown). We consequently used three cycles of brief intermittent ischemia (10 s) at the beginning of reoxygenation. This, on the other hand, strongly suggests that the protection produced by PT is related to ROS.
PT not only accelerates the recovery of the contractile function of myocardium but also quickly decreases the elevation of the LVEDP produced by H2O2 perfusion (Figure 5). Gen et al (18) reported that Ca2+ overload could be induced by extracellular H2O2 and could be further increased during washout. Thus, in the CT group, H2O2-induced elevation of intracellular Ca2+ concentration would not be attenuated by washout, thus resulting in continued high LVEDP. On the other hand, in the PT group, LVEDP recovered to almost baseline levels, indicating that PT suppressed the elevation of intracellular Ca2+ during H2O2 washout.
ACKNOWLEDGEMENTS
The present study was supported in part by a High Technology Research Center grant from the Ministry of Education, Culture, Sports, Science, and Technology, Japan
REFERENCES
- 1.Murry CE, Jennings RB, Reimer KA. Preconditioning with ischemia: A delay of lethal cell injury in ischemic myocardium. Circulation. 1986;74:1124–36. doi: 10.1161/01.cir.74.5.1124. [DOI] [PubMed] [Google Scholar]
- 2.Liu Y, Downey JM. Ischemic preconditioning protects against infarction in rat heart. Am J Physiol. 1992;263:H1107–12. doi: 10.1152/ajpheart.1992.263.4.H1107. [DOI] [PubMed] [Google Scholar]
- 3.Lott FD, Guo P, Toombs CF. Reduction in infarct size by ischemic preconditioning persists in a chronic rat model of myocardial ischemia-reperfusion injury. Pharmacology. 1996;52:113–8. doi: 10.1159/000139374. [DOI] [PubMed] [Google Scholar]
- 4.Zhao ZQ, Corvera JS, Halkos ME, et al. Inhibition of myocardial injury by ischemic postconditioning during reperfusion: Comparison with ischemic preconditioning. Am J Physiol Heart Circ Physiol. 2003;285:H579–88. doi: 10.1152/ajpheart.01064.2002. (Erratum in 2004;286:H477) [DOI] [PubMed] [Google Scholar]
- 5.Kin H, Zhao ZQ, Sun HY, et al. Postconditioning attenuates myocardial ischemia-reperfusion injury by inhibiting events in the early minutes of reperfusion. Cardiovasc Res. 2004;62:74–85. doi: 10.1016/j.cardiores.2004.01.006. [DOI] [PubMed] [Google Scholar]
- 6.Galagudza M, Kurapeev D, Minasian S, Valen G, Vaage J. Ischemic postconditioning: Brief ischemia during reperfusion converts persistent ventricular fibrillation into regular rhythm. Eur J Cardiothorac Surg. 2004;25:1006–10. doi: 10.1016/j.ejcts.2004.02.003. [DOI] [PubMed] [Google Scholar]
- 7.Brown JM, Terada LS, Grosso MA, et al. Xanthine oxidase produces hydrogen peroxide which contributes to reperfusion injury of ischemic, isolated, perfused rat hearts. J Clin Invest. 1988;81:1297–301. doi: 10.1172/JCI113448. [DOI] [PMC free article] [PubMed] [Google Scholar]
- 8.Zweier JL, Kuppusamy P, Williams R, et al. Measurement and characterization of postischemic free radical generation in the isolated perfused heart. J Biol Chem. 1989;264:18890–5. [PubMed] [Google Scholar]
- 9.Takemura G, Onodera T, Ashraf M. Quantification of hydroxyl radical and its lack of relevance to myocardial injury during early reperfusion after graded ischemia in rat hearts. Circ Res. 1992;71:96–105. doi: 10.1161/01.res.71.1.96. [DOI] [PubMed] [Google Scholar]
- 10.Zweier JL, Flaherty JT, Weisfeldt ML. Direct measurement of free radical generation following reperfusion of ischemic myocardium. Proc Natl Acad Sci USA. 1987;84:1404–07. doi: 10.1073/pnas.84.5.1404. [DOI] [PMC free article] [PubMed] [Google Scholar]
- 11.Ambrosio G, Zweier JL, Flaherty JT. The relationship between oxygen radical generation and impairment of myocardial energy metabolism following post-ischemic reperfusion. J Mol Cell Cardiol. 1991;23:1359–74. doi: 10.1016/0022-2828(91)90183-m. [DOI] [PubMed] [Google Scholar]
- 12.Zorov DB, Filburn CR, Klotz LO, Zweier JL, Sollott SJ. Reactive oxygen species (ROS)-induced ROS release: A new phenomenon accompanying induction of the mitochondrial permeability transition in cardiac myocytes. J Exp Med. 2000;192:1001–14. doi: 10.1084/jem.192.7.1001. [DOI] [PMC free article] [PubMed] [Google Scholar]
- 13.Guide for the Care and Use of Laboratory Animals. United States National Institute of Health. Bethesda: NIH publication No 85–23; 1985. [Google Scholar]
- 14.Yang XM, Downey JM, Cohen MV. Multiple, brief coronary occlusions during early reperfusion protect rabbit hearts by activation of ERK and production of nitric oxide. Circulation. 2003;108(Suppl IV):158. (Abst) [Google Scholar]
- 15.Tsang A, Hausenloy DJ, Mocanu MM, Yellon DM. Postconditioning: A form of “modified reperfusion” protects the myocardium by activating the phosphatidylinositol 3-kinase-Akt pathway. Circ Res. 2004;95:230–2. doi: 10.1161/01.RES.0000138303.76488.fe. [DOI] [PubMed] [Google Scholar]
- 16.Halkos ME, Kerendi F, Corvera JS, et al. Myocardial protection with postconditioning is not enhanced by ischemic preconditioning. Ann Thorac Surg. 2004;78:961–9. doi: 10.1016/j.athoracsur.2004.03.033. [DOI] [PubMed] [Google Scholar]
- 17.Werns SW, Shea MJ, Lucchesi BR. Free radicals in ischemic myocardial injury. J Free Radic Biol Med. 1985;1:103–10. doi: 10.1016/0748-5514(85)90013-3. [DOI] [PubMed] [Google Scholar]
- 18.Gen W, Tani M, Takeshita J, Ebihara Y, Tamaki K. Mechanisms of Ca2+ overload induced by extracellular H2O2 in quiescent isolated rat cardiomyocytes. Basic Res Cardiol. 2001;96:623–9. doi: 10.1007/s003950170014. [DOI] [PubMed] [Google Scholar]


