

Abstract
Activation of lymphocytes in mammals is often quantified by measuring the amount of proliferation during the expansion phase of an immune response. Bromodeoxyuridine (BrdU) incorporation and carboxyfluorescein diacetate succinimidyl ester (CFSE) dilution assays are some of the techniques widely used in mammalian studies of pathogen-induced proliferation and provide a convenient way of quantifying the cellular response. We have extended the use of these proliferation assays to the amphibian Xenopus laevis. We have developed this species as a valuable comparative model to study immunity against a well-known amphibian pathogen, Frog Virus 3 (FV3). Fluorescence activated cell sorting was used to assess the level of BrdU incorporation of lymphocytes in vivo and CFSE dilution in an in vitro activation assay. Both techniques have shown that splenic lymphocytes proliferate specifically upon FV3 challenge. This indicates that common methods for detection of proliferation upon immunologic challenge are easily applied to other vertebrate species, as it highlights the evolutionary conservation of the proliferative nature of immune responses throughout vertebrate phyla.
Keywords: xenopus laevis, ranavirus, T-Lymphocytes
Introduction
At the start of an immune response in lymphoid organs, naive T lymphocytes are activated and proliferate in response to antigens (Ags) presented in the context of the major histocompatibility complex (MHC) receptors by professional antigen presenting cells (APCs). Effective pathogen clearance depends on the clonal expansion and maturation of T lymphocytes into T cell effectors that can recognize and act against specific Ags (1). Therefore, the measure and quantification of the level of proliferation in vivo in lymphoid organs as well as in vitro in cell cultures has become a staple of immune response assessment. The thymidine incorporation assay is a very common technique that measures lymphocyte responses by determining the amount of radioactive nucleotide incorporated into the DNA of proliferating cells in an in vitro culture after exposure to activating stimuli (2,3). A higher cell number due to proliferating cells results in a higher radioactive signal. Methods that use fluorescence activated cell sorting (FACS) to identify populations of proliferating cells have proven convenient and safe since they require no radioactivity and are more informative since they allow monitoring proliferation of distinctive cell populations identified by specific markers on their cell surface (4,5). Proliferation assays using multiparametric FACS have allowed the identification of differentially expanding T cells both in vivo (6) and in vitro (7) and have revealed the kinetics of T cell activation upon antigenic challenge over time. The two main methods widely used in mammals are bromdeoxyuridine (BrdU) incorporation and carboxyfluorescein diacetate succinimidyl ester (CFSE) staining.
BrdU is a thymidine analogue that incorporates into newly synthesized DNA of cells at the S phase of the cell cycle (8). Antibodies specific to BrdU are used to determine the presence of the molecule in the genomic DNA and the number of cells that have incorporated it. Because BrdU is intracellular, antibodies specific to surface molecules can also be used to identify the cell types incorporating BrdU in a given population. The use of a specific antibody to nascent DNA makes it a useful technique for immunohistochemical, cytometric and microscopic analyses (9).
An alternative to BrdU incorporation assays, and not based on DNA synthesis, is the use of CFSE, a membrane permeable non-toxic fluorescent dye also widely used for the detection of immune cell proliferation in vitro (10). CFSE incorporates at similar levels into all cells but dilutes two fold at each cell division. This permits the detection of up to 10 cellular divisions and therefore provides a more robust quantification of the proliferation by a cell population than BrdU incorporation (5).
Whereas activation and expansion of T cells during antiviral responses are well characterized in mammals (11-14) very little is known about the proliferative capacity of activated T lymphocytes against viral pathogens in cold-blooded vertebrates. In one account, cells isolated from trout kidneys were shown to proliferate in response to adherent cells that had been stimulated previously with a recombinant viral protein that act as antigen presenting cells (15). However, due to the lack of antibodies that recognize specific surface markers in this species, a more detailed analysis of the nature of proliferating cells is missing. We have established Xenopus as an important model with which to study immunity against ranaviruses (Iridoviridae) in amphibians (16) and showed evidence of the critical role of splenic lymphocytes, in particular CD8 T cells, in host resistance to Frog Virus 3 (FV3) infection (17). Proliferation of splenic CD8 T cells upon FV3 infection has been recently characterized in vivo using a BrdU incorporation method and fluorescence activated cell sorting (FACS) (18). In this review, we describe in detail these methods, adapted for Xenopus, to monitor the proliferating responses to virus of splenocytes, including total T cells, CD8 T cells and IgM+ B cells.
Materials and Methods
Animals, reagents and FV3 stocks
Two-year old (about 3 in. long) outbred Xenopus adults, and monoclonal antibodies (mAbs) specific to Xenopus CD8 (AM22; 19), Class II (AM20, 19) and IgM (10A9; 20) were obtained from the X. laevis Research Resource for Immunobiology at the University of Rochester Medical Center (http://www.urmc.rochester.edu/smd/mbi/xenopus). Frog Virus 3 (FV3, Iridoviridae) was grown in and purified from A6 Xenopus kidney cell line as previously described (16). Viral titers were determined using A6 cells by the 50% endpoint dilution method. Randomized groups of frogs were inoculated by intraperitoneal injection of 5 x 10⁶ pfu of FV3 in 300 μl of PBS modified to amphibian osmolarity (APBS). All animals were handled under strict laboratory and UCAR regulations (Approval number 2004-199), minimizing discomfort at all times.
In vivo BrdU incorporation assay
Outbred adult frogs were injected once with 3x10⁶ pfus FV3 and incubated for 3, 6, 9 and 14 days. Frogs were then incubated in 100ml of water containing 1mg/ml bromodeoxyuridine (BrdU, Sigma St. Louis, MO; Catalog #B5002-1G) 2 days before sacrifice. Splenocytes were washed 2x in APBS, counted and stained for surface markers CD8 (AM22, IgM isotype), Class II (AM20; IgG1 isotype) and IgM (10A9; IgG1 isotype) followed by APC conjugated Goat anti Mouse mAb (Accurate JGM136146). Cells were washed in APBS/0.05% Tween to permeabilize and treated with DNase (Sigma DN25-1G) followed by incubation with FITC conjugated anti BrdU mAb (Roche 1202693). Cells were then washed and analyzed by flow cytometry using a FACS Calibur (BD Biosciences). 20,000 events were collected and the lymphocyte population was gated based on their forward and side scatter profiles.
In vitro CFSE proliferation assay
Peritoneal leukocytes (PLs) from outbred frogs infected once for 3-weeks with 3x10⁶ pfu FV3 (primed) or uninfected (unprimed) were isolated by peritoneal lavage (2), washed with APBS and infected with FV3 at 1 multiplicity of infection (MOI) for 24 hours in 1ml amphibian grade culture medium (ASF-A6) in 24 well plates. Twenty-four hours later, spleens harvested from the same outbred frogs were scraped using a nylon mesh and washed two times with APBS. Cells were labeled with 5μM CFSE (Sigma 21880) for 20 min. at 27°C in the dark and washed 3 times with APBS. Splenocytes were added to infected PLs at a 1:1 ratio for 24, 48 and 72 hours. For FACS analysis, total co-culture cells were washed twice in APBS and stained using Xenopus specific mAbs, as mentioned above.
Results and Discussion
Anti-viral lymphocyte proliferative responses monitored in vivo by BrdU incorporation in Xenopus
To assess the in vivo proliferative response of Xenopus splenocytes during viral infection, we adapted the BrdU incorporation assay used in the mouse model (5). Adult frogs were injected intraperitoneally with the iridovirus FV3 and treated with 1mg/ml of BrdU directly added in the water 2 days before sacrifice. A representative experiment is depicted in Fig. 1A. Forward scatter and side scatter profiles of Xenopus splenocytes are comparable to that of mammals, indicative of small cells with little to no granularity. The slight increase in the size of the lymphocytes (indicated by an arrow in Fig. 1 forward scatter and side scatter plots) in infected frogs compared to the uninfected controls suggests activation and consequent blasting of lymphocytes in the spleen as observed in mammals and ectothermic vertebrates (21). Similarly, the total number of splenocytes, as well as BrdU+ cells, obtained from infected frogs was substantially higher than uninfected frogs, indicating an expansion of cells due to immune activation (Fig. 1).
Fig. 1.
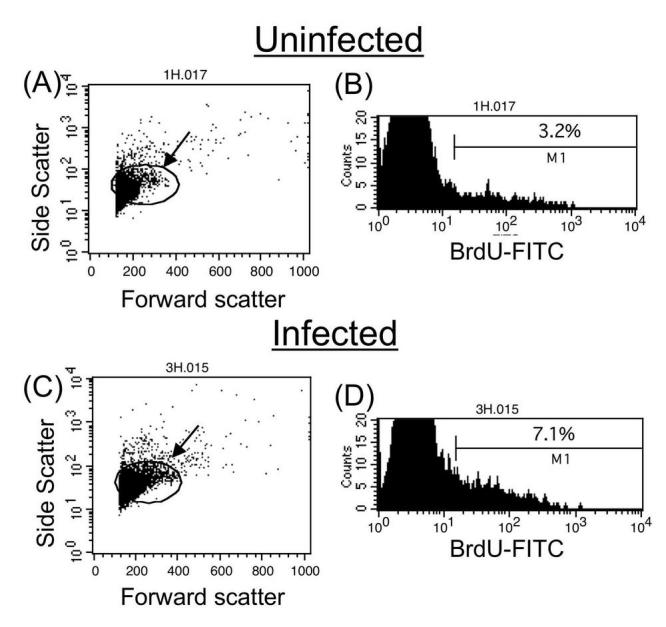
Detection of Xenopus splenocyte proliferation 6 days post-FV3 infection by BrdU assay. Uninfected control frogs and frogs infected for 6 days with FV3 were treated with BrdU 48 hrs before the assay. Cells were then permeabilized, treated with DNase, stained with FITC-conjugated anti-BrdU mAb, and analyzed by FACS (Representative of six different experiments). Ten thousand total events were gated based on side and forward scatter profiles (A, C). The arrows depict cells with higher forward scatter that increase in number in the infected sample. The percent of gated BrdU positive cells is shown in the histograms (B, D).
Gating was done on cells with size characteristics of lymphocytes (also the most prominent population in the spleen) in both infected and uninfected samples for analysis of surface markers and BrdU (Figs. 1 and 2). Although some BrdU incorporation was detected in lymphocytes from uninfected animals, a significantly higher fraction of lymphocytes in the infected frog had incorporated BrdU (Fig. 1 histograms). About 7% of total splenocytes in the infected frog incorporate BrdU versus 3% in the uninfected control. The low level of proliferation detected in uninfected animals is possibly due to the basal homeostatic proliferation of various lymphocyte subsets or an unidentified immune response in that animal, given that animals in our facilities are not germ free. To determine the cell types involved in the proliferative response upon FV3 infection, we took advantage of Xenopus specific mAbs recognizing cell surface markers such as CD8 for T cells, MHC class II for all lymphocytes and IgM for B cells. As previously described in detail (18), CD8 T cells constitute the main lymphocyte effectors proliferating in response to FV3 infection. We recently found that IgM+ B cells also undergo a marked proliferative response against FV3, albeit lower than CD8+ lymphocytes (Fig. 2, far right panels). In addition, surface IgM expression in BrdU negative cells of the infected sample was increased from 2% to 11%, (Fig 2). This result further substantiates earlier observations of B cell activation during a primary FV3 response, which is necessary for the establishment of memory B cell responses observed during a secondary response (22). Furthermore, proliferation in the spleen is due entirely to immune cells since no MHC class II negative cells proliferate (e.g., incorporate BrdU) upon FV3 challenge during the times tested (Fig. 2, lower right quadrants of MHC-II dot plots).
Fig. 2.
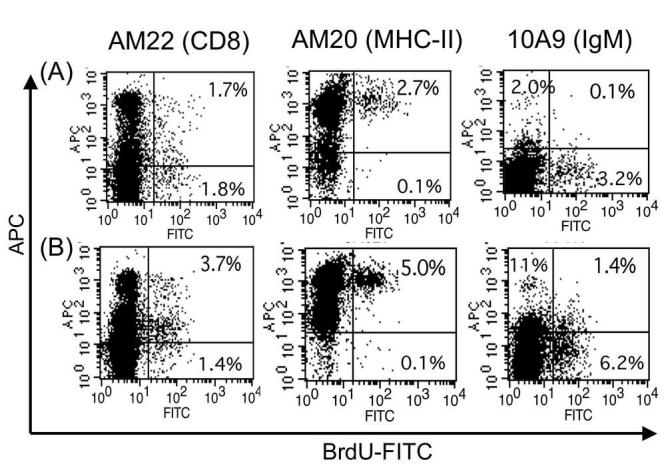
Proliferation of CD8+ T and IgM+ B cells 6 days post-FV3 infection detected by BrdU assay. Representative two-color flow cytometry analysis of splenocytes from uninfected control frogs (A), and frogs infected for 6 days (B). Splenocytes were surface stained for Xenopus MHC Class II (AM20), CD8 (AM22) or IgM (10A9) followed by APC-conjugated goat anti-mouse secondary antibody. Cells were then permeabilized, treated with DNase and stained with FITC-conjugated anti-BrdU mAb and analyzed by FACS. Twenty thousand total events were gated based on side and forward scatter profiles as in Fig. 1. The number in the upper right quadrant indicates the percent of double positive cells.
These results show that proliferation of immune cells in the spleen of an ectothermic vertebrate upon pathogenic challenge can be monitored in vivo by a BrdU incorporation assay as it is done in mammals, and further highlights the improvement of immunologic techniques in X. laevis.
Anti-viral lymphocyte proliferative responses monitored in vitro by CFSE dilution assay in Xenopus
Our previous study has provided in vivo evidence of an accelerated CD8 T cell response during secondary viral challenge (18). These results suggest that CD8 T cells were efficiently primed during the primary anti-viral response and that memory T cells were generated. To further characterize the proliferative response of primed T cells, we have developed an in vitro proliferation method using CFSE, which is a fluorescent dye that incorporates into all viable cells. Upon cell division, CFSE is equally distributed in each daughter cell, making it possible to measure each dividing cell from the parent cell as diluted CFSE in a population.
We have characterized peritoneal leukocytes (PLs) likely to be antigen-presenting cells in Xenopus laevis (Morales and Robert unpublished results). During FV3 infection, in vivo, cells in the peritoneum increase in number and size, and macrophage-like cells constitute roughly 30-50% of total peritoneal leukocytes. To test whether macrophage-like cells in the peritoneum act as antigen presenting cells, PLs were isolated from 3 week primed animals and infected in vitro with 1MOI FV3 for 24hours, then co-cultured with CFSE-stained splenocytes from the same animal for 72 hours. Unprimed CFSE stained splenocytes co-cultured with infected PLs from the same animal were used as a negative control. The profiles of both in vitro co-cultures at time 0 shows an expected high CFSE content in splenocytes, which have not yet begun to proliferate (representative show in Fig. 3 top panel). Given the low number of PL's in the culture, no CFSE negative population is visible. The dot plots in Fig. 3A show differences in side scatter and forward scatter profiles between unprimed and primed cells cultured with infected PL's for 72hrs. Similar to what is observed in vivo with the BrdU incorporation assay, cells are slightly larger (see arrow) and more abundant within the gate in the primed samples (about 50% of total primed splenocytes versus 41% of unprimed splenocytes lie within the gate; data not shown). As shown in panel B a significant amount of proliferation, indicated by the dilution of CFSE staining, is observed (bottom panel B). This includes about a 2% increase in CFSE diluting MHC-II and CD8 positive cells. Furthermore, among the 3% of primed MHC-II cells that display dilution of CFSE, 2% are CFSE low or negative, and most of the 2.5% CD8+/CFSEdil T cells are also CFSE low or negative. This is indicative of an extensive daughter cell generation. No significant increase of division is observed in co-culture between unprimed CFSE+ splenocytes and infected PLs.
Fig. 3.
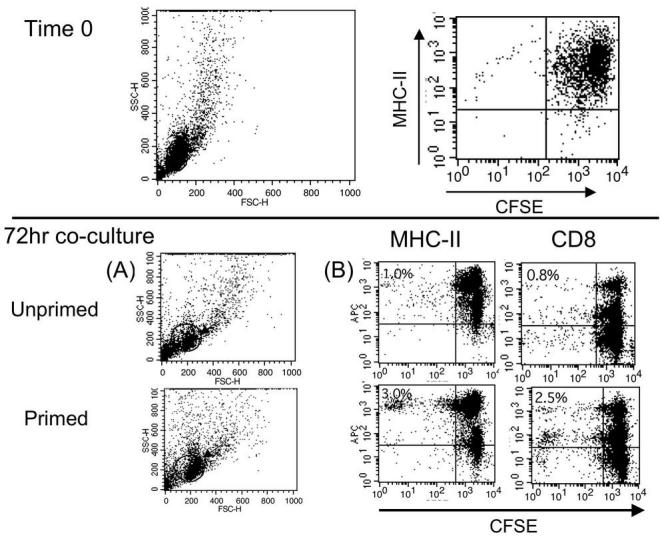
Detection of Xenopus primed splenocyte proliferation induced in vitro by FV3 infected FV3 peritoneal leukocytes using the CFSE assay. Splenocytes from an uninfected control frog or a frog primed 3 weeks before the assay by infection with FV3 were CFSE stained and co-cultured for 72 hours with FV3 infected peritoneal leukocytes obtained from the same frogs 3 days before the assay. Total culture was surface stained for MHC class II (AM20) or CD8 (AM22) and analyzed by FACS. A time zero analysis shows initial CFSE staining of splenocytes prior to co-culture. Analysis at 72 hrs (B) was done on gated population in the side scatter dot plot (A). Numbers in upper left quadrant indicates the percent of CD8 or Class II positive cells with diluted CFSE.
The significance of these results is three fold: (i) in Xenopus both MHC-II+ cells and CD8+ T cells proliferate in vitro in response to stimulation with FV3 infected PLs; (ii) PLs can act as antigen presenting cells in vitro; and (iii) the usefulness and efficiency of this method is remarkable as it can be used in combination with multiple conditions to test antigen presentation and pathogen specificity of which little is known in ectothermic vertebrates.
To our knowledge, this is the first account of a measurable proliferative response of lymphocytes against a viral pathogen in an ectothermic vertebrate. We have shown that commonly used techniques to determine lymphocyte proliferation in mammals can also be applied to assess cellular immune responses in amphibians. We have previously shown that CD8 T cells involved in anti-ranaviral response in Xenopus proliferate (e.g., incorporate BrdU) at detectable levels in the spleen, in both primary and secondary infections. Furthermore, T cell priming resulting from FV3 infection can be determined in vitro by co-culture of primed splenocytes with antigen presenting cells infected with FV3. The use of CFSE in this instance allows a rigorous analysis of the level of proliferation of various Xenopus lymphocyte populations. It is noteworthy that in both BrdU and CFSE based assays, proliferation of activated lymphocytes was minimal compared to that observed in mammals (4,7). We have suggested that the relatively small response of Xenopus lymphocytes may be due to the lack of secondary lymphoid organs such as the lymph nodes, which facilitate intimate contact with the antigen presenting cells (22,23). However, since we also observe this effect in vitro, it may be due to intrinsic characteristics of the cellular potential in this ectothermic vertebrate. We speculate, for example, that the effect of cytokine secretion in Xenopus may be limited by either a relatively lower amount of secreted cytokine, diminished receptor expression in the cell surface or a lack of those cytokines specifically involved in boosting T cell proliferation in mammals (i.e. IL-2, IL-17 and IL-15).
Some technical issues concerning the use of BrdU and CFSE in Xenopus splenocytes are discussed below. The DNAse treatment in the BrdU incorporation assay, which opens the genomic DNA and allows the antibody access to the BrdU epitope, is damaging and results in loss of cells; about 100,000 to 500,000 (or 20-50% of starting cell numbers) cells can be lost in a single DNase treatment. While a lower DNase concentration diminishes cell loss, it also decreases the intensity of the specific signal, and ultimately, the number of positive cells. Optimal results were obtained when the initial total number of cells per sample was increased (about 1x10⁶ cells/sample), a feasible approach since about 10-20 million total cells can be isolated from a single Xenopus adult spleen. Another problem inherent to the laborious nature of the BrdU assay are the multiple washing steps necessary for the elimination of cross-reactive binding, and that can also contribute to a considerable loss of cells. We found that suction of the washing and staining buffers with a Pasteur pipette connected to a vacuum pump rather than decanting after centrifuging minimized cell loss.
CFSE staining of Xenopus splenocytes has been successfully used before in adoptive cell transfer experiments (23), but multiple concentrations of CFSE were tested to obtain optimal staining of splenocytes. Cytotoxicity caused by CFSE is observed at levels over 50 mM for approximately 20x106 total cells, but a 5μM CFSE concentration was optimal and no cytotoxicity was observed (see T0 on Fig.3). In contrast to thymidine incorporation assays, the CFSE proliferation assay is more informative since, with the use of flow cytometry it allows the identification of proliferating cells by specific surface markers. Furthermore, while CFSE can identify the effector cell population the serial dilutions observed in a dot plot can indicate the intensity of the effector response. In contrast, effector cell proliferation in thymidine incorporation assays may be masked by spontaneous proliferation of stimulator cells or by cell death, resulting in high background and an underestimation of the effector response. Repeated experiments have yielded consistent results and have rendered the CFSE proliferation assay as a valuable and reliable tool in our studies.
One common caveat for the use of green fluorochrome dyes in amphibian cells is autofluorescence and, given the emission spectrum of diluted CFSE, distinguishing true proliferation from autologous fluorescence using FACS can be challenging. However, this is easily circumvented by the use of an unlabeled control to determine basal level autofluorescence. Fortunately, the color intensity of the initial CFSE staining is significantly higher than autofluorescent Xenopus cells and diluting CFSE cell populations can be easily distinguished in a flow cytometry dot plot (see bottom panels in Fig. 3). Furthermore, given that autofluorescence does not vary significantly from individual to individual, comparisons between treated and untreated samples can provide a standard of autofluorescence usable in all experiments.
Overall, our studies show that both BrdU and CFSE are reliable cell labeling techniques for identifying and measuring the amount of proliferating cells in Xenopus spleen and splenocyte cultures, respectively. Both are relatively simple to perform and have the advantage of measuring cell type specific activation. It is safe to say that many methods used in mammals to assess immune cell function are easily transferable to other vertebrate models, further bridging the gap to a complete understanding of cellular immune responses throughout vertebrate phyla.
Acknowledgments
The expert animal husbandry provided by Tina Martin and David Albright is gratefully appreciated. We would also like to thank Ana Goyos and Dr. Asiya Seema Chida for critically reading the manuscript. Research support: NIH T32-AI07285 (H. M.), R24-AI-059830 (J. R.), and NSF MCB-0445509 (H. M. and J.R).
Abbreviations
- Ag
antigen
- APBS
amphibian phosphate buffered saline
- BrdU
bromodeoxyuridine
- CFSE
carboxyfluorescein diacetate succinimidyl ester
- FACS
fluorescence activated cell sorting
- mAb
monoclonal antibody
- MHC
major histocompatibility complex
Protocols
Protocol I: In vivo BrdU incorporation assay
Reagents:
Amphibian grade PBS- PBS + 30% distilled H20
5g/L Tricaine methane sulfonate (TMS222; Crescent Research Chemical, Phoenix AZ, cat. # 886-86-2) buffered with sodium bicarbonate 0.5 g/L.
Staining Buffer 1: APBS containing 1% BSA and 0.01%NaN3
DNAse buffer: 40mM Tris HCl, pH8.0 with 10mM NaCl and 6mM MgCl2
Permeabilization buffer: APBS containing 1% Paraformaldehyde (Sigma) and 0.05% Tween 20 (Sigma)
Staining Buffer 2: APBS containing 0.01% Tween 20
FV3 infection and Incubation with BrdU:
In vivo BrdU incubation works best with outbred frogs of about 2 years of age or 2-3 inches long. Outbred frogs are injected intraperitoneally with 1-5x10⁶ pfus of FV3 in sterile APBS. The animals are kept in our facility away from uninfected animals for 4 days. Each frog is placed separately in a 500ml beaker with 100ml dechlorinated water containing 1mg/ml BrdU 2 days before sacrifice.
Splenocyte harvest:
At time of harvest, euthanize the animals in 5g/L TMS222.
Remove the spleen and keep in cold APBS on ice.
Scrape the spleen (sterile technique not necessary) with a nylon mesh and wash the cells 2 times with APBS and 1 time with Staining Buffer 1.
Count the cells and distribute them at 500,000 - 1x10⁶ cells per sample
Cell staining:
After washing, resuspend the cells in 100 ml mAb diluted at 1mg/ml (final concentration) with Staining buffer 1, incubate for 30 min-1 hr on ice.
Wash 2 times with Staining Buffer 1.
Resuspend cells in 100 ml secondary Ab (if needed) diluted in staining buffer 1, and incubate in the dark on ice for 30 min. Keep cells in the dark from now on.
Wash 2 times with staining buffer 1.
Resuspend in 50-100μl of permeabilization buffer at room temperature for 30 min in the dark.
Wash 2 times with DNase buffer.
Resuspend cells in 100 ml DNase buffer + 3 ml DNase I at 37°C for 30min.
Wash 2 times in staining buffer 2.
Incubate in 3 ml anti-BrdU-FITC in 25 ml of staining buffer 2 on ice for 30min-1hr.
Wash 2 times with Staining buffer 2 and resuspend in at least 100 ml staining buffer.
Analyze by FACS.
Protocol II: CFSE proliferation assay
Reagents:
CFSE: Dissolve CFSE powder in DMSO to a 5mM stock. Aliquot 100 ml in eppendorf tube. Keep in -20°C in a dark and dry area.
ASF-A6-MSF: Iscove DMEM basal medium diluted at the amphibian osmolarity and containing 5% FBS, 10 mg/ml of Kanamycin and 20% supernatant from the A6 kidney fibroblast cell line (ATCC: CCL 102; see ref. 17 for more details).
Staining Buffer 1: APBS with1% BSA and 0.01%NaN3.
Priming:
Outbred frogs are primed by intraperitoneal injection of 1-5x10⁶ pfus FV3 in sterile APBS. The animals are kept in our facility away from uninfected animals for 3-4 weeks.
Peritoneal leukocyte isolation and in vitro infection:
Peritoneal leukocytes (PLs) from infected and uninfected animals are isolated by peritoneal lavage as described in detailed elsewhere (2). Anesthetized frogs (a 0.1% aqueous solution buffered with sodium bicarbonate of TMS222) are injected intraperitoneally (sterile syringe with a 22 gauge 1½ inch needle) with 5 to 10 ml (depending of the size of animal) of APBS prewarmed at room temperature. The frog is then gently massaged then the solution injected is recovered into a sterile tube by puncture with a 22G 1½ gauge needle. Cells are washed twice with cold APBS, counted with a hemacytometer and seeded in a 24-well plate at 100,000-500,000 cells per well in 1ml ASF-A6 medium. Cells are then infected with FV3 at 1 MOI (or 100,000-500,000 pfu per well), and incubated overnight at 27°C in a CO2 chamber.
Day 1 Co-culture Splenocytes:
Euthanize frogs in 5g/L TMS222 and isolate the spleen using sterile technique.
Scrape the spleen and wash with cold sterile APBS. Ensure proper suspension.
-
Incubate with 520mM* CFSE at 50x106 cells/ml at 27°C in the dark for 20 min.
*Ex vivo splenocytes stain well at 5µM concentration, however, a CFSE titration should be done to determine best labeling concentration for cells of interest.
Wash cells well 2-3x with cold APBS.
Distribute splenocytes with corresponding PLs at a one to one ratio (different stimulator to primed splenocyte ratios may also be done).
Incubate the plates at 27°C in a CO2 chamber for 48- 96 hours.
Total co-culture is used for cell surface labeling.
Day 2-Day 6 Cell surface labeling:
Resuspend cells and wash 2 times in cold APBS and 1 time in cold staining buffer 1.
Distribute to at least 100,000 cells per stain.
Add 100ml of diluted primary antibody and incubate on ice for 30min-1hr.
Wash cells 2 times in staining buffer 1.
Add 100ml of diluted secondary antibody and incubate on ice 30min-1hr.
Wash cells 2 times in staining buffer and resuspend in at least 100μl staining buffer.
Analyze by FACS. Collect at least 20,000 total events.
References
- Role of ab and gd T cell subsets in viral immunity. Doherty P, Allan W, DeMuth M. Annu Rev Immunol. 1992;10:123–151. doi: 10.1146/annurev.iy.10.040192.001011. [DOI] [PubMed] [Google Scholar]
- Methods used to study the immune system of Xenopus (Amphibia, Anura). Du Pasquier L, Flajnik MF, Guiet C, Hsu E. Immunol Methods. 1985;3:425–465. [Google Scholar]
- Xenopus as an model system to study evolution of HSP-immune system interactions. In: Methods: A Companion to Methods in Enzymology (HSP-Immune System Interactions). Loder J, Maniero G, Cohen N, Gantress J. P. Srivastava, Academic Press. 2004;32:42–53. doi: 10.1016/s1046-2023(03)00186-5. [DOI] [PubMed] [Google Scholar]
- Indentification of DNA replicating lymphocyte subsets using a new method to label the bromo-deoxyuridine incorporated into the DNA. Carayon P, Bord A. J Immunol Methods. 1992;142:225–230. doi: 10.1016/s0022-1759(12)80012-3. [DOI] [PubMed] [Google Scholar]
- Analysing cell division in vivo and in vitro using flow cytometric measurements of CFSE dilution. Lyons AB. J Immunol Methods. 2000;243:147–154. doi: 10.1016/S0022-1759(00)00231-3. [DOI] [PubMed] [Google Scholar]
- Turnover of naïve and memory phenotype T cells. Tough DF, Sprent J. J Exp Med. 1994;179:1127–1135. doi: 10.1084/jem.179.4.1127. [DOI] [PMC free article] [PubMed] [Google Scholar]
- Quantitative analysis of lymphocyte differentiation and proliferation in vitro using carboxyfluorescein diacetate succinimidyl ester. Hasbold J, Gett AV, Rush JS, Deenick E, Avery D, Jun J, Hodgkin PD. Immunol Cell Biol. 1999;77:516–522. doi: 10.1046/j.1440-1711.1999.00874.x. [DOI] [PubMed] [Google Scholar]
- S-phase detection with an antibody to bromodeoxyuridine. Role of DNase pretreatment. Gonchoroff NJ, Katzmann JA, Surriw RM, Evans EL, Houck DW, Kline BC, Greipp PR, Loken MR. J immunol Methods. 1986:93–97. doi: 10.1016/0022-1759(86)90438-2. [DOI] [PubMed] [Google Scholar]
- Characterization of monoclonal antibodies to bromodeoxyuridine. Vanderlaan M, Thomas CB. Cytometry. 1985:6–501. doi: 10.1002/cyto.990060603. [DOI] [PubMed] [Google Scholar]
- Determination of lymphocyte division by flow cytometry. Lyons AB, Parish CR. J. Immunol. Methods. 1994:171–183. doi: 10.1016/0022-1759(94)90236-4. [DOI] [PubMed] [Google Scholar]
- Functional Signatures in antiviral T cell Immunity for monitoring virus associated diseases. Pantaleo G, Harari A. Nature Rev Immunol. 2006;6:417–422. doi: 10.1038/nri1840. [DOI] [PubMed] [Google Scholar]
- T cells and viral persistence: lessons from diverse infections. Klenerman P, Hill A. Nature Immunol. 2005;6:873–879. doi: 10.1038/ni1241. [DOI] [PubMed] [Google Scholar]
- HIV specific CD8T cell proliferation is coupled to perforin expression in nonprogressors. Migueles SA, Laborico AC, Shupert WL, Sabbaghian MS, Rabin R, Hallahan CW, Van Baarle D, Kostense S, Miedema F, McLaughlin M, Ehler L, Metcalf J, Liu S, Connors M. Nature Immunol. 2002;3:1061–1068. doi: 10.1038/ni845. [DOI] [PubMed] [Google Scholar]
- Large clonal expansions of human virus-specific memory cytotoxic T lymphocytes within the CD57+CD38-CD8+ T cell population. Weekes M, Wills MR, Mynard K, Hicks R, Sissons JG, Carmichael AJ. Immunology. 1999;98:443–449. doi: 10.1046/j.1365-2567.1999.00901.x. [DOI] [PMC free article] [PubMed] [Google Scholar]
- Viral-antigen dependence and T cell receptor expression in leucocytes from rhabdovirus immunized trout. Estepa A, Alvarez F, Ezquerrra A, Coll JM. Vet Immunol Immunopath. 1999;68:73–89. doi: 10.1016/S0165-2427(99)00013-6. [DOI] [PubMed] [Google Scholar]
- Development and characterization of a model system to study amphibian immune responses to iridoviruses. Gantress J, Maniero GD, Cohen N, Robert J. Virology. 2003;311(2):254–262. doi: 10.1016/S0042-6822(03)00151-X. [DOI] [PubMed] [Google Scholar]
- Adaptive immunity and histopathology in frog virus 3-infected Xenopus. Robert J, Morales H, Wayne B, Cohen N, Marr S, Gantress J. Virology. 2005;332:667–675. doi: 10.1016/j.virol.2004.12.012. [DOI] [PubMed] [Google Scholar]
- In vivo characterization of primary and secondary anti- ranavirus CD8 T cell responses in Xenopus laevis. Morales H, Robert J. J Virology. 2007;81:2240–2248. doi: 10.1128/JVI.01104-06. [DOI] [PMC free article] [PubMed] [Google Scholar]
- Reagents specific for MHC I antigens of Xenopus. Flajnik MF, Taylor E, Canel C, Grossberge D, Du Pasquier L. Amer Zool. 1991;31:580–591. [Google Scholar]
- Studies in Xenopus immunoglobulins using monoclonal antibodies. Hsu E, Du Pasquier L. Mol Immunol. 1984;21:257–270. doi: 10.1016/0161-5890(84)90096-8. [DOI] [PubMed] [Google Scholar]
- Phylogeny of Lymphocyte Structure and Function. Cohen N. Amer Zool. 1975;15(1):119–133. [Google Scholar]
- Generation of a long-lasting, protective, and neutralizing antibody response to the ranavirus FV3 by the frog Xenopus. Maniero CD, Morales H, Gantress J, Robert J. Devel Comp Immunol. 2006;30:649–657. doi: 10.1016/j.dci.2005.09.007. [DOI] [PubMed] [Google Scholar]
- Phylogenetic conservation of gp96-mediated antigen specific cellular immunity: New evidence from adoptive cell transfer in Xenopus. Maniero CD, Robert J. Transplantation. 2004;78(10):1415–1421. doi: 10.1097/01.TP.0000140846.73210.91. [DOI] [PubMed] [Google Scholar]