

Abstract
Acrolein (Acr), a hazardous air pollutant, reacts readily with deoxyguanosine (dG) in DNA to produce cyclic 1,N2-propanodeoxyguanosine adducts (Acr-dG). Studies show that these adducts are detected in vivo and may play a role in mutagenesis and carcinogenesis. In the present study, we developed a quantitative 32P-postlabeling/solid phase extraction/HPLC method by optimizing the solid phase extraction and the 32P-postlabeling conditions for analysis of Acr-dG in DNA samples with a detection limit of 0.1 fmole. Using this assay, we found Acr-dG can be formed as an artifact during the assay. We obtained evidence from mass spectrometry showing that Acr in water used in the assay is a likely source of artifact formation of Acr-dG. The formation of Acr-dG as an artifact can be effectively blocked by adding glutathione (GSH) to the DNA sample to be analyzed. In addition, we detected Acr-dG as a contaminant in the commercial dG and dT 3′-monophosphate samples. Finally, we applied this method to detect Acr-dG in calf thymus and human colon HT29 cell DNA with an excellent linear quantitative relationship.
Keywords: acrolein, deoxyguanosine, cyclic DNA adduct, glutathione, 32P-postlabeling, high performance liquid chromatography, solid phase extraction, mass spectrometry
Introduction
Acrolein (Acr) is a ubiquitous pollutant in urban air [1, 2]. Incomplete combustion of gasoline and diesel fuels is known to emit aldehydes [3, 4]. Acr is present in automobile exhaust at concentrations as high as 30 μg/l [5]. Combustion of alternative fuels containing alcohol or ether produces even more aldehydes than conventional fuel [6]. Cigarette smoke is another important source of Acr with concentrations up to 300 μg/l in mainstream smoke [7, 8]. High temperature cooking of oils generates Acr as a major product [9]. Because of widespread exposure and potential harmful effects to humans, Acr is one of the most studied pollutants.
In addition to the environmental exposure, Acr is also an oxidative product of polyunsaturated fatty acids [10]. Acr is important not only because of its ubiquity and abundance but also its toxicity as an irritant to the respiratory system and potential role in causing cancer. It has been shown that Acr is mutagenic and carcinogenic [1]. These effects could be attributed to its modification of DNA bases forming pro-mutagenic cyclic adducts. As a major reaction, Acr reacts with deoxyguanosine (dG) in DNA to produce two pairs of diastereomeric adducts (Scheme 1A): (6R/S)-3-(2'-deoxyribos-1'-yl)-5,6,7,8-tetrahydro-6-hydroxypyrimido[1,2-α]purine-10(3H)one (α-OH-Acr-dG) and (8R/S)-3-(2'-deoxyribos-1'-yl)-5,6,7,8-tetrahydro-8-hydroxypyrimido[1,2-α]purine-10(3H)one (γ-OH-Acr-dG) [11, 12]. A highly sensitive HPLC-based 32P-postlabeling method was developed earlier for the detection of Acr-dG in tissue DNA [13]. Using this method, Acr-dG adducts were detected in tissue of untreated rodents and humans as background lesions in DNA [14, 15]. While evidence obtained supports lipid peroxidation as an endogenous source for the formation of Acr-dG adducts and other cyclic adducts, the levels of these adducts in tissues can increase upon heavy environmental exposure such as cigarette smoking [16]. Following exposure to high concentrations of Acr in filtered air, a significant increase in Acr-dG adduct formation in the aorta DNA of cockerels was reported [17]. Using the HPLC-based 32P-postlabeling method, γ-OH-Acr-dG was detected as the major isomer in vivo, and the level of α-OH-Acr-dG was often too low to be detected or quantified [14, 15]. Recently, a liquid chromatography-electrospray ionization-tandem mass spectrometry method was recently developed [18]. It is reported that the γ-OH-Acr-dG adduct is biologically important in the formation of DNA-DNA, DNA-peptide and DNA-protein cross-links [19], whereas α-OH-Acr-dG does not form these cross-linked species, probably due to its inability to undergo ring-opening [20]. A previous study showed that α-OH-Acr-dG is more mutagenic and genotoxic than γ-OH-Acr-dG [21]. However another study showed that in COS-7 cells, frequency and spectrum of mutations of α-OH-Acr-dG were nearly identical to that of γ-OH-Acr-dG [20]. The biological significance of Acr-dG adducts is further supported by a recent study showing that they preferentially formed at certain sites of the p53 gene of human lung cells treated with Acr and these sites coincide with the mutational hotspots of the p53 gene found in human lung cancer [22]. These results, together, emphasize that the quantitative detection of Acr-dG adducts in target tissue would provide a useful and relevant dosimeter for risk assessment.
Scheme 1.

Structures of stereoisomers of Acr-dG (A) and the ring-opened derivative of γ-OH-Acr-dG (B).
Until recently, the 32P-postlabeling/HPLC method was the only method for detecting Acr-dG in vivo. In this method, the detection and quantification of Acr-dG in tissue DNA was confirmed by converting to the ring-opened derivative (Scheme 1B). The LC/MS-MS method developed for Acr-dG [18, 23] is more efficient and quantitative; however, the sensitivity is lower than that of the 32P-postlabeling method. As a result, larger quantities of tissue DNA are usually needed in this method compared with the 32P-postlabeling method. The 32P-postlabeling/HPLC method is arguably the most sensitive method for the detection of Acr-dG; however, it is compromised by its low recovery and relatively large variability due to the multi-step nature of the assay and poor separation of Acr-dG from the unmodified dG at the 3′-monophosphate level in the DNA digest during the enrichment step. In this study, we developed a more quantitative 32P-postlabeling method for detecting γ-OH-Acr-dG in vivo. Using this method, we discovered that Acr-dG can be formed as an artifact during the assay and it was also detected as a pre-existing contaminant in dG and dT 3′-monophosphates from commercial sources. We obtained evidence that a trace amount Acr in the water used in the assay is likely to be responsible for the artifact formation. The artifact formation of Acr-dG that interferes with the assay can be effectively prevented by adding glutathione (GSH) to the DNA samples to be analyzed.
Materials and methods
Chemicals
Acr, micrococcal nuclease, dG, dG 3′-monophosphate, 2-deoxyadenosine 3′-monophosphate, 2-deoxycytidine 3′-monophosphate, thymidine 3′-monophosphate were obtained from Sigma-Aldrich Co. (ST. Louis, MO), Acr-dG 3′- or 5′-monophosphate was prepared as previously described, and the identities of these standards were established by their UV spectra and mass spectroscopy [13]. Spleen phosphodiesterase was from Worthington Biochemical (Lakewood, NJ), nuclease P1 was from Yamasa Shoyu Co. (Choshi, Japan), and [γ-32P]-ATP and T4 polynucleotide kinase (T4 PNK) were from Amersham (Piscataway, NJ). GSH, Calf thymus DNA and other reagents were from Sigma-Aldrich Co. and Fisher Chemical (Fair Lawn, NJ).
HPLC systems
HPLC analysis was performed using four systems: System 1 is a Shimadzu HPLC system with a SPD-M10A VP photodiode array detector (Kyoto, Japan) using a C18 reverse-phase column (Gemini, 5u, 110A, 5 μm, 250 mm × 4.6 mm) from Phenomenex (Torrance, CA, USA). The solvent systems used were: A) 5mM sodium citrate (pH 6.9) and B) methanol/water 50:50 with 0→30% B for 40 minutes at 0.6 ml/min. System 2 is an Agilent 1100 HPLC system with a G1315B photodiode array detector (Palo Alto, CA, USA) using a C18 reverse-phase column (Gemini, 5u, 110A, 5 μm, 250 mm × 4.6 mm). The solvent systems were: A) 50mM triethylamine phosphate (pH 6.4) and B) methanol/water 50:50 with 0→40% B for 40 minutes at 0.6 ml/min. System 3 is a Waters HPLC system with dual UV for on-line radioactivity monitoring; a β-Ram radio-flow detector (IN/US systems, Inc., Fairfield, NJ, USA) was used with mixing scintillation cocktail at a flow rate of 0.6 ml/min using a C18 reverse-phase column (Gemini, 5u, 110A, 5 μm, 250 mm × 4.6 mm). The solvent systems were: A) 5 mM sodium citrate (pH 5) and B) methanol/water 50:50 with 0→50% B in 50 minutes at 0.6 ml/min. System 4 is a Waters HPLC system with dual UV for on-line radioactivity monitoring by a β-Ram radio-flow detector (IN/US systems, Inc., Fairfield, NJ, USA), used with mixing scintillation cocktail at a flow rate of 0.6 ml/min using a SAX ion exchange column (Phenosphere, 5u, 80A, 5 μm, 250 mm × 4.6 mm) from Phenomenex; the solvent system was 100% (NH4)2HPO4 (pH 6) at 0.6 ml/min.
A32P-postlabeling/SPE/HPLC method
The method is outlined in Scheme 2. One to 100 μg of DNA was incubated at 37°C for 3.5 h with 100 μl digestion mixture containing 0.2 unit/μg micrococcal nuclease, 0.001 unit/μg spleen phosphodiesterase, 5 mM CaCl2 and 15 mM sodium succinate (pH 6.0) in the presence of 0.5 mM GSH. After digestion, a small portion of the digest (5 μl) was used for quantifying dG 3′P using HPLC System 1. The remaining solution (95 μl) was used for analysis of Acr-dG. The SPE column (C18, 200 mg, 1 ml volume; Varian, Harbor City, CA) was preconditioned with 2 ml 100% methanol followed by 1 ml deionized water (dH2O) and 1 ml of 2% methanol in 5 mM ammonium formate, pH 3.5. After the sample was loaded onto the SPE column (SPE-1), it was washed with 1.7 ml of 5 mM ammonium formate (pH 3.5) containing 2% methanol to remove most of the unmodified nucleotides, and Acr-dG 3′P was eluted with 0.7 ml of 30% methanol in water and collected in 1.5ml eppendorf tubes containing 70 nmole of GSH for a final 0.1 mM solution. The eluted adduct fraction was dried in a SpeedVac at room temperature overnight. Nuclease P1 (40 μl mixture containing 10 unit nuclease P1, 0.05 mM zinc chloride, 30 mM sodium acetate, pH 5.0) was added to hydrolyze residual unmodified nucleotides in the collected fraction. The mixture was vortexed and incubated at 37°C for 1 h followed by drying in a SpeedVac at room temperature for 1 h. The Acr-dG 3′P was then converted to 32P-labeled Acr-dG 5′P by adding 3 μl of T4 PNK (30 unit/ μl pH 7.6), 3 μl of T4 PNK dilution buffer, 4 μl of T4 PNK 10× buffer, 1 μl of [γ- 32P]ATP (10 μCi/μl) and 29 μl dH2O at 37°C for 45 min. After labeling, the 32P-labeled Acr-dG 5′P was separated from the rest of the mixture by SPE-2 as follows: dH2O (60 μl) was added to the 32P-labeled mixture and loaded onto a preconditioned SPE column (2 ml 100% methanol, 1 ml dH2O and 1 ml 5 mM sodium citrate, pH 6). The column was then washed with 1.5 ml sodium citrate (5 mM, pH 6) and eluted with 1 ml 15% methanol in sodium citrate (5 mM, pH 6). The adduct fraction from the SPE-2 step was then dried in a SpeedVac at room temperature for 1 h. Then it was spiked with the Acr-dG 5′P as UV marker and purified with reverse-phase HPLC System 1, followed by HPLC System 2. After drying the collected fraction containing Acr-dG 5′P to 200 μl, it was treated with 20 μl 10 M NaOH and 5 mg of sodium borohydride crystals at room temperature for 10 min to yield the ring-opened derivative (Scheme 1B) and then neutralized by 20 μl of 3.3 M H3PO4. For final analysis of the 32P-labeled Acr-dG 5′P, HPLC System 3 was used. For the analysis of each set of samples, a standard (Acr-dG 3′P; 10 fmole), a negative control (unmodified nucleotides; dG, dC, dA and dT each 25 nmole), and a water blank were included.
Scheme 2.
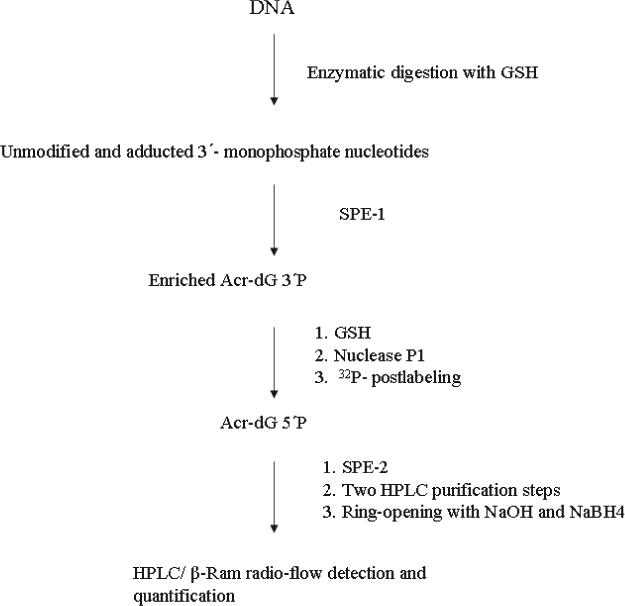
Outline of the quantitative 32P-postlabeling/SPE/HPLC method.
Removing pre-existing Acr-dG 3′P in negative control samples
In order to remove Acr-dG 3′P in the negative control samples, SPE-1 (see above) was used to separate Acr-dG 3′P from the unmodified nucleotides. The unmodified nucleotides were present in the washing fraction (1.7 ml of 5 mM ammonium formate containing 2% methanol), and Acr-dG 3′P was in the elution fraction (0.7 ml 30% methanol in water). To confirm that the washing fractions contained only the unmodified nucleotides and were free of Acr-dG 3′P, they were dried, dissolved in 100 μl dH2O and then analyzed by the method described above.
Blocking artifact formation of Acr-dG 3′P by GSH
To show the effect of adding GSH on Acr-dG formation, reaction mixture of 0.5 mM dG with different amounts of GSH (0, 0.1, 0.2, 0.3, 0.4 and 0.5mM) and 0.5 mM Acr in phosphate buffer pH 7.4, were incubated for 18 h at 37°C. The effect of adding GSH on Acr-dG 3′P artifact formation in the assay with DNA (10μg) and dG 3′P (25 nmole) samples was investigated. GSH was added to the samples at the DNA digestion step and again at the elution (SPE-1) step. DNA digestion mixture (100 μl), containing different amounts of GSH (0, 0.5, 1, 2 and 4 mM), and the SPE-1 eluting fraction (700 μl), containing 0, 0.1 and 0.2 mM GSH, were used. Samples were then analyzed by the method described above. To determine whether the addition of GSH affects 32P-postlabeling efficiency, samples containing 5 fmole of Acr-dG 3′P were labeled in the presence of different amounts of GSH (0, 0.1 and 1mM).
Validation of the assay with Acr-dG standard and DNA samples
The method was validated with Acr-dG standard, calf thymus DNA and DNA from human colon cancer cells (HT29 cell line). The detection limit, linearity and recovery were determined. Acr-dG standard of different quantities (1, 5, 10, 20 and 100 fmole) were analyzed. To detect Acr-dG 3′P in DNA, different amounts of calf thymus DNA (1, 5, 10, 25 and 50 μg) and DNA isolated from human colon HT29 cells (25, 50, 65, 85 and 100 μg) were analyzed. To determine intra-assay variability, each sample was analyzed at least in triplicate.
Mass Spectrometry
Electrospray ionization mass spectrometry (ESI MS) and ESI MS/MS were carried out using a QSATR Elite mass spectrometer (Applied Biosystems / MDS Sciex, Foster City, CA, USA) equipped with a NanoSpray II source head and syringe pump for direct infusion experiments. Experiments were performed using the positive ion mode with ion source gas pressure 1 psi, ion spray voltage of 2.20 kV and a solvent flow rate of 1 μl/min. All samples were dissolved in 1:1 mixture of acetonitrile and water, containing 1% of formic acid used as a standard mobile phase for all experiments. For both TOF MS and MS-MS scans the mass range from 50 to 500 m/z was monitored.
(i) Preparation of Acr-GSH conjugate standard for MS
The standard of Acr-GSH conjugate was prepared by mixing 1 mmol of Acr with 1.05 mmol of GSH in 10 ml of water. After 2 h, the sample was sequentially diluted 100,000 times by pipetting 10 μl of reaction mixture into 1ml of water, and then by taking 10μl of the resultant solution to 1ml of water. Before analysis by mass spectrometry, 100 μl of this mixture was diluted with 900 μl of 1:1 mixture of acetonitrile and water containing 1% of formic acid. TOF-MS spectrum was scanned from m/z 50 to 500 over 1 s, and then the scan was repeated 60 times (1 min total time). For the MS-MS experiment, product scan ion mode was used to search the fragmentation products of ion with m/z 364.1 Da. Collision energy (CE) was adjusted to 20 eV and collision gas (CAD) to 5 (arbitrary units). Spectrum was scanned from m/z 50 to 500 over 1 s, and then the scan was repeated 60 times (1 min total time).
(ii) Trapping Acr in water by GSH and detection by MS
Ten ml of 10 μM solution of GSH in water was allowed to stand in a closed vial for 2 h, and then the solution was evaporated using a Savant SpeedVac concentrator. The residue was reconstituted in 10 ml of water and was again left in a closed vial at room temperature for 2 h; the sample was then evaporated again. The procedure was repeated eight more times, and a total of 100 ml of water was used for trapping Acr in water by GSH. After the last cycle, the sample was dried and dissolved in 500 μl of 1:1 mixture of acetonitrile and water containing 1% of formic acid. TOF-MS spectrum was scanned from m/z 50 to 500 over 1 s, and then the scan was repeated 120 times (2 min total time). For the MS-MS experiment, the product scan ion mode was used to search the fragmentation products of ion with m/z 364.1 Da. Collision energy (CE) was adjusted to 20 eV and collision gas (CAD) to 5 (arbitrary units). Spectrum was scanned in MCA (multiple channel averaging) mode from m/z 50 to 500 over 1 s, and then the scan was repeated 120 times (2 min total time).
Results and Discussion
A quantitative 32P-postlabeling/SPE/HPLC assay for Acr-dG
Previously, we reported a SPE/HPLC-based 32P-postlabeling assay to detect different cyclic 1,N2-propanodeoxyguanosine adducts [24]. While it is highly sensitive, capable of detecting 0.5 fmole in 80 μg DNA (9 adducts /109 dG), it suffers from a significant assay variability. This problem is largely due to the poor separation of Acr-dG adducts and the unmodified nucleotide 3′-monophosphates before labeling, resulting in inefficient labeling and low recovery. The assay variability limited its application as a dosimeter for risk assessment studies in tissues from rodents and humans. It is, therefore, important to develop an assay with better quantitative characteristics.
In this study, we developed an assay with more efficient recovery and quantification by three approaches. First, we optimized the SPE-1 conditions for the separation of the 3′-monophosphates of Acr-dG from the unmodified nucleotides before labeling. Second, we developed a 32P-postlabeling condition that yields, instead of the 3′, 5′-bisphosphates, the 5′-monophosphates of Acr-dG for better HPLC separation after labeling. Finally, we added GSH to the DNA digestion mixture and the fraction eluted from SPE-1 to prevent artifact formation of Acr-dG adducts.
Using the previous method, the adduct levels in DNA were underestimated, because the recovery of adducts in DNA samples was invariably lower than that of a positive control sample containing only adduct standards without the unmodified nucleotides. It has been shown that even subnanomole quantities of the unmodified nucleotides can interfere with the 32P-labeling of adducts [24]. Therefore, SPE-1 is an important step to remove the unmodified nucleotides in DNA digest before labeling. To develop an optimal SPE-1 separation, several buffers, such as sodium citrate and ammonium formate with different concentrations and pH, were tested as washing solvents using the synthetic UV standards of Acr-dG. The results in Table 1 show that 5 mM ammonium formate (pH 3.5), containing 2% methanol, provided the best separation. The best elution solvent was 30% methanol in H2O, because inorganic salts in buffer could interfere with labeling efficiency. For example, using 1 ml of 5 mM sodium citrate would result in a labeling mixture with 125 mM of the salt after reducing its volume to 40 μl. At this concentration, the labeling efficiency was found to be 32 times less than that in only water.
Table 1.
The percentage recovery of the unmodified and Acr-dG (synthetic UV standard) in the SPE-1 step using different buffers
| |
|
|
% recovery |
|
|---|---|---|---|---|
| Buffer |
Fraction (buffer volume) |
dG |
dA |
Ac-dG |
| 5 mM sodium citrate (pH 7.2) | 1st Wash (1 ml) | 69 | 0 | 0 |
| 2nd Wash (2 ml with 5% MeOH) | 31 | 83 | 26 | |
| |
Final Elution (1 ml with 5% MeOH) |
0 |
9 |
69 |
| 5 mM ammonium formate (pH 6) | 1st Wash (2 ml) | 100 | 74 | 0 |
| 2nd Wash (0.25 ml) | 0 | 21 | 5 | |
| |
Final Elution (1.25 ml with 5% MeOH) |
0 |
5 |
95 |
| 5 mM ammonium formate (pH 3.5) | 1st Wash (1 ml with 2% MeOH) | 87 | 0 | 0 |
| 2nd Wash (0.7 ml with 2% MeOH) | 13 | 100 | 0 | |
| Final Elution (0.7 ml dH2O with 30% MeOH) | 0 | 0 | 100 | |
To enrich the adduct in the eluted fraction after SPE-1 for 32P-labeling, nuclease P1 was used to hydrolyze the residual unmodified deoxynucleoside 3′-monophosphates to the deoxynucleosides. In the previous assay, Acr-dG 3′, 5′-bisphosphate (3′, 5′-bP) was analyzed as the final product. However, because of its polarity, it is poorly separated from ATP by SPE-2 after labeling. In the current assay, the labeled 3′, 5′-bP of Acr-dG was converted to Acr-dG 5′P as the final product. The large polarity difference between Acr-dG 5′P and ATP presents a significant advantage for purification before HPLC analysis. In addition to catalyzing the transfer of Pi from ATP to the 5′-hydroxyl terminus of nucleoside 3′-monophosphates, T4 PNK is also known to catalyze the removal of 3′-phosphoryl groups [25]. Therefore, reaction of T4 PNK with [γ-32P] ATP can not only add 5-phosphate to Acr-dG 3′P, yielding Acr-dG 3′, 5′-bP, but also remove the 3-phosphate from Acr-dG 3′P and Acr-dG 3′, 5′P to form Acr-dG and Acr-dG 5′P, respectively. Taking advantage of these activities, we developed an optimal condition that allows the conversion of Acr-dG 3′, 5′P to its 5′-monophosphate as the final product. Several conditions were tested with varying amounts of T4 PNK and time for labeling. It was determined that 90 units of T4 PNK for 45 min at 37°C gave the best yield of Acr-dG 5′P. We used an additional ion-exchange HPLC system (system 4) to confirm that the identity of the radioactive peak by comigration with the synthetic UV standard. Because the ring-opening reaction is unique for γ-OH-Acr-dG, the comigration of its ring-opened derivative with the synthetic UV standard provided unequivocal structural confirmation. Figure 1 shows typical HPLC chromatograms obtained from the analysis of a standard and a DNA sample with the detection of the ring-opened Acr-dG 5′P.
Fig. 1.
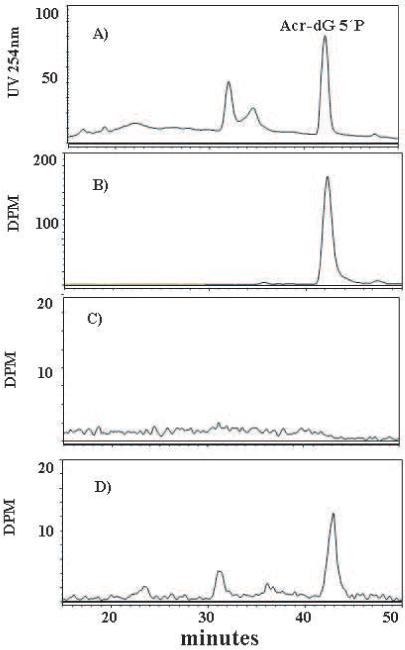
Detection of the ring-opened Acr-dG 5′P in different samples by HPLC: The UV standard (A); the radio-labeled adduct standard (B); the blank (dH2O) sample (C); and the radio-labeled adduct from calf thymus DNA (D).
Detection and quantification of Acr-dG in calf thymus DNA and DNA from human colon HT29 cells
The method was validated by generating a standard curve using different amounts of Acr-dG 3′P standard (Figure 2A). The limit of detection in DNA samples was as low as 0.1 fmole. The average recovery of this assay was 13.6% (Table 2), approximately three times greater than the previously reported method. This method was then applied to detect and quantify Acr-dG in calf thymus DNA and DNA from human colon HT29 cells. The levels of Acr-dG in these samples were determined to be 227 ± 22 adducts /109 dG and 13.9 ± 0.9 adducts/109 dG, respectively, with less than 10% of intra-assay variability. Figures 2B and 2C show the linearity of the assay using different amounts of DNA (1−50 μg for calf thymus and 25−100 μg for HT29 cells). Because of the low levels of adduct in HT29 cells, we could not detect the adduct using less than 25 μg of DNA, whereas only 1 μg calf thymus DNA was needed to detect Acr-dG.
Fig. 2.
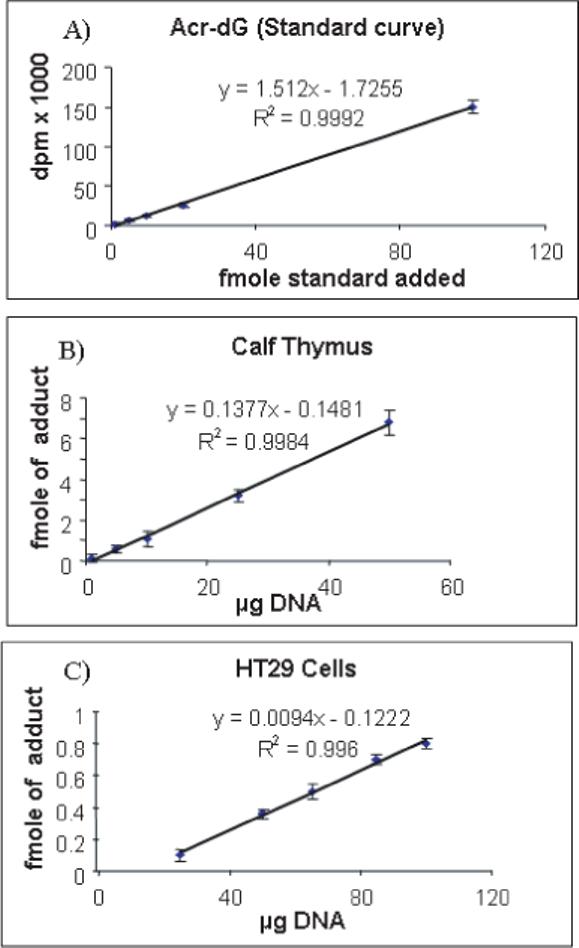
A standard curve obtained by using different amounts of Acr-G 3′P standard (A); linear relationships of Acr-dG detected in different amounts of calf thymus DNA (B); and DNA from HT29 cells (C). All data points were determined based on triplicate analyses.
Table 2.
The percentage recovery of different amounts of Acr-dG 3′P
| Standard AdG 3′P (fmole) | % recovery |
|---|---|
| 100 | 17.7 ± 1.0 |
| 20 | 13.2 ± 1.2 |
| 10 | 12.3 ± 1.8 |
| 5 | 13.0 ± 0.6 |
| 1 | 11.6 ± 1.2 |
Average of recovery is 13.6%, n=3, %C.V. < 15
Detection of Acr-dG as an artifact in the assay and a pre-existing contaminant in commercial dG 3′P and dT 3′P samples
During the development of the method, we made two unexpected observations. First, we identified Acr-dG 3′P as a contaminant in dG 3′P and dT 3′P from commercial sources. Second, we detected it as an artifact in two steps during the assay. To ensure the Acr-dG that we detected was indeed originating from DNA, a sample consisting of all four unmodified deoxynucleoside 3′-monophosphates was included in each assay as a negative control (see Methods and Materials). Surprisingly, we detected 3.0 and 3.3 fmoles of Acr-dG 3′P in 25 nmole of dG 3′P and dT 3′P, respectively. However, no Acr-dG 3′P was detected in dA 3′P, dC 3′P and blank (H2O) samples. Two possible sources could account for the detection of Acr-dG in these samples; one is that Acr-dG is formed during production of dG 3′P and dT 3′P as commercial products, and the other is that it is formed as an artifact in the assay. Acr can conjugate quantitatively with GSH forming a stable 3-oxopropyl glutathione, a thioether [26]. As expected from this reaction, we found that addition of GSH (0, 0.1, 0.2, 0.3, 0.4 and 0.5 mM) can stoichiometrically block the formation of Acr-dG in the reaction of 0.5 mM Acr with 0.5 mM dG; thus, a complete block of Acr-dG formation was observed at 0.5 mM GSH (Fig. 3A). A trace amount of Acr could be present in the water used in the assay, as Acr is a ubiquitous environmental pollutant. To examine the latter possibility, we added GSH to the DNA digestion mixture and to the fraction eluted from SPE-1, because free dG 3′P that could react with Acr is present in the samples of these two steps during the assay. Our results showed that addition of GSH decreased the amount of Acr-dG detected in the samples. The amount was reduced from 3.0 fmole to 1.1 fmole upon addition of 0.5 mM GSH to the samples containing dG 3′P. However, increasing the amount of GSH (1, 2 and 4 mM) in 25 nmole of dG 3′P did not further decrease the Acr-dG detected in the samples. These results show that Acr-dG is formed as an artifact in the assay and the artifact formation can be blocked by GSH. The observation that GSH did not completely block the Acr-dG formation, therefore, support that there is pre-existing Acr-dG 3′P in the dG 3′P used in the negative control sample. In order to prepare a negative control sample free of Acr-dG contaminant, SPE-1 was used to remove Acr-dG 3′P from dG 3′P and dT 3′P samples as described above. Using the purified negative control samples, we detected, as expected, only 0.1 fmole of Acr-dG 3′P in 25 nmole of dT 3′P. However, the amount of Acr-dG detected in dG 3′P sample was increased to 7.5 fmole. These results further confirm that there was artifact formation of Acr-dG 3′P from dG 3′P during the assay steps.
Fig. 3.
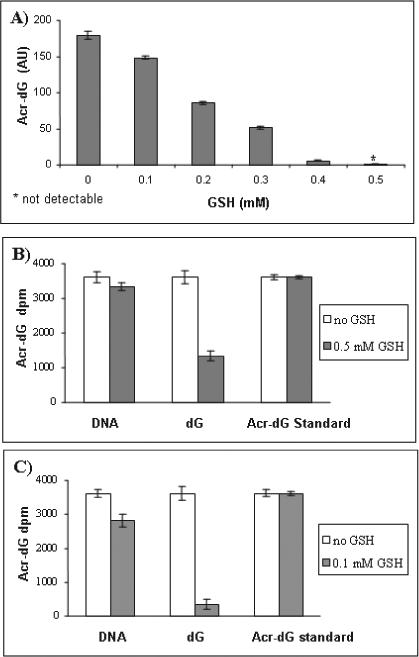
GSH blocked Acr-dG formation in a reaction of dG and Acr in a dose-dependent manner (A). Acr-dG artifact formation was significantly suppressed by adding GSH (0.5mM) to the DNA digestion mixture containing dG 3′P, but not with DNA or Acr-dG standard (B) and adding GSH (0.1mM) to the SPE-1 eluting fraction suppressed significantly the Acr-dG artifact formation with DNA and dG 3′P, but not with Acr-dG standard sample(C).
Presence of trace amount of Acr in water used in the assay detected as Acr-GSH conjugate by mass spectrometry
A possible source of artifact formation of Acr-dG is the presence of trace amount of Acr in the water prepared from the ion exchange filtration system (Millipore) used in the assay. The presence of Acr in water was confirmed by trapping it with GSH and detecting the Acr-GSH conjugate by mass spectrometry. The mass chromatogram of the reaction shows a peak with m/z 364.1192 Da, corresponding to the protonated [M+H]+ Acr-GSH adduct (Fig. 4). This ion was not present either in water used for the reaction without GSH or in the mobile phase used for mass spectrometry.
Fig. 4.

TOF-MS mass chromatogram showing a molecular ion at m/z 364.1192 of the Acr-GSH in the reaction mixture of Acr trapped by GSH in the water used in our assay.
The structure of the trapped Acr-GSH conjugate was further confirmed by a CID MS-MS experiment. The fragmentation pattern matches with that of the standard (Fig. 5A and B). Some of the characteristic fragments are as follow; The b series ions: b1, b2, and b2° (b2 after neutral loss of water) are clearly visible. In y series the y2 ion is barely present in favor of the formation of y2°. It was reported that this ion is formed by neutral loss of water during cyclization of y2 fragment, which is a very unique and predominant fragmentation mechanism of Acr-GSH conjugate [27]. However, this fragment can be also interpreted as an isobaric internal double backbone cleavage fragment C(Acr)G. Also, other fragments that are unique for Acr-GSH cysteinyl backbone cleavage, g, h, and r were observed (Fig. 4A) [27]. We also noticed the presence of the satellite ions z2r and y2r, which are derived from z2 and y2 fragments after additional cleavage of Acr moiety from cysteine side chain. The fragmentation pattern for Acr-GSH in the reaction mixture shared several common ions with the fragments of the standard, although the mass chromatogram also showed a number of additional peaks that are probably derived from the fragmentation of the interfering ion at m/z 363.2407 Da. The level of Acr in water was estimated based on the result from the 32P-postlabeling assay. As describe above, 7.5 fmole Acr (420.48 fg) was detected in 1.7 ml of water. Therefore, the minimal concentration of Acr is calculated to be as low as 0.247×10⁻³ ppb in the water based on a quantitative reaction between Acr and dG 3′P.
Fig. 5.
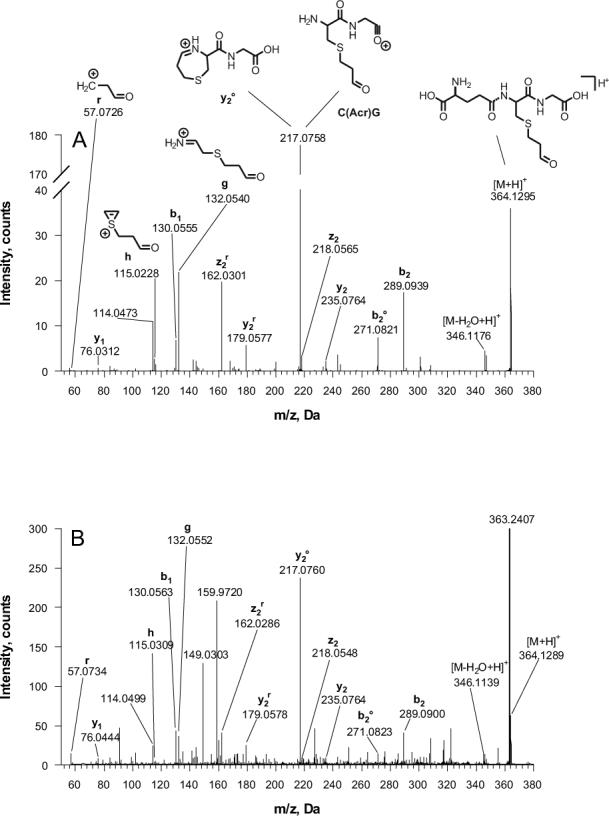
CID mass chromatograms for Acr-GSH standard (A) and mixture from Acr trapping reaction (B).
Reducing the artifact formation of Acr-dG by GSH
To prevent the artifact formation of Acr-dG, GSH was added in two assay steps; First, before enzymatic digestion of DNA and then immediately after the SPE-1 purification step. To investigate the effect of adding GSH in these two steps, we compared the results with and without GSH. Figure 3B shows that the formation of Acr-dG as an artifact was significantly suppressed by adding GSH (0.5 mM) to a DNA digestion mixture containing dG 3′P, but not to DNA or Acr-dG standards. This indicates that the presence of free dG 3′P in the mixture is a prerequisite for Acr-dG formation. After SPE-1, GSH is washed out and the elution fraction does not contain GSH; however a small amount of free dG 3′P may remain, therefore, more GSH was added. Figure 3C shows adding GSH (0.1mM) blocked the formation of Acr-dG in both DNA and dG 3′P samples, but not the standard of Acr-dG. The greater effect of GSH on artifact formation in the SPE-1 step than the digestion step may be explained by the fact that the water volume in the SPE-1 elution fraction (0.7 ml) is larger than the digestion mixture (0.1 ml). We found that GSH up to 1mM does not affect 32P-postlabeling efficiency. To ensure that the release of Acr is not from the SPE-1 column, we pretreated the SPE column with different amounts of GSH. The results showed no significant change in the artifact formation.
Acknowledgment
We thank the proteomics and mass spectrometry shared resource of the Lombardi Cancer Center for the mass spectrometry and Ms. Karen Howenstein for assistance in preparing the manuscript. We also thank Dr. Jim Zhang at the Department of Environmental Occupational Health Science of Rutgers University for helpful discussion. This work was supported by the NCI grant CA 043159.
Abbreviations
- Acr
acrolein
- dG
deoxyguanosine
- dC
deoxycytidine
- dT
thymidine
- dA
deoxyadenosine
- GSH
glutathione
- T4 PNK
T4 polynucleotide kinase
- SPE
solid phase extraction
- HPLC
high performance liquid chromatography
Footnotes
Publisher's Disclaimer: This is a PDF file of an unedited manuscript that has been accepted for publication. As a service to our customers we are providing this early version of the manuscript. The manuscript will undergo copyediting, typesetting, and review of the resulting proof before it is published in its final citable form. Please note that during the production process errors may be discovered which could affect the content, and all legal disclaimers that apply to the journal pertain.
References
- 1.IARC . Evaluation of the carcinogenic risk of chemicals to humans, allyl compounds, aldehydes, epoxides and peroxides. IARC; Lyon, France: 1995. [Google Scholar]
- 2.Grosjean D. Atmospheric chemistry of toxic contaminations. 3. Unsaturated aliphatics: Acr, acrylonitrile, maleic anhydride. J. Air Waste Management Association. 1990;40:1664–1668. [Google Scholar]
- 3.Auto/Oil Air Quality Improvement Research Program . Final Report of the Auto/Oil Air Quality Improvement Research Program. Coordinating Research Council; Atlanta, GA: 1997. [Google Scholar]
- 4.Ligocki MP, Stiefer PA. Sources, Projected Emission Trends, and Exposure Issues for formaldehyde: Final Report to American Automobile Manufacturers Association. SYSAPP95−95/122. Systems application International.; San Rafael, CA: 1995. [Google Scholar]
- 5.IARC . Evaluation of the carcinogenic risk to humans. Drying cleaning, some chlorinated solvents and other industrial chemicals. IARC; Lyon, France: 1995. [PMC free article] [PubMed] [Google Scholar]
- 6.Harley RA, Gass GR. Modeling the concentrations of gas-phase toxic air pollutants: Direct emissions and atmospheric transformation. Environ Sci Technol. 1994;28:88–98. doi: 10.1021/es00050a013. [DOI] [PubMed] [Google Scholar]
- 7.IARC . Evaluation of the carcinogenic risk to humans. Wood dust and formaldehyde. IARC; Lyon, France: 1995. [Google Scholar]
- 8.World Health Organization (International Programme on Chemical Safety) Environmental Health Criteria 167: Acetaldehyde. World Health Organization; Geneva, Switzerland: 1995. [Google Scholar]
- 9.Shield PG, Xu GX, Blot WJ, Fraumeni JF, Trivers GE, Pellizzari ED, Qu YH, Gao YT, Harris CC. Mutagens from heated Chinese and U.S. cooking oils. J. Natl.Cancer Inst. 1995;87:836–841. doi: 10.1093/jnci/87.11.836. [DOI] [PubMed] [Google Scholar]
- 10.Esterbauer H. Aldehydic Products of Lipid Peroxidation. In: McBrien DGH, Slata TF, editors. Free Radicals, Lipid Peroxidation and cancer. Academic Press; London: 1982. pp. 101–128. [Google Scholar]
- 11.Chung F-L, Young R, Hecht SS. Formation of cyclic 1,N2-propanodeoxyguanosine adducts in DNA upon reaction with acrolein or crotonaldehyde. Cancer Res. 1984;44:990–995. [PubMed] [Google Scholar]
- 12.Singer B, Bartsch H. Exocyclic DNA adducts in Mutagenesis and Carcinogenesis. IARC Scientific Publications; 1999. pp. 46–54. [PubMed] [Google Scholar]
- 13.Nath RG, Chen HJ, Nishikawa A, Young-Sciame R, Chung F-L. A 32P-postlabeling method for simultaneous detection and quantification of exocyclic etheno and propano adducts in DNA. Carcinogenesis. 1994;15:979–984. doi: 10.1093/carcin/15.5.979. [DOI] [PubMed] [Google Scholar]
- 14.Nath RG, Chung F-L. Detection of exocyclic 1,N2-propanodeoxyguanosine adducts as common DNA lesions in rodents and humans. Proc Natl Acad Sci U S A. 1994;91:7491–7495. doi: 10.1073/pnas.91.16.7491. [DOI] [PMC free article] [PubMed] [Google Scholar]
- 15.Nath RG, Ocando JE, Chung F-L. Detection of 1, N2-propanodeoxyguanosine adducts as potential endogenous DNA lesions in rodent and human tissues. Cancer Res. 1996;56:452–456. [PubMed] [Google Scholar]
- 16.Nath RG, Ocando JE, Guttenplan JB, Chung F-L. 1, N2-propanodeoxyguanosine adducts: potential new biomarkers of smoking-induced DNA damage in human oral tissue. Cancer Res. 1998;58:581–584. [PubMed] [Google Scholar]
- 17.Penn A, Nath RG, Pan J, Chen L, Widmer K, Henk W, Chung F-L. 1,N2-Propanodeoxyguanosine Adduct Formation in Aortic DNA Following Inhalation of Acrolein. Environmental Health Perspectives. 2001;109:219–223. doi: 10.1289/ehp.01109219. [DOI] [PMC free article] [PubMed] [Google Scholar]
- 18.Zhang S, Villalta PW, Wang M, Hecht SS. Detection and quantitation of acrolein-derived 1,N2-propanodeoxyguanosine adducts in human lung by liquid chromatography-electrospray ionization-tandem mass spectrometry. Chem Res Toxicol. 2007;20:565–571. doi: 10.1021/tx700023z. [DOI] [PMC free article] [PubMed] [Google Scholar]
- 19.Kozekoy ID, Nechey LV, Moseley MS, Harris CM, Rizzo CJ, Stone MP, Harris TM. DNA interchain cross-links formed by acrolein and crotonaldehyde. J Am Chem Soc. 2003;125:50–61. doi: 10.1021/ja020778f. [DOI] [PubMed] [Google Scholar]
- 20.Sanchez AM, Minko IG, Kurtz AJ, Kanuri M, Moriya M, Lloyd RS. Comparative evaluation of the bioreactivity and mutagenic spectra of acrolein-derived alpha-HOPdG and gamma-HOPdG regioisomeric deoxyguanosine adducts. Chem Res Toxicol. 2003;16:1019–1028. doi: 10.1021/tx034066u. [DOI] [PubMed] [Google Scholar]
- 21.Yang I-Y, Chan G, Miller H, Huang Y, Torres MC, Johnson F, Moriya M. Mutagenesis by acrolein-derived propanodeoxyguanosine adducts in human cells. Biochemistry. 2002;41:13826–13832. doi: 10.1021/bi0264723. [DOI] [PubMed] [Google Scholar]
- 22.Feng Z, Hu W, Hu Y, Tang MS. Acrolein is a major cigarette-related lung cancer agent: Preferential binding at p53 mutational hotspots and inhibition of DNA repair. Proc Natl Acad Sci U S A. 2006;103:15404–15409. doi: 10.1073/pnas.0607031103. [DOI] [PMC free article] [PubMed] [Google Scholar]
- 23.Liu X, Lovell MA, Lynn BC. Development of a method for quantification of acrolein-deoxyguanosine adducts in DNA using isotope dilution-capillary LC/MS/MS and its application to human brain tissue. Anal Chem. 2005;77:5982–5989. doi: 10.1021/ac050624t. [DOI] [PubMed] [Google Scholar]
- 24.Pan J, Davis W, Trushin N, Amin S, Nath RG, Jr., Salem N. A solid-phase extraction/high-performance liquid chromatography-based (32) P-postlabeling method for detection of cyclic 1, N (2)-propanodeoxyguanosine adducts derived from enals. Anal Biochem. 2006;348:15–23. doi: 10.1016/j.ab.2005.10.011. [DOI] [PubMed] [Google Scholar]
- 25.Cameron V, Uhlenbeck OC. 3'-Phosphatase activity in T4 polynucleotide kinase. Biochemistry. 1977;16:5120–5126. doi: 10.1021/bi00642a027. [DOI] [PubMed] [Google Scholar]
- 26.Tacka KA, Dabrowiak JC, Goodisman J. AK Souid, Kinetic analysis of the reactions of 4-hydroperoxycyclophosphamide and acrolein with glutathione, mesna, and WR-1065. Drug Metab Dispos. 2002;30:875–882. doi: 10.1124/dmd.30.8.875. [DOI] [PubMed] [Google Scholar]
- 27.Obert CH, Jones AD. Fragmentation of protonated thioether conjugates of acrolein using low collision energies. J. Am. Soc. Mass Spectrom. 1997;8:727–736. [Google Scholar]