Abstract
Previously, we showed that cellular glutathione/glutathione disulfide (GSH/GSSG) play an important role in apoptotic signaling, and early studies linked mitochondrial GSH (mtGSH) loss to enhanced cytotoxicity. The current study focuses on the contribution of mitochondrial GSH transport and mitochondrial GSH/GSSG status to apoptosis initiation in a non-transformed colonic epithelial cell line, NCM460, using menadione (MQ), a quinone with redox cycling bioreactivity as a model of oxidative challenge. Our results implicate the semiquinone radical in MQ-mediated apoptosis which was associated with marked oxidation of the mitochondrial soluble GSH and protein-bound thiol pools, mitochondria-to-cytosol translocation of cytochrome c and activation of caspase-9. MQinduced apoptosis was potentiated by inhibition of mtGSH uptake in accordance with exacerbated mitochondrial GSSG (mtGSSG) and protein-SSG, and compromised mitochondrial respiratory activity. Moreover, cell apoptosis was prevented by N-acetyl-L-cysteine (NAC) pretreatment which restored cellular redox homeostasis. Importantly, mtGSH transport inhibition effectively blocked NAC-mediated protection in accordance with its failure to attenuate mtGSSG. These results support the importance of mitochondrial GSH transport and the mtGSH status in oxidative cell killing.
Keywords: NCM460 cells, intestinal epithelial cells, apoptosis, redox imbalance, GSH/GSSG ratio, mitochondrial redox, menadione, mitochondrial GSH transporters
INTRODUCTION
The pathophysiological impact and the underlying mechanism(s) of oxidants on epithelial cell fate, such as apoptosis, are incompletely understood. Our recent studies in intestinal [1–4] and other cell types [5,6] have demonstrated that oxidant-induced loss of cellular GSH/GSSG redox balance is an important player in apoptotic signaling. A significant contributor to cellular redox control is the mitochondrion whose GSH/GSSG redox status is sensitive to oxidants [7]. The depletion of mitochondrial GSH (mtGSH) as occurs under various pathological states, including ethanol intake [8], cerebral ischemia [9], hypoxia [10], and chronic biliary obstruction [11] may therefore be a key event in sensitization of cells to oxidant-induced injury. Early studies have linked the loss of mtGSH to the cytotoxic effects induced by aromatic hydrocarbons [12], tert-butylhydroperoxide (tBH) [13], and ethanol [14]. Collectively, these findings implicate the mtGSH redox compartment in cell survival. Given the slow turnover [15] and thus, recovery of the mtGSH pool, we predict that a reduction in the mtGSH concentration could promote mitochondrial oxidative stress and induce colonocyte apoptosis [16].
Within cells, GSH is distributed mainly between cytosolic and mitochondrial compartments. The fraction of the total cellular GSH pool that is in mitochondria is cell type specific, but its concentration is generally similar to the cytosolic pool at about 5mM [17]. In renal proximal tubular cells, which have higher contents of mitochondria, have ~30% of total cellular GSH located in the mitochondria [18], while in hepatocytes, mitochondria comprise of ~10–15% of the total cellular GSH pool. At present, it is unclear what proportion of cellular GSH constitutes the mitochondrial pool in colonocytes. The mitochondria lack the enzymatic machinery for de novo GSH synthesis [19], and the maintenance of mtGSH relies on GSH uptake from the cytosol by carrier-mediated transport systems located in the inner membrane of the mitochondria [20]. In liver and kidney, the dicarboxylate (DIC) and 2-oxoglutarate (OGC) membrane carriers are two known mtGSH transporting proteins [21, 22]. Apart from recent evidence that the integrity of mtGSH uptake is critical in the protection of renal epithelial cells against drug-induced toxicity [23], the function of mtGSH transport in epithelial mitochondrial GSH/GSSG redox maintenance has not been fully explored and the role of mitochondrial redox in colonic epithelial susceptibility to oxidative challenge remains to be defined.
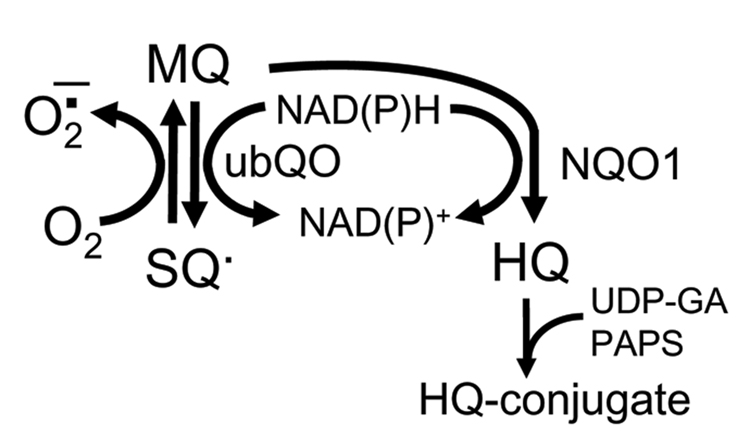
Quinones are a family of compounds widely distributed in nature which have important roles in cellular respiration. It is widely reported that the cytotoxicity of quinones such as menadione (2-methyl-1,4-naphtoquinone, MQ) resides in its redoxcycling capacity and/or its ability to arylate cellular nucleophiles such as DNA and proteins. MQ has been used previously as a vitamin K source clinically and in animal diets, but its use as a dietary supplement has since been limited due to its alkylating and thiol depleting properties; rather these properties are being considered for development of MQ as chemotherapeutics [24]. The mitochondrion has been implicated to be a major site for quinone redox-cycling [25] wherein one electron metabolism by mitochondrial NADPH-ubiquinone oxidoreductase forms the semiquinone radical (SQ−) which then participates in redox cycling through its reaction with O2 to yield the superoxide anion (O2−) [26,27] with concomitant regeneration of the quinone (Figure 1). The formation of the hydroquinone (HQ) through a two electron metabolism catalyzed by cytosolic DT diaphorase [NAD(P)H quinone oxidoreductase (NQO1)] functions in quinine detoxication via formation of HQ glucuronide or sulfate conjugates (Figure 1). Oxidation of mitochondrial pyridine nucleotides [28], depletion of cellular ATP [29], alteration of mitochondrial calcium homeostasis [30], and depolarization of mitochondrial membrane potential (ΔΨm) [31] have been demonstrated in association with quinone cytotoxicity in hepatocytes, suggesting mitochondrial participation in quinone redox cycling.
Figure 1. Metabolism of menadione (MQ).
MQ can undergo a one electron metabolism within the mitochondria catalyzed by mitochondrial ubiquinone oxidoreductase (ubQO) to form the semiquinone (SQ−) which then participates in redox cycling through its reaction with O2 to yield the superoxide anion (O2−), regenerating MQ. MQ can also undergo a two electron metabolism within the cytosol catalyzed by DT diaphorase [NAD(P)H quinone oxidoreductase (NQO1)] resulting in the formation of hydroquinone (HQ) which is detoxified as the glucuronide or sulfate conjugates.
The objective of this study is to determine the contribution of mitochondrial GSH transport and the mtGSH redox compartment to apoptosis initiation in a non-transformed NCM460 colon epithelial cell line during oxidative challenge. In our studies we have used MQ as the oxidant and have capitalized on the inhibitors of mtGSH transport, butylmalonate (BM) and phenylsuccinate (PS), respectively for DIC and OGC, [21] to manipulate mtGSH. Our results show that MQ induced NCM460 apoptosis that was correlated with increased mitochondrial GSSG (mtGSSG) and protein-SSG, as well as compromised mitochondrial respiratory activity. Significantly, cell apoptosis was exacerbated by inhibition of mtGSH uptake in association with exaggerated mtGSSG, thus supporting a role for mtGSH transport in the sensitivity of colonic epithelial cell to oxidative challenge.
MATERIALS AND METHODS
Materials
The following chemicals were obtained from Sigma Chemicals (St. Louis, MO, USA): menadione sodium bisulphite, N-acetyl-L-cysteine, 4’6-diamidino-2-phenylindole, paraformaldehyde, EDTA, EGTA, sucrose, DTT, 2,4-dinitrofluorobenzene, iodoacetic acid, glutathione (GSH and GSSG), 5,5’,6,6’-tetrachloro-1,1’,3,3’-tetraethylbenzamidazolocarbocyanin iodide (JC-1 dye), butylmalonic acid, phenylsuccinic acid. M3:10 media was acquired from INCELL Corporation (San Antonio, TX, USA). Polyclonal antibodies against cytochrome c were obtained from Santa Cruz Biotechnologies (Santa Cruz, CA, USA). Polyclonal caspase-9 antibody was acquired from Cell Signaling Technology (Danvers, MA, USA). The secondary anti-rabbit, antimouse IgG antibodies, and ECL Detection System were purchased from Amersham (Arlington Heights, IL, USA). Nitrocellulose membranes and protein dye assay kit were obtained from BIORAD Corporation (Hercules, CA, USA). Fluorescent mounting medium was purchased from Dako Corporation (Carpinteria, CA, USA).
Cell culture and incubation
NCM460 is an immortalized and nonmalignant human colonic epithelial cell line [32] that was generated by Dr. Mary Moyer, INCELL Corporation. The NCM460 cells were derived from the transverse colon of a human donor and exhibit similar characteristics as primary cultures of cells isolated from the same region [33]. The non-transformed colonocytes tested positive for the epithelial marker cytokeratin, the intestinal epithelial marker villin, the human secretory component and the colon-specific glycoprotein 5E113 [32]. Moreover, NCM460 cells exhibit transcripts for NHE-1 and NHE-2, but not NHE-3 isoforms [33].
NCM460 cells were cultured in M3:10 media in a 5% CO2/95% air humidified environment at 37°C. The culture medium was changed every 2 days and cells were plated at a specified density one day before experimentation. On the day of the experiment, the media was replaced with FBS- and phenol red-free Dulbecco’s Modified Eagle’s Medium (DMEM). Reagents, whenever present, were added at the following final concentrations: MQ, 50µM; N-acetyl-cysteine (NAC), 2mM; butylmalonate (BM), 20mM; phenylsuccinate (PS), 20mM; cyclosporine A, 1µM; and dicumarol, 0.1µM. MQ was chosen at a concentration that gave ~20% cell killing at 2h, while BM/PS were selected at concentrations that effectively inhibited mtGSH transport without cytotoxicity.
To determine the redox status in cytosolic and mitochondrial compartments, cells (2×10⁶/ml) in suspension were incubated at 37°C with 50µM MQ for different times in rotating round bottom flasks in a rotavap system as previously described [34]. In these latter experiments, pretreatment with 20mM BM/PS (1h) or with 2mM NAC (30min) were conducted in cells in T25 flasks (5×10⁶/ml) in FBS- and phenol red-free DMEM prior to trypsinization and resuspension at a final density of 2×10⁶/ml in Dulbecco phosphate buffered saline (DPBS).
Detection of apoptosis
Cell apoptosis was visualized and quantified by DAPI staining as we previously described [35]. Briefly, 4×10⁴ NCM460 cells were plated on 12mm circular cover slips in 24-well plates and incubated overnight at 37°C in 5% CO2. The next day, cells were exposed to 50µM MQ for 2h. In some wells, cells were pre-treated for 1h with 20mM BM and PS each or for 30min with 2mM NAC prior to MQ treatment. At the end of the experiment, cells were washed with PBS and fixed with 4% paraformaldehyde for 15min, and with 70% ethanol at −20°C for at least 1h. Cells were then stained with 1µg/ml DAPI for 30min in the dark, washed with PBS and mounted using DAKO fluorescent mounting fluid. Cells were viewed and counted using a fluorescent Olympus B450 microscope with the 20× objective. At least 6 fields of total and apoptotic cells were counted on each slide. As markers of apoptosis initiation, mitochondria-to-cytosolic translocation of cytochrome c and activation of caspase-9 were determined (see below).
Western analysis of cytochrome c and procaspase-9
Preparation of whole cell lysates
NCM460 cells (2×10⁶) were plated on T-25 flasks and exposed to 50µM MQ with or without pretreatment with 20mM BM and PS or 2 mM NAC. Cells were lysed with 500µl lysis buffer (300mM NaCl, 50mM Tris-HCl, 0.5% Triton X-100, 10µg/ml leupeptin, 10µg/ml aprotinin, 1mM PMSF, and 1mM dithiothreitol (DTT) for 30min at 4°C and homogenized. The homogenate was centrifuged at 10,000 rpm and the whole cell extracts were stored at −20°C until Western analyses were performed.
Preparation of cytosolic and mitochondrial extracts
Following various treatments (as above), NCM460 cells were trypsinized, harvested, washed and suspended in 20mM HEPES buffer containing 10mM KCl, 1.5mM MgCl2, 1mM EDTA, 1mM EGTA, 1mM DTT, 250mM sucrose and the protease inhibitors: 1mM PMSF, 10µg/ml aprotinin and 10µg/ml leupeptin. After 30min on ice, cells were disrupted by 30 up-and-down strokes in a dounce homogenizer and centrifuged for 10min at 750g to remove the nuclei. The supernatant was centrifuged at 10,000g for 15min and the mitochondrial pellet was collected and lysed with lysis buffer containing 100mM NaCl, 20mM Tris-HCl, 0.5% Triton X-100 (pH 7.4), and protease inhibitors. Both supernatant (cytosolic) and mitochondrial fractions were stored at −20°C until Western analyses were performed.
Western analyses
Expression of procaspase-9 was measured in whole cell lysates. Cytosolic and mitochondrial extracts were used to determine the expression of cytochrome c. Equal volumes of 2x sample buffer were added to the various lysates/extracts at the following protein content: whole cell, 20µg; cytosol, 50µg; and mitochondria, 20µg. Proteins were resolved on 12% acrylamide gels (100V, 90 min), and transferred to nitrocellulose membranes. The membranes were probed with the respective primary antibodies for cytochrome c (1:250); or procaspase-9 (1:1000), followed by the corresponding secondary antibodies that were conjugated to horseradish peroxidase (1:4000 for cytochrome c; 1:2000 for procaspase-9). Chemiluminescence detection was performed with an ECL Western blotting detection reagent according to manufacturer’s recommendation. Each membrane of the whole cell and cytosolic fractions was stripped (6.25mM Tris pH 6.7, 2% SDS, 100mM mercaptoethanol) and probed for β-actin to verify equal protein loading per lane.
Determination of GSH, GSSG, and protein disulfides (protein-SSG)
GSH and GSSG
Soluble GSH and GSSG were determined in trichloroacetic acid (TCA) supernatants by high-performance liquid chromatography (HPLC) as we previously described [5] as modified from Reed et al [36]. Samples were derivatized with 6mM iodoacetic acid and 1% 2,4-dintrofluorobenzene to yield the S-carboxymethyl and 2,4-dinitrophenyl derivatives, respectively. Separation of GSH and GSSG derivatives was performed on a 250mm×4.6mm Alltech Lichrosorb NH2 10micron column. Mitochondrial and cytosolic GSH/GSSG contents were determined in the respective compartments after separation by digitonin fractionation (see below).
Protein-SSG
Protein-bound disulfide (protein-SSG) was measured in TCA-insoluble proteins as we previously described [5]. The mitochondrial-insoluble proteins obtained after digitonin fractionation were dissolved in 0.1M NaOH and neutralized to pH 8. Samples were mixed with phosphate buffer (1.5mM KH2PO4, 6.36mM K2HPO4, 1.57mM EDTA) containing 2mM DTNB and incubated for 15min at room temperature. Total protein-SH and -SSG were determined colorimetrically at 410nm; protein-SSG was calculated from the difference of absorbance before and after addition of saturated Nethylmaleimide solution. Protein-SSG concentrations were expressed as nmol/mg protein.
Fractionation of cytosolic and mitochondrial compartments
The cytosolic and mitochondrial fractions were obtained using the digitonin fractionation method of Andersson and Jones [37]. Digitonin fractionation was performed in 1.5ml Eppendorf tubes containing, from the bottom: 100µl 10% TCA, 500µl of silicone oil/mineral oil mixture (4:1, v/v) and 100µl of digitonin solution (1.2mg/ml PBS). A 500µl aliquot of cell suspension was rapidly mixed with the digitonin top layer and then centrifuged at 10,000g for 5min. The supernatant was removed and the silicone-mineral oil mixture was aspirated. The supernatant and TCA layers were collected and stored at −80°C until analyses. Samples of these fractions, representing the cytosolic and mitochondrial compartments, respectively, were assayed for GSH and GSSG, and protein-SSG as described above. Purity of the mitochondrial and cytosolic compartments was validated by the specific organellar enzyme markers, glutamate dehydrogenase and lactate dehydrogenase.
Measurement of cellular ATP
Cellular ATP was determined using a luciferin/luciferase bioluminescence Promega kit (Promega). Briefly, 2×10⁴ NCM460 cells were seeded in 96-well plates and grown overnight. Next day, cells were pre-treated with 20mM BM/PS (1h), 2mM NAC (30min) or 1µM cyclosporine A (1h) and exposed to 50µM MQ for different times. At the end of the experiment, the media was removed and an equal volume of lysis buffer containing the luciferase reagent was added. After 20min incubation, the generation of the luminescent signal proportional to the ATP concentration was measured using a BMG-fluostar optima fluorimeter. Each experiment was run in triplicates and the ATP content is expressed as % inhibition relative to controls (i.e., 100%).
Determination of oxygen (O2) consumption
NCM460 cells (2×10⁶/ml) were placed in a thermostated closed vessel at 37°C and kept in suspension by a stirrer. O2 consumption was measured polarographically using a Clark-type O2 electrode (Yellow Spring Instruments, Yellow Springs, OH) as previously described [38]. MQ-induced O2 consumption was determined by addition of 50µM MQ into the cell suspension using a Hamilton syringe. The rate of mitochondrial O2 consumption was determined as the cyanide (CN)-sensitive rate following addition of 300µM NaCN. Results are expressed as nmol O2 consumed/ min per106cells.
Oxidation-reduction changes of mitochondrial cytochrome aa3
NCM460 cells from one confluent T75 flask were trypsinized and resuspended at 5×10⁶ cells/ml in modified Gey’s buffer containing DNase. Oxidation-reduction changes in mitochondrial cytochrome aa3 a measure of respiratory integrity was performed in the absence or presence of 50µM MQ by dual-wavelength spectrophotometry in an AMINCO DW-2000 spectrophotometer as previously described [38]. Cells were maintained in suspension (5-ml volume) by gentle stirring with a magnetic stirrer (1–2s mixing time), and solution O2 was measured using a Clark-type O2 electrode inserted through the cover of the incubation vessel. The electrode was calibrated with respect to air (20.9% O2). The gaseous phase of the vessel was flushed with prepurified argon and cells were allowed to become anaerobic. Known volumes of air-saturated or O2-saturated buffer were added using a Hamilton syringe to obtain the desired O2 concentrations in solutions. The oxidation-reduction changes of cytochrome aa3 from anaerobic-to-aerobic transition were measured at the wavelength pair 603–630nm, and determined as the P50 value of its O2 dependence, defined as the O2 concentration at half maximal oxidation.
Determination of mitochondrial membrane potential (ΔΨm)
The changes in ΔΨm were detected by flow cytometry using the fluorescent cationic carbocyanine dye, JC-1 [6,39]. In control cells, an intact ΔΨm allows JC-1, bearing a delocalized positive charge, to accumulate and aggregate in the mitochondrial matrix, where it fluoresces red. In apoptotic cells, the collapse of ΔΨm causes JC-1 to remain in the cytoplasm in a green fluorescent monomeric form. Thus, mitochondrial depolarization can be detected by a decrease in the red-to-green fluorescence intensity ratio, i.e., fluorescence emission shift from red (590nm) to green (525nm). Apoptotic cells, as characterized by decreased ΔΨm, exhibited low red-to-green fluorescence ratio. NCM460 cells were exposed to 50µ MQ without or with 2mM NAC or 1µM cyclosporine A for 15 and 30min. Thereafter, cells were collected and incubated with 5µg/ml of JC-1 at 37°C in a 5% CO2 incubator for 15min. After washing, cells were analyzed on a FACS Calibur flow cytometer (Becton Dickinson, San Jose, CA). As a positive control, cells were treated with 0.1µM FCCP and 0.1µM valinomycin for 4h to depolarize the ΔΨm. Under these conditions, greater than 90% of the cells exhibited collapsed ΔΨm, which was used to calibrate the flow cytometer.
Protein assay
Protein concentration was determined using Bio-Rad Protein Assay kit (Bio-Rad Laboratories, Hercules, CA, USA) according to the manufacturer’s protocol.
Statistical analysis
Results are expressed as mean ± SE. Data were analyzed using a one-way ANOVA with Bonferroni corrections for multiple comparisons. P values of <0.05 were considered statistically significant.
RESULTS
MQ-induced apoptosis in NCM460 cells is attenuated by NAC and exacerbated by dicumarol
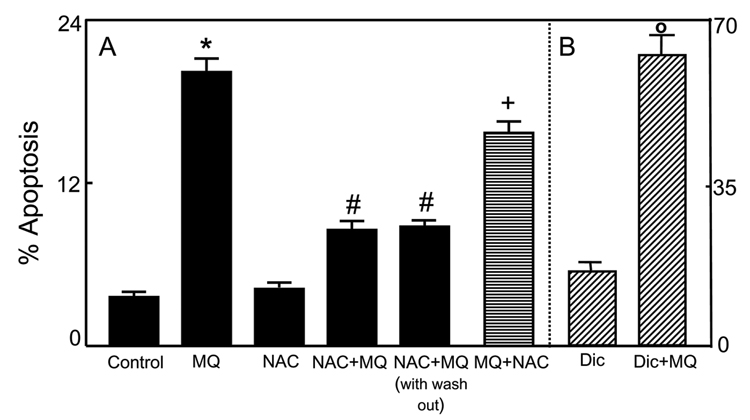
We initially exposed NCM460 cells to 50-200µM MQ and determined cell apoptosis after 2h; longer incubation time at 100–200µM MQ resulted in significant cell detachment. Figure 2A shows that at 50µM, MQ induced 20–22% NCM460 apoptosis without cell detachment, and this concentration was used in subsequent experiments to examine the role of intracellular redox in MQ-induced apoptosis. To determine whether cell apoptosis was associated with altered cellular redox status, we pretreated cells for 30min with 2mM NAC, a GSH synthesis precursor and ROS scavenger, prior to MQ exposure. NAC alone exerted little effect, but it significantly protected cells against MQ-induced apoptosis; interestingly, the protection was only partial. To assess if the cytoprotective effect of NAC was due to direct reaction with MQ in the media, NCM460 cells were first pretreated with 2mM NAC for 30min, then washed with PBS, and incubated with fresh media without NAC. Thereafter, cells were exposed to 50µM MQ for 2h. Under these conditions, MQ-induced apoptosis was significantly attenuated and to the same extent as that in the presence of NAC throughout the incubation (Figure 2A). In comparison, the addition of NAC at 30min post-MQ treatment failed to afford protection. These results indicate that the cytoprotective effect of NAC was unlikely to be due to a direct chemical reaction of NAC with MQ, and suggest that MQ-mediated apoptosis is associated with cellular redox imbalance, and that there is an early window of redox change (within 30min post-oxidant exposure) within which the apoptotic process is triggered. In this regard, MQ behaves like other thiol oxidants, such as tBH [6,40, 41], lipid hydroperoxide [1,2,4], and diamide [2,42].
Figure 2. MQ-induced apoptosis in NCM460 cells: Attenuation by exogenous NAC and potentiation by dicumarol.
A, NCM460 cells were treated for 2h with 50µM MQ without or with pre-treatment with 2mM NAC at 30min prior to (NAC+MQ) or at 30min after (MQ+NAC) MQ exposure. In some experiments, cells were pretreated with NAC followed by removal of the media and replaced by fresh NAC-free media (NAC+MQ with wash out). (B) Cells were pre-treatment with 0.1mM dicumarol at 30min before MQ exposure. Apoptosis was determined by DAPI staining as described in Methods. Results are expressed as mean ± S.E. for A, n= 3 for control, MQ, NAC+MQ, and NAC+MQ with wash out, and n=4 for MQ+NAC. * p< 0.05 versus control; # p< 0.05 versus MQ, and +p<0.05 versus NAC+MQ and NAC+MQ with wash out; B, n=4 for minus and plus dicumarol (Dic). o p< 0.05 versus minus dicumarol.
To validate that MQ mediated apoptosis through formation of an SQ− radical (Figure 1), we inhibited DT diaphorase-catalyzed HQ formation with dicumarol. Figure 2B shows that dicumarol exacerbated MQ-induced apoptosis by 3.5 fold, which agrees with the interpretation that the SQ− radical is the toxic species.
MQ induced imbalance in cytosolic and mitochondrial GSH/GSSG and in mitochondrial protein-SSG
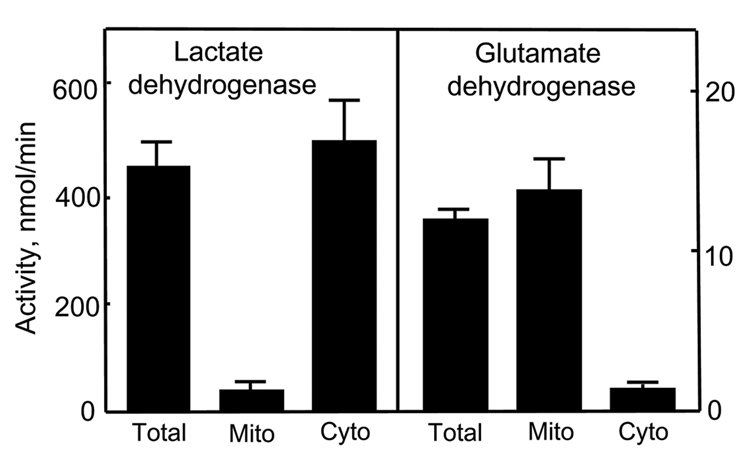
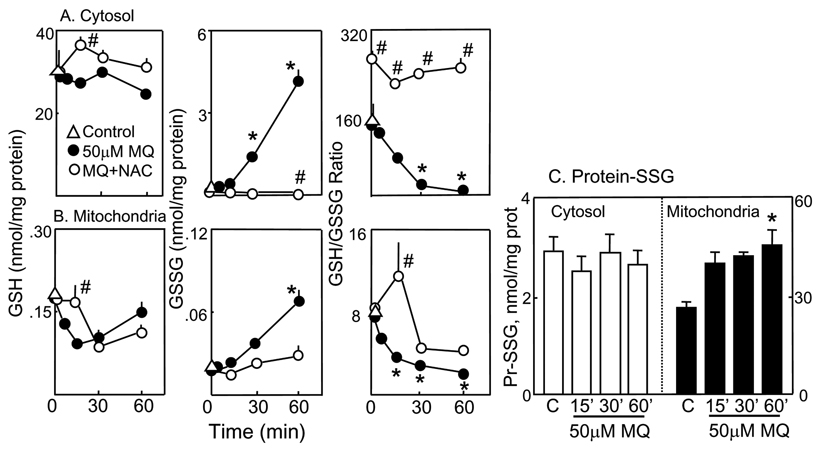
To better understand the role of mtGSH redox status in MQ-induced NCM460 apoptosis, we quantified the changes in cytosolic and mitochondrial GSH and GSSG and the formation of protein-SSG following MQ treatment. Disruption of cells with digitonin allows for rapid separation of the cytosolic from the particulate compartments such as the mitochondria. Previous studies showed that digitonin permeabilization did not alter mtGSH distribution or concentration [21, 43]. Figure 3 illustrates that digitonin fractionation yielded highly enriched mitochondrial and cytoplasmic fractions as assessed by their respective specific organellar enzyme markers, glutamate dehydrogenase and lactate dehydrogenase. Using 14C-inulin as a non cell permeant marker, we found a small carryover of incubation volume (3µl/106 cells) in the fractionation step. Thus, digitonin permeabilization offers a feasible approach to study the cytosolic and mitochondrial GSH/GSSG pools and their responses to oxidative challenge. Figure 4A shows that without MQ, the GSH/GSSG redox status was unchanged over the 60min (open triangle). Exposure to MQ minimally affected cytosolic GSH (left panel), but caused a timedependent increase in GSSG (middle panel), which resulted in significant decreases in the GSH-to-GSSG ratio (30–60min, right panel). Pretreatment with NAC caused a transient increase in cell GSH (at 15min), totally eliminated the time-dependent rise in GSSG, and maintained the GSH-to-GSSG ratio at 1.8 times more reduced than control cells. The results in Figure 4B show that MQ treatment induced an early drop in mtGSH (5 and 15min) that returned to base line after 60min (left panel). The mitochondrial GSSG (mtGSSG) was markedly increased over time (middle panel) and resulted in significant decreases in the GSH-to-GSSG ratio at 15–60min (right panel). Pretreatment with NAC prevented the decrease in mtGSH only at 15min, while attenuating the rise in mtGSSG at all times. Consequently, the matrix GSH-to-GSSG redox status was transiently reduced at 15min, but remained oxidized thereafter at 30–60min (right panel, Figure 4B). Because protein-bound cysteine moieties constitute a substantial thiol pool, we examined whether MQ mediated protein-SSG formation. Figure 4C shows that MQ exerted minimal effects on cytosolic proteins, but caused ~2-fold increase in mitochondrial protein-SSG formation at 60min, which mimicked the rise in mtGSSG.
Figure 3. Digitonin separates mitochondrial and cytosolic compartments.
Highly enriched cytosolic and mitochondrial fractions were obtained using the digitonin fractionation method of Andersson and Jones [37]. Purity of the compartments were determined by their specific organellar enzyme markers of lactate dehydrogenase and glutamate dehydrogenase, respectively and expressed as total enzyme activities.
Figure 4. Kinetics of MQ-induced changes in cytosolic and mitochondrial GSH, GSSG, and protein-SSG.
NCM460 cells were treated with 50µM MQ in the presence or absence of 2mM NAC for 0–60min. At designated times, cytosolic and mitochondrial fractions were separated by digitonin fractionation, and the GSH, GSSG and protein-SSG contents were determined in each compartments. A, cytosolic, and B, mitochondrial fractions. Left panel, GSH; middle panel, GSSG, and right panel, GSH-to-GSSG ratio. Concentrations of GSH and GSSG are expressed as nmol/mg protein and presented as mean ± S.E. for 4 separate experiments. *p< 0.05 versus control; # p< 0.05 versus MQ. C, protein-SSG contents. TCA-insoluble cytosolic and mitochondrial protein pellets obtained after digitonin fractionation were dissolved in 0.1M NaOH and assayed for protein disulfide contents. Results are expressed as nmol/mg protein and presented as mean ± S.E. for three separate experiments. *p< 0.05 versus control.
Blockage of mitochondrial GSH transport exacerbates matrix GSH redox imbalance and potentiates cell apoptosis induced by MQ
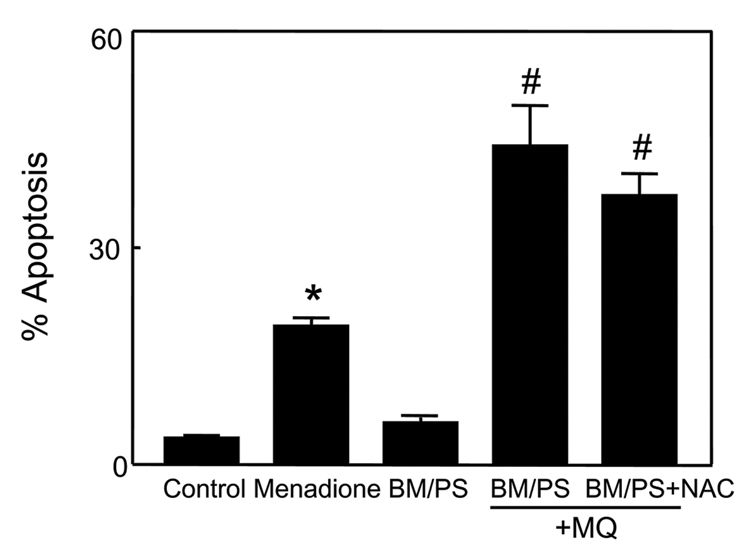
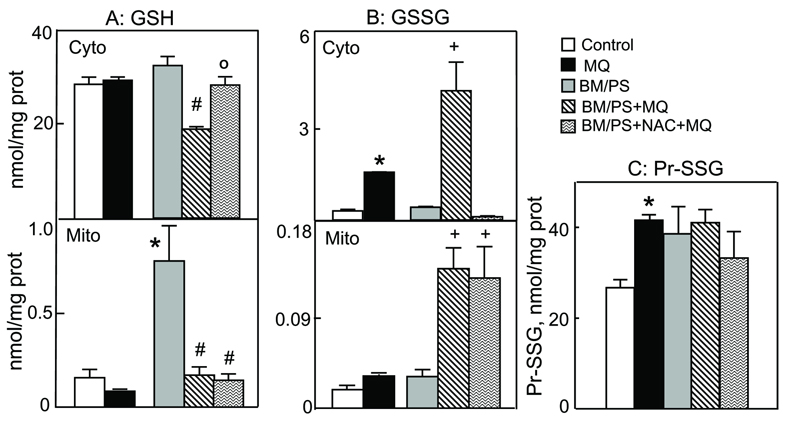
To investigate the contribution of mtGSH transport and the mtGSH status to MQ-induced apoptosis, we manipulated mtGSH uptake using BM and PS, the respective inhibitors of DIC and OGC. At 20mM each, the inhibitors per se were not toxic to cells (Figure 5). However, pre-incubation with BM/PS significantly exacerbated MQ-induced cell apoptosis (2-fold increase, Figure 5). Notably, NAC afforded no protection in the presence of BM/PS, in contrast to untreated cells (see Figure 2). Figure 6 illustrates the changes in mitochondrial GSH and GSSG concentrations under these conditions. Preincubation with BM/PS alone did not markedly alter cytosolic GSH, but notably caused ~4-fold increase in mtGSH (Figure 6A), suggesting that the mtGSH carriers may also function in mtGSH efflux. Exposure of BM/PS treated cells to MQ resulted in significant decreases in cytosolic and mitochondrial, GSH (40% and 4-fold, respectively). Notably, NAC pretreatment prevented the decrease in the cytosolic, but not the mitochondrial GSH (Figure 6A). The results in Figure 6B show that MQ-induced increased in cytosolic GSSG was significantly enhanced in the presence of BM/PS which was completely ablated by NAC. In contrast, while BM/PS similarly enhanced mtGSSG after MQ treatment, this rise in mtGSSG was not prevented by NAC. Interestingly, MQ-induced formation of mitochondrial protein-SSG was not increased in the presence of inhibitors; however, like mtGSSG, NAC failed to attenuate protein thiol oxidation when mtGSH was inhibited (Figure 6C). Collectively, these results indicate that mtGSH transport is important in modulating matrix GSH and colonic cell survival under MQ challenge. The protective affect of NAC appears to be related to its ability to preserve mtGSH via matrix GSH uptake such that the effect of NAC is nullified when mtGSH transport is blocked.
Figure 5. Inhibitors of mitochondrial GSH transport exacerbate MQ-induced apoptosis in NCM460 cells.
NCM460 cells were treated for 2h with 50µM MQ or preincubated for 1h with 20mM each of the mitochondrial GSH transport inhibitors, BM and PS prior to MQ exposure. Whenever present, NAC (2mM) was added at 30min prior to MQ exposure. Cell apoptosis was determined by DAPI staining. Results are expressed as mean ± S.E. for n=3 for control, BM/PS alone, and MQ without or with BM/PS, or n=4 for BM/PS + NAC. *p< 0.05 versus control; #p< 0.05 versus MQ
Figure 6. Inhibitors of mitochondrial GSH transport potentiate MQ-induced increases in cytosolic and mitochondrial GSSG and protein-SSG: NAC attenuates cytosolic, but not mitochondrial changes.
NCM460 cells were pre-treated with or without 20mM BM/PS for 1h and then incubated for 30min with 50µM MQ. Wherever present, 2mM NAC was added at 30min prior to MQ exposure. Cytosolic and mitochondrial fractions were obtained by digitonin fractionation and GSH and GSSG contents were determined in each compartment. Mitochondrial protein-SSG were also determined. Results are expressed as mean ± S.E. for n=3 for control and MQ without or with BM/PS, or n=4 for BM/PS + NAC. A, GSH, *p< 0.05 versus control; #p< 0.05 versus BM/PS; op< 0.05 versus BM/PS+MQ. B, GSSG, *p< 0.05 versus control; #p< 0.05 versus +MQ. C, mitochondrial protein-SSG contents. *p< 0.05 versus control.
MQ-induced apoptosis is associated with mitochondrial cytochrome c release andactivation of procaspase-9
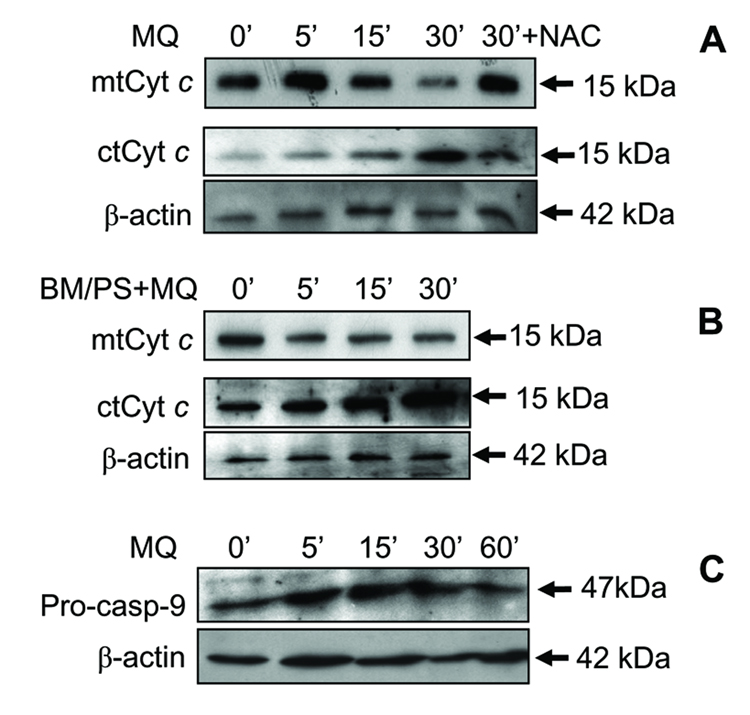
The release of cytochrome c into the cytosol is an early event associated with activation of the mitochondrial apoptotic pathway induced by oxidants. Figure 7A illustrates the kinetics of mitochondrial cytochrome c release following MQ challenge with or without BM/PS or NAC pretreatment. MQ induced mitochondria-to-cytosol translocation of cytochrome c with substantial mitochondrial loss at 30min. At peak, the loss of mitochondrial cytochrome c and its appearance in the cytosol was attenuated by NAC pretreatment, consistent with redox involvement in the process. Inhibition of mtGSH transport with BM/PS accelerated mitochondrial loss of cytochrome c as early as 5min that was sustained for 30min, which corresponded to the significant appearance of cytosolic cytochrome c between 5–30min (Figure 7B). Interestingly, BM/PS alone induced a higher basal level of cytosolic cytochrome c, suggesting a sensitization of cells to apoptosis upon inhibition of mtGSH transport. To examine the temporal relationship between caspase-9 activation and mitochondrial cytochrome c loss, we determined the kinetics of caspase-9 activation. The results in Figure 7C show that procaspase-9 is strongly expressed in untreated cells, increased at 5–30min after MQ exposure, and decreased at 60min, consistent with cleavage of the pro-enzyme to active caspase-9 at this time. Kinetically, the release of cytochrome c (15–30min, Figure 7A) preceded caspase-9 activation (60min, Figure 7C).
Figure 7. Kinetics of MQ-induced mitochondria-to-cytosolic translocation of cytochrome c and activation of caspase-9.
NCM460 cells were incubated with 50µM MQ for 0–30min, and mitochondrial and cytosolic lysates were prepared for western analysis of cytochrome c (A & B) The effect of NAC (A) and inhibitors of mitochondrial GSH transport (B) was examined in cells pretreated with 2mM NAC for 30min or with 20mM BM/PS for 1h, respectively, before MQ exposure. The time course of caspase-9 activation was determined by western analysis of procaspase-9 cleavage (C) in cell lysates after treatment of NCM460 cells with 50µM MQ for 0–60min. The membranes of each cytosolic immunoblot were stripped and reprobed for β−actin to verify equal protein loading in each lane. One representative of 3 western blots is shown.
MQ-induced GSH redox imbalance is associated with loss of mitochondrial function
Given the centrality of the mitochondrion in cellular oxidative metabolism and cell survival, we examined the relationship between MQ-induced mitochondrial GSH redox imbalance and various mitochondrial function, namely, mitochondrial respiratory activity, ΔΨm, and ATP production.
O2 consumption and oxidation-reduction of cytochrome aa3
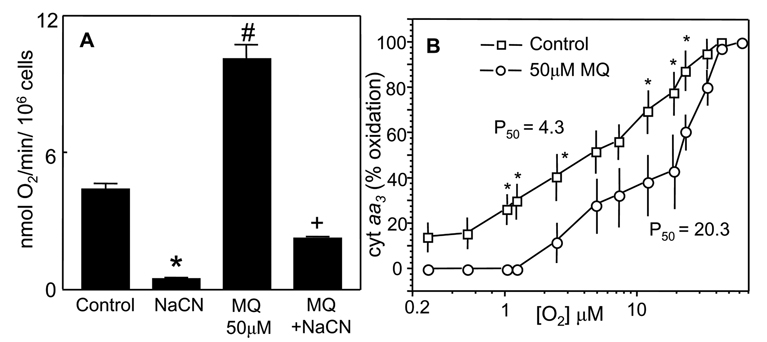
Mitochondrial respiratory activity was assessed by the O2 consumption rate and the O2 dependence of the oxidation of cytochrome aa3. To distinguish between mitochondrial and non-mitochondrial O2 consumption, cells were treated with NaCN, an inhibitor of complex IV of the respiratory chain. Figure 8A shows that basal respiratory rate was 4.5nmol O2 consumed/min/106 cells, which was essentially inhibited by NaCN, indicating that the O2 consumption is predominantly of mitochondrial origin. The addition of MQ to cell suspensions caused a two-fold increase in O2 consumption, 93% of which was CN-sensitive, consistent with redox cycling of MQ/SQ− within the mitochondria (see Figure 1). Moreover, MQ caused a right shift in the O2 dependence of cytochrome aa3 and increased the P50 value by 4.7-fold (20.3 versus 4.3 in control cells, Figure 8B), consistent with MQ-induced increase in mitochondrial O2 consumption (Figure 8A). This increase in P50 may be explained by the competition for intra-mitochondrial O2 availability between MQ metabolism and cytochrome oxidation or by increased O2−-mediated disruption of normal redox electron transfer of cytochrome aa3.
Figure 8. MQ stimulates oxygen consumption in NCM460 cells and increases the P50 value of O2 dependence of cytochrome aa3 oxidation.
A, O2 consumption was performed with NCM460 cells (2×10⁶/ml) treated with 50µM MQ in the presence or absence of 300µM NaCN. O2 consumption was measured with a Clark-type O2 electrode and expressed in nmol O2/min/106cells. The NaCN-sensitive rate represents mitochondrial O2 consumption. *p< 0.05 versus control; #p< 0.05 versus MQ treatment. B, O2 dependence of oxidation of cytochrome aa. was performed with NCM460 cells (5×10⁶ /ml in Geys buffer) in the absence or presence of 50µM MQ. Cells were maintained in suspension by gentle stirring with a magnetic stirrer, and changes in oxidation-reduction of cytochrome a+a3 were measured spectrophotometrically using wavelengths pairs of 605nm–630nm at different O2 concentrations [38]. Results are expressed as % oxidized cytochrome calculated with respect to aerobic cells; the P50 value represents half maximal oxidation. Data represent the mean ± SEM of 3 cell preparations. *p< 0.05 versus control. The P50 value for MQ-treated cells (20.3) is significantly higher than that for untreated cells (4.3) (p<0.05).
Loss of mitochondrial transmembrane potential (ΔΨm) and ATP production
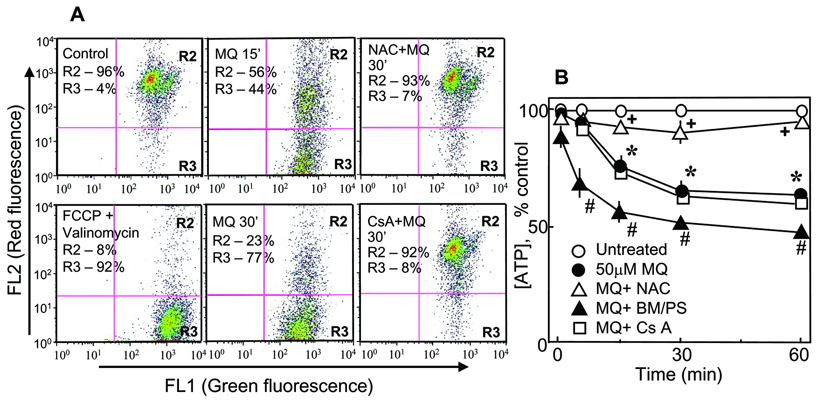
A reduced redox activity of cytochrome aa3 suggests a compromised mitochondrial electrochemical proton gradient. To verify this, we measured ΔΨm using the fluorescent JC1 dye and flow cytometry. The results are presented in Figure 9A. The R2 and R3 regions represent cells that exhibited high and low red-to-green fluorescence ratio, indicating high and low ΔΨm, respectively. Normally, ~5% of control cells exhibited decreased ΔΨm. Treatment with MQ induced a time-dependent loss of JC-1 fluorescence, indicating cell depolarization (44.5% and 76.9% at 15 and 30min, Figure 9A, R3 quadrant). Pretreatment with NAC prevented ΔΨm loss; the magnitude of protection was similar to that elicited by cyclosporine A, an inhibitor of the mitochondrial permeability transition pore (MPT). These results suggest that MQ-induced ΔΨm collapse is redox sensitive and could be induced by MPT. To examine if ΔΨm loss is linked to mitochondrial failure to generate ATP, we quantified cellular ATP content under conditions of MQ exposure without or with NAC, BM/PS, or cyclosporine A. Figure 9B shows that MQ induced a time-dependent loss of cellular ATP by 40% at 60min. ATP loss was prevented by NAC, but was exacerbated by BM/PS, suggesting a role for mtGSH transport and mtGSH in mitochondrial ATP production. Interestingly, pretreatment of cells with cyclosporine A did not protect against MQ-induced ATP losses, suggesting a dissociation of MPT function from that of ATP production.
Figure 9. MQ decreases mitochondrial membrane potential, ΔΨm and ATP production in NCM460 cells.
A. Changes in ΔΨm were determined by flow cytometry analyses by JC-1 fluorescence as described in Methods. Briefly, NCM460 cells were treated with 50µM MQ for 15 or 30min, incubated with 5µg/ml JC-1 for 15min and prepared for flow cytometry. In some experiments, cells were pre-incubated for 30min with 2mM NAC or for 1h with µM cyclosporine A (CsA) and then exposed to MQ. Treatment of cells with 0.1µM FCCP and 0.1µM valinomycin (>90% depolarization of ΔΨm) serve as positive control, and was used to calibrate the flow cytometer. The delineated R2 and R3 regions represent cell populations exhibiting high (R2) or low (R3) red-to-green fluorescence ratio, that corresponded with high and low ΔΨm, respectively. One experiment representative of three is shown. The preservation of ΔΨm with NAC and cyclosporine A was effective at both 15min (not shown) and 30min. B. NCM460 cells (2×10³) were plated in 96 well plates and grown overnight at 37°C. The next day, cells were treated with 50µM MQ, in the absence or presence of NAC, BM/PS or cyclosporine A. ATP was measured with a Promega kit according to the manufacturer’s protocol. ATP concentration is expressed as % inhibition relative to the control set at 100%. Results are the mean ±SEM of 4 cell preparations. * p< 0.05 versus control; #,+p< 0.05 versus MQ treatment.
DISCUSSION
In previous studies, we have established a relationship between an early loss of cellular GSH/GSSG redox balance and oxidant-induced apoptosis in intestinal [2] and undifferentiated PC12 [40–42] cells which can be prevented by pretreatment with NAC [2, 40]. In the current study, we found that loss of mitochondrial redox balance (namely, increased GSSG and protein-bound-SSG) can promote apoptotic susceptibility of the non-transformed colon epithelial NCM460 cell line, to MQ challenge. MQ-induced colonocyte apoptosis was associated with significant loss of mitochondrial respiratory function, including decreased mitochondrial cytochrome redox activity, ΔΨm, and ATP production, the latter of which was exaggerated by inhibition of mtGSH transport and protected by NAC administration. The cytoprotective effect of NAC does not appear to be due to its direct quenching of MQ, in agreement with studies of Takahashi et al who demonstrated that the presence of NAC did not block the one-electron reduction of MQ in vitro [43].
The finding that inhibition of mtGSH transport elevated mtGSSG and potentiated MQ-induced NCM460 apoptosis supports the importance of mtGSH transport and matrix GSH in colonic cell susceptibility to MQ. This contention agrees with previous findings that increases in mtGSH (2- to 10-fold) protected renal epithelial cells against nephrotoxin-induced toxicity [23], and that loss of mtGSH in kidney mitochondria [7] and in non-epithelial cells promoted cytotoxicity in response to various drugs and oxidizing agents [12–14]. Our data suggests that the mtGSH redox status could have a greater impact on the vulnerability of NCM460 cells to oxidative challenge since mitochondrial protein-bound thiols were more vulnerable to oxidation. The observation that inhibition of mtGSH transport exacerbated cell apoptosis and prevented the protective effect of NAC in accordance with elevated mtGSSG as well as protein-SSG is consistent with this suggestion. This notwithstanding, a role for cytosolic GSH cannot be unequivocally ruled out given that MQ induced significant oxidation of cytosolic GSH alongside that of mitochondrial GSH (Figure 4). However, the failure of NAC to prevent cell apoptosis under conditions of GSH transport blockade (Figure 5), despite total recovery of cytosolic GSH/GSSG homeostasis (Figure 6B), suggests that the cytosolic GSH pool may play less of a direct role in the cytotoxicity of MQ. Since digitonin fractionation also retain components of the colonic epithelial secretory pathway, protein oxidation or GSSG accumulation in this fraction could potentially complicate our interpretation of a specific role of mitochondrial GSH/GSSG in colonic apoptosis. However, the mitochondrial GSH pool is likely to be the major contributor to NCM460 apoptosis given a direct relationship between inhibition of mtGSH transport and exaggerated apoptosis (Figure 5).
One mechanism whereby MQ can induce mitochondrial GSH/GSSG redox shift is the increase in ROS production from redox cycling. Our finding of an increase in O2 consumption is consistent with enhanced O2 utilization for MQ/SQ− redox cycling. Moreover, the increase in P50 for cytochrome aa3 oxidation suggests that MQ competes with mitochondrial cytochromes for O2 to support intra-mitochondrial ROS production. Conceivably, one-electron reduction of MQ could be catalyzed by mitochondrial NADPH-ubiquinone oxidoreductase (Figure 1). This suggestion agrees with previous studies of de Groot et al [25] which implicated the mitochondria as the site of quinine redox cycling in hepatocytes. Other studies by Powis et al also implicated the mitochondria as the preferred compartment for quinone-mediated ROS generation [44]. Support for the mitochondrion as a likely site of MQ redox cycling in colonic cells comes from our recent studies in rho 0 (ρ0) cells in the colon cancer HT29 cell line. Our generated HT29 ρ0 clones do not express the F0 subunit of the mitochondrial ATP synthase, or exhibit antimycin A-sensitive O2 consumption or O2 dependence of cytochrome aa3 oxidation, all indications of a lack of a functional mitochondrial electron transport chain consequent to mitochondrial DNA depletion. We found that, as compared to HT29 wild type cells, HT29 ρ0 cells are significantly more resistant to MQ-induced apoptosis (20 ± 1% versus 11 ± 1%, respectively, p<0.05). We concluded from this finding that the mitochondrion is an important site of MQ redox cycling and ROS production that could influence the vulnerability of colon cancer epithelial cells during oxidative challenge. Ongoing efforts are underway to generate NCM460 ρ0 cells to determine if mitochondria-depleted NCM460 cells are similarly resistant to MQ toxicity.
The current study shows that MQ induced the mitochondrial apoptosis pathway as evidenced by early activation of the mitochondria-to-cytosolic translocation of cytochrome c and procaspase-9 (30–60min), which is upstream of cell apoptosis (2h). The respective blockade or acceleration of mitochondrial cytochrome c release by NAC and BM/PS suggests that this early apoptosis initiation event is responsive to manipulation of the mtGSH redox status. However, the redox-dependent mechanisms in mitochondria-tocytosol translocation of cytochrome c and apoptosis initiation remain to be defined. One potential target of redox control is the MPT. Constantini et al found that specific oxidation of a critical cysteine residue, Cys-56, in the adenine nucleotide translocator within the permeability transition pore complex led to membrane permeability that was not preventable by recombinant Bcl-2 [45]. Another potential target for redox regulation is the mitochondrially located apoptosis signal-regulating kinase 1 (ASK-1). Recent studies by Zhang et al (2004) demonstrated that knockdown of thioredoxin 2 (Trx2) activity stimulated ASK-1 activation, cytochrome c release and JNK-independent apoptosis in endothelial cells [46]. Superoxide generated from MQ redox cycling could induce Trx2 oxidation and the dissociation of the Trx2-ASK-1 complex and ASK-1 activation. Finally, cytochrome c release could be mediated by direct ROS-mediated oxidation of the phospholipid, cardiolipin (CL), which normally associates with cytochrome c in the mitochondrial inner membrane. Studies from Orrenius’ and Kagan’s laboratories showed that ROS-mediated breach of the electrostatic and hydrophobic interactions between cytochrome c-CL complex provides a mechanism for cytochrome c to leave the mitochondria [47, 48]. Thus, oxidative modification of cardiolipin by MQ could be pivotal in mitochondrial cytochrome c loss and cell commitment to apoptosis.
The delineation of the intra-mitochondrial redox mechanisms of mitochondrial cytochrome c loss is a focus of ongoing studies in our laboratory. In addition, we recently generated HT29 clones that over-express the wild-type (WT) OGC or OGC double mutant (cysteine 221, 224-to-serine) as a genetic approach to investigate the contribution of mtGSH transport to colonocyte apoptosis during oxidative challenge. We found that, as compared to parent HT29 cells and vector controls, MQ-induced HT29 apoptosis (30±2%) was attenuated in OGC-WT (17±1%), and exacerbated in OGC-Cys double mutants (70±4%), consistent with a role for mtGSH transport in preserving colonic cell survival, which corroborates the current findings using pharmacologic inhibitors of mtGSH uptake. A similar strategy is underway to generate stable clones that over-express OGC-WT and OGC-Cys double mutants in NCM460 cells.
In summary, our data demonstrate that mitochondrial GSH transport plays an important role in the maintenance of the mitochondrial respiratory activity, and MQ-induced apoptosis in a non transformed NCM460 colonic cell line. The results implicate the semiquinone radical as the toxic species and that the mitochondrion is a likely site of MQ redox cycling.
Acknowledgement
This study was supported by grant DK 44510 from the National Institutes of Health.
Abbreviations
- BM
buthylmalonate
- CsA
cyclosporine A
- DAPI
4’,6-diamidino-2-phenylindole
- DTT
dithiothreitol
- FCCP
carbonylcyanide-p-trifluoromethoxyphenylhydrazone
- GSH
reduced glutathione
- GSSG
glutathione disulfide
- HPLC
high-performance liquid chromatography
- HQ
hydroquinone
- JC-1
5,5’,6,6’-tetrachloro-1,1’,3,3’-tetraethyl-benzamidazolocarbocyanin iodide
- MQ
menadione
- mtGSH
mitochondrial GSH
- mtGSSG
mitochondrial GSSG
- NAC
N-acetyl-L-cysteine
- NCM460
nontransformed colon epithelial cells
- NQO1
NAD(P)H:quinine oxidoreductase (also known as DT diaphorase)
- PMSF
phenylmethylsulfonyl fluoride
- Pr-SSG
protein disulfide
- PS
phenylsuccinate
- ROS
reactive oxygen species
- SQ
semiquinone radical
Footnotes
Publisher's Disclaimer: This is a PDF file of an unedited manuscript that has been accepted for publication. As a service to our customers we are providing this early version of the manuscript. The manuscript will undergo copyediting, typesetting, and review of the resulting proof before it is published in its final citable form. Please note that during the production process errors may be discovered which could affect the content, and all legal disclaimers that apply to the journal pertain.
References
- 1.Tsunada S, Iwakiri R, Noda T, Fujimoto K, Fuseler JW, Aw TY. Chronic exposure to subtoxic levels of peroxidized lipids suppresses mucosal cell turnover in rat small intestine and the reversal by glutathione. Dig. Dis. Sci. 2003;48:210–222. doi: 10.1023/a:1021775524062. [DOI] [PubMed] [Google Scholar]
- 2.Wang TG, Gotoh Y, Jennings MH, Rhoads CA, Aw TY. Cellular redox imbalance induced by lipid hydroperoxide promotes apoptosis in human colonic CaCo-2 cells. FASEB J. 2000;14:1567–1676. doi: 10.1096/fj.14.11.1567. [DOI] [PubMed] [Google Scholar]
- 3.Noda T, Iwakiri R, Fujimoto K, Aw TY. Induction of mild intracellular redox imbalance inhibits proliferation of CaCo-2 cells. FASEB J. 2001;15:2131–2139. doi: 10.1096/fj.01-0131com. [DOI] [PubMed] [Google Scholar]
- 4.Gotoh Y, Noda T, Iwakiri R, Fujimoto K, Rhoads CA, Aw TY. Lipid peroxide-induced redox imbalance differentially mediates CaCo-2 cell proliferation and growth arrest. Cell Prolif. 2002;35:221–235. doi: 10.1046/j.1365-2184.2002.00241.x. [DOI] [PMC free article] [PubMed] [Google Scholar]
- 5.Okouchi M, Okayama N, Aw TY. Differential susceptibility of naïve and differentiated PC-12 cells to methylglyoxal-induced apoptosis: influence of cellular redox. Curr. Neurovasc. Res. 2005;2:13–22. doi: 10.2174/1567202052773535. [DOI] [PubMed] [Google Scholar]
- 6.Ekshyyan O, Aw TY. Decreased susceptibility of differentiated P12 cells to oxidative challenge: relationship to cellular redox and expression of apoptotic protease activator factor-1. Cell Death Differ. 2005;12:1066–1077. doi: 10.1038/sj.cdd.4401650. [DOI] [PubMed] [Google Scholar]
- 7.Santos NAG, Catao CS, Martins NM, Curti C, Bianchi MLP, Santos AC. Cisplatin-induced nephrotoxicity is associated with oxidative stress, redox state imbalance, impairment of energetic metabolism and apoptosis in rat kidney mitochondria. Arch. Toxicol. 2007 doi: 10.1007/s00204-006-0173-2. epub ahead of print. [DOI] [PubMed] [Google Scholar]
- 8.Collel A, Garcia-Ruiz C, Miranda M, Ardite E, Mari M, Morales A. Selective glutathione depletion of mitochondria by ethanol sensitizes hepatocytes to tumor necrosis factor. Gastroenterology. 1998;115:1541–1551. doi: 10.1016/s0016-5085(98)70034-4. [DOI] [PubMed] [Google Scholar]
- 9.Anderson MF, Sims NR. The effects of focal ischemia and reperfusion on the glutathione content of mitochondria from rat brain subregions. J.Neurochem. 2002;81:541–549. doi: 10.1046/j.1471-4159.2002.00836.x. [DOI] [PubMed] [Google Scholar]
- 10.Llouis JM, Morales A, Blasco C, Corell A, Mari M, Garcia-Ruiz C, Fernandez-Checa JC. Critical role for mitochondrial glutathione in the survival of hepatocytes during hypoxia. J.Biol.Chem. 2005;280:3224–3232. doi: 10.1074/jbc.M408244200. [DOI] [PubMed] [Google Scholar]
- 11.Krahenbuhl S, Talos C, Lauterburg BH, Reichen J. Reduced antioxidative capacity in liver mitochondria from bile duct ligated rats. Hepatology. 1995;22:607–612. doi: 10.1002/hep.1840220234. [DOI] [PubMed] [Google Scholar]
- 12.Hallberg E, Rydstrom J. Selective oxidation of mitochondrial glutathione in cultured rat adrenal cells and its relation to polycyclic aromatic hydrocarbon-induced cytotoxicity. Arch. Biochem. Biophys. 1989;270:662–671. doi: 10.1016/0003-9861(89)90549-3. [DOI] [PubMed] [Google Scholar]
- 13.Olafsdottir K, Reed DJ. Retention of oxidized glutathione by isolated rat liver mitochondria during hydroperoxide treatment. Biochim. Biophys. Acta. 1988;964:377–382. doi: 10.1016/0304-4165(88)90038-4. [DOI] [PubMed] [Google Scholar]
- 14.Fernandez-Checa JC, Garcia-Ruiz C, Ookhtens M, Kaplowitz N. Impaired uptake of glutathione by hepatic mitochondrial from chronic ethanol-fed rats. Tracer kinetic studies in vitro and in vivo and susceptibility to oxidant stress. J. Clin. Invest. 1991;87:397–405. doi: 10.1172/JCI115010. [DOI] [PMC free article] [PubMed] [Google Scholar]
- 15.Griffith OW, Meister A. Origin and turnover of mitochondrial glutathione. Proc. Natl. Acad. Sci. U.S.A. 1985;82:4668–4672. doi: 10.1073/pnas.82.14.4668. [DOI] [PMC free article] [PubMed] [Google Scholar]
- 16.Uhlig S, Wandel A. The physiological consequences of glutathione variation. Life Sci. 1992;51:1083–1094. doi: 10.1016/0024-3205(92)90509-n. [DOI] [PubMed] [Google Scholar]
- 17.Han D, Canali R, Rettori D, Kaplowitz N. Effect of glutathione depletion on site and topology of superoxide and hydrogen peroxide production in mitochondria. Mol. Pharmacol. 2003;64:1136–1144. doi: 10.1124/mol.64.5.1136. [DOI] [PubMed] [Google Scholar]
- 18.Lash LH, Visarius TM, Sall JV, Qian W, Tokarz JJ. Cellular and subcellular heterogeneity of glutathione metabolism and transport in rat kidney cells. Toxicol. 1998;130:1–15. doi: 10.1016/s0300-483x(98)00093-6. [DOI] [PubMed] [Google Scholar]
- 19.Meister A, Anderson ME. Glutathione. Ann. Rev. Biochem. 1983;52:711–760. doi: 10.1146/annurev.bi.52.070183.003431. [DOI] [PubMed] [Google Scholar]
- 20.Martensson J, Lai JC, Meister A. High-affinity transport of glutathione is part of a multi-component system essential for mitochondrial function. Proc. Natl. Acad. Sci U.S.A. 1990;87:7185–7189. doi: 10.1073/pnas.87.18.7185. [DOI] [PMC free article] [PubMed] [Google Scholar]
- 21.Chen Z, Lash LH. Evidence for mitochondrial uptake of glutathione by dicarboxylate and 2-oxoglutarate carriers. J.Pharmacol.Exp.Ther. 1998;285:608–618. [PubMed] [Google Scholar]
- 22.Chen Z, Putt DA, Lash LH. Enrichment and functional reconstitution of glutathione transport activity from rabbit kidney mitochondria: further evidence for the role of the dicarboxylate and 2-oxoglutarate carriers in mitochondrial glutathione transport. Arch. Biochem. Biophys. 2000;373:193–202. doi: 10.1006/abbi.1999.1527. [DOI] [PubMed] [Google Scholar]
- 23.Lash LH, Putt DA, Matherly LH. Protection of NRK-52E cells, a rat proximal tubular cell line, from chemical-induced apoptosis by overexpression of a mitochondrial glutathione transporter. J. Pharmacol. Exp.Therapeutics. 2002;303:476–486. doi: 10.1124/jpet.102.040220. [DOI] [PubMed] [Google Scholar]
- 24.Abdelmonhsen K, Patak P, von Montfort C, Melchheiere I, Sies H, Klotz LO. Signaling effects of menadione: From tyrosine phosphatase inactivation to connexin phosphorylation. Meth. Enzymol. 2004;378:258–272. doi: 10.1016/S0076-6879(04)78020-9. [DOI] [PubMed] [Google Scholar]
- 25.De Groot H, Noll T, Sies H. Oxygen dependence and subcellular partitioning of hepatic menadione-mediated oxygen uptake. Arch. Biochem. Biophys. 1985;243:556–562. doi: 10.1016/0003-9861(85)90532-6. [DOI] [PubMed] [Google Scholar]
- 26.Thor H, Smith MT, Hartzell P, Bellomo G, Jewell SA, Orrenius S. The metabolism of menadione (2-methyl-1,4-naphtoquinone) by isolated hepatocytes. J. Biol.Chem. 1982;257:12491–12425. [PubMed] [Google Scholar]
- 27.Watanabe N, Dickinson DA, Liu RM, Forman HJ. Quinones and glutathione metabolism. Meth. Enzymol. 2004;378:319–340. doi: 10.1016/S0076-6879(04)78024-6. [DOI] [PubMed] [Google Scholar]
- 28.Frei B, Winterhalten KH, Richter C. Menadione–(2-methyl-1,4-naphtoquinone) dependent enzymatic redox cycling and calcium release by mitochondria. Biochemistry. 1986;25:4438–4443. doi: 10.1021/bi00363a040. [DOI] [PubMed] [Google Scholar]
- 26.Redegeld F, Moison R, Koster A, Noordhoek J. Alterations in energy status by menadione metabolism in hepatocytes isolated from fasted and fed rats. Arch. Biochem. Biophys. 1989;273:215–222. doi: 10.1016/0003-9861(89)90181-1. [DOI] [PubMed] [Google Scholar]
- 30.Di Monte D, Bellomo G, Thor H, Nicotera P, Orrenius S. Menadione-induced citotoxicity is associates with protein thiol oxidation and alteration in intracellular Ca2+ homeostasis. Arch. Biochem. Biophys. 1984b;235:343–350. doi: 10.1016/0003-9861(84)90207-8. [DOI] [PubMed] [Google Scholar]
- 31.Henry T, Wallace K. Differential mechanism of induction of the mitochondrial permeability transition by quinones of varying chemical reactivities. Toxicol. Appl. Pharmacol. 1995;134:195–203. doi: 10.1006/taap.1995.1184. [DOI] [PubMed] [Google Scholar]
- 32.Moyer MP, Manzano LA, Merriman RL, Stuffer JS, Tanzer LR. NCM460, a normal human colon mucosal epithelial cell line. In Vitro Cell Dev. Biol. Anim. 1996;32:315–317. doi: 10.1007/BF02722955. [DOI] [PubMed] [Google Scholar]
- 33.Sahi J, Nataraja SG, Layden TJ, Goldstein JL, Moyer MP, Rao MC. Cl− transport in an immortalized human epithelial cell line (NCM460) derived from the normal transverse colon. Am. J. Physiol. 1998;275:C1048–C1057. doi: 10.1152/ajpcell.1998.275.4.C1048. [DOI] [PubMed] [Google Scholar]
- 34.Aw TY, Andersson BS, Jones DP. Mitochondrial transmembrane ion distribution during anoxia. Am. J. Physiol. 1987;252:C356–C361. doi: 10.1152/ajpcell.1987.252.4.C356. [DOI] [PubMed] [Google Scholar]
- 35.Wang X, Martindale JL, Liu Y, Holbrook NJ. The cellular response to oxidative stress: influences of mitogen activated protein kinase signaling pathways on cell survival. Biochem. J. 1998;333:291–300. doi: 10.1042/bj3330291. [DOI] [PMC free article] [PubMed] [Google Scholar]
- 36.Reed DJ, Babson JR, Beatty PW, Ellis WW, Potter DW. High-performance liquid chromatography analysis of nanomole levels of glutathione, glutathione disulfide and related thiols and disulfides. Anal. Biochem. 1980;106:55–62. doi: 10.1016/0003-2697(80)90118-9. [DOI] [PubMed] [Google Scholar]
- 37.Andersson BS, Jones DP. Use of digitonin fractionation to determine mitochondrial transmembrane ion distribution in cells during anoxia. Anal. Biochem. 1985;146:164–172. doi: 10.1016/0003-2697(85)90411-7. [DOI] [PubMed] [Google Scholar]
- 38.Aw TY, Willson E, Hagen TM, Jones DP. Determinants of mitochondrial O2 dependence in kidney. Am. J. Physiol. 1987;253:F440–F447. doi: 10.1152/ajprenal.1987.253.3.F440. [DOI] [PubMed] [Google Scholar]
- 39.Reers M, Sliley ST, Mottola-Harshborn C, Chen A, Liu M, Chen LB. Mitochondrial membrane potential monitored by JC-1. Meth. Enzymol. 1995;260:406–417. doi: 10.1016/0076-6879(95)60154-6. [DOI] [PubMed] [Google Scholar]
- 40.Pias E, Aw TY. Early redox imbalance mediates hydroperoxide-induced apoptosis in mitotic competent undifferentiated PC-12 cells. Cell Death Diff. 2002b;9:1007–1016. doi: 10.1038/sj.cdd.4401064. [DOI] [PubMed] [Google Scholar]
- 41.Pias E, Ekshyyan OY, Rhoads CA, Fuseler JW, Harrison L, Aw TY. Differential effects of superoxide dismutase isoform expression on hydroperoxide-induced apoptosis in PC-12 cells. J. Biol. Chem. 2003;278:13294–13301. doi: 10.1074/jbc.M208670200. [DOI] [PubMed] [Google Scholar]
- 42.Pias E, Aw TY. Apoptosis in mitotic competent undifferentiated cells is induced by redox imbalance independently of reactive oxygen species production. FASEB J. 2002a;16:781–790. doi: 10.1096/fj.01-0784com. [DOI] [PubMed] [Google Scholar]
- 43.Takahashi N, Schreiber J, Fisher V, Mason RP. Formation of glutathione-conjugated semiquinones by the reaction of quinones with glutathione: an ESR study. Arch. Biochem. Biophys. 1987;252:41–48. doi: 10.1016/0003-9861(87)90006-3. [DOI] [PubMed] [Google Scholar]
- 44.Powis G, Appel PL. Relationship of the single-electron reduction potential of quinones to their reduction by flavoproteins. Biochem. Pharmacol. 1980;29:25-67–2572. doi: 10.1016/0006-2952(80)90068-4. [DOI] [PubMed] [Google Scholar]
- 45.Constantini P, Belzacq AS, Vieira H, Larochette N, de Pablo M, Zamzami N, Susin SA, Brenner C, Kroemer G. Oxidation of a critical thiol residue of the adenine nucleotide translocator enforces Bcl-2-independent permeability transition pore opening and apoptosis. Oncogene. 2000;19:307–314. doi: 10.1038/sj.onc.1203299. [DOI] [PubMed] [Google Scholar]
- 46.Zhang R, Al-Lamki R, Bai L, Streb JW, Miamo JM, Bradley J, Min W. Thioredoxin-2 inhibits mitochondria-located ASK1-mediated apoptosis in a JNK-independent manner. Circ. Res. 2004;94:1483–1491. doi: 10.1161/01.RES.0000130525.37646.a7. [DOI] [PubMed] [Google Scholar]
- 47.Ott M, Robertson JD, Gogvadze V, Zhivotovsky B, Orrenius S. Cytochrome c release from mitochondrial proceeds by a two-step process. Proc. Natl. Acad. Sci. USA. 2002;99:1259–1263. doi: 10.1073/pnas.241655498. [DOI] [PMC free article] [PubMed] [Google Scholar]
- 48.Kagan VE, Borisenko GG, Tyurina YY, Tyurin VA, Jiang J, Potapovich AI, Kini V, Amoscato AA, Fujii Y. Oxidative lipidomics of apoptosis: redox catalytic interactions of cytochrome c with cardiolipin and phosphatidylserine. Free Rad. Biol. Med. 2004;37:1963–1958. doi: 10.1016/j.freeradbiomed.2004.08.016. [DOI] [PubMed] [Google Scholar]


