

Abstract
Current cochlear implant processors poorly represent sound waveforms in the temporal discharge patterns of auditory-nerve fibers (ANFs). A previous study [Litvak et al., J. Acoust. Soc. Am. 114, 2079–2098 (2003)] showed that the temporal representation of sinusoidal stimuli can be improved in a majority of ANFs by encoding the stimuli as small modulations of a sustained, high-rate (5 kpps), desynchronizing pulse train (DPT). Here, these findings are extended to more complex stimuli by recording ANF responses to pulse trains modulated by bandpass filtered vowels. Responses to vowel modulators depended strongly on the discharge pattern evoked by the unmodulated DPT. ANFs that gave sustained responses to the DPT had period histograms that resembled the modulator waveform for low (<5%) modulation depths. Spectra of period histograms contained peaks near the formant frequencies. In contrast, ANFs that gave a transient (<1 min) response to the DPT poorly represented the formant frequencies. A model incorporating a linear modulation filter, a noisy threshold, and neural refractoriness predicts the shapes of period histograms for both types of fibers. These results suggest that a DPT-enhanced strategy may achieve good representation of the stimulus fine structure in the temporal discharge patterns of ANFs for frequencies up to 1000 Hz. It remains to be seen whether these temporal discharge patterns can be utilized by cochlear implant subjects.
I. INTRODUCTION
In a healthy ear, the fine-time structure of acoustic stimuli is represented in the temporal discharge patterns of auditory-nerve fibers (ANFs) for frequencies up to 5 kHz (Johnson, 1980). For a complex sound, the auditory nerve is able to represent several frequency components simultaneously in the temporal discharge patterns. For example, with a sustained vowel stimulus, both the information in the envelope and the information in the fine-time structure (e.g., formant frequencies) are represented in the temporal patterns (Delgutte, 1984; Miller and Sachs, 1984; Young and Sachs, 1979). Future cochlear implant devices may attempt to reproduce these temporal discharge patterns in the deaf cochlea. Doing so may provide more information to the implantees about the incoming sounds than is available through existing implants, which often provide only envelope information.
Although it would be conceptually straightforward to include fine-time structure information in the electric stimuli generated by a cochlear implant processor, and, in fact, some processors such as those using compressed analog strategies already do so, physiological studies suggest that the fine structure will be poorly represented in the temporal discharge patterns of ANFs for any of these schemes. Responses to vowels delivered electrically occur primarily at the largest peak of the vowel waveform over a wide range of vowel amplitudes (van den Honert and Stypulkowski, 1987; Knauth et al., 1994). Thus, only the pitch-related envelope, and not the formant-related fine-time structure, is coded reliably in ANF temporal discharge patterns. This is true even if vowels are amplitude compressed to the psychophysical dynamic range (Knauth et al., 1994). This poor temporal representation reflects basic characteristics of electric stimulation, including a small dynamic range, very high discharge rates amplifying refractory effects, and excessive synchrony of responses across fibers.
Rubinstein et al. (1999) proposed that the temporal coding of the waveforms of electric stimuli might be improved by introducing an ongoing, high-frequency, desynchronizing pulse train (DPT) over the stimulus delivered by the processor. The purpose of a DPT is to desynchronize the spike activity across auditory nerve fibers, much as spontaneous activity does in a normal ear, thereby expanding the dynamic range and reducing temporal distortions due to neural refractoriness. In a companion paper (Litvak et al., 2003a), we recorded ANF responses to sinusoidal modulations of long-duration (10-min), 5-kpps DPTs. We found that, for small modulation depths (<5%), temporal discharge patterns of some fibers to sinusoidal modulators resembled responses to pure tones in a healthy ear. Specifically, the spike discharges of fibers that gave sustained responses to the unmodulated DPT were stochastic, occurring every one, two or more cycles, and provided a more accurate representation of the sinusoidal stimulus waveform than responses to either electric sinusoids (Hartmann et al., 1984; van den Honert and Stypulkowski, 1987) or modulated pulse trains (Litvak et al., 2001) presented without a DPT. In addition, both the average discharge rates and the synchronization indices grew mono-tonically with modulation depth, together providing a total dynamic range of about 20 dB, comparable to that found for acoustic stimulation with pure tones. The relatively large dynamic range to sinusoidal modulations suggests that complex waveforms having peaks of differing heights might be faithfully represented in the temporal discharge patterns of sustained responders with a DPT. To test this hypothesis, we recorded responses of ANFs to DPTs modulated by filtered vowels. We focused on vowels because of the perceptual importance of these stimuli, and because their representation in a normally functioning ear has been extensively characterized (Delgutte, 1984; Miller and Sachs, 1984; Young and Sachs, 1979).
In the companion paper (Litvak et al., 2003a), we proposed a simple stochastic threshold model (STM) that describes ANF responses in the presence of a DPT. For sinusoidal modulations of the DPT, the model successfully predicted the dependence of threshold and dynamic range on the discharge rate evoked by the unmodulated DPT, which we refer to as “pseudo-spontaneous rate.” We suggested an elaboration of the stochastic threshold model that might also predict responses to complex modulators by incorporating a linear modulation filter. The modulation filter is introduced to account for differences in sensitivity across modulation frequency. To test this idea, we estimated the modulation filter from the responses to vowels, and compared the ANF responses to vowel modulators with predictions of the modified STM.
As in the companion paper on sinusoidal stimuli (Litvak et al., 2003a), the vowels were encoded as small modulations of a high-rate pulse train [Fig. 1(a)]. We assume that neural responses to a high-rate pulse train with a low modulation depth are similar to those elicited by the superposition of an ongoing, unmodulated DPT and a highly modulated pulse train (as might be produced by a CIS processor). This assumption is necessarily true if the same pulse carrier is used for both the DPT and the CIS stimulus. It may hold more generally if the time constant of the neural membrane is large compared to the intervals between DPT pulses. In either case, this scheme maps the amplitude of the CIS-type stimulus onto the modulation depth of the DPT. This scheme differs from a standard, high-rate CIS strategy in that (1) the unmodulated DPT is large and continuously present; (2) the modulation depths are always small (<15%); and (3) there is no envelope detector and no half-wave rectification of the input signal, so both positive and negative deflections of the acoustic waveforms are represented in the modulated pulse train.
FIG. 1.
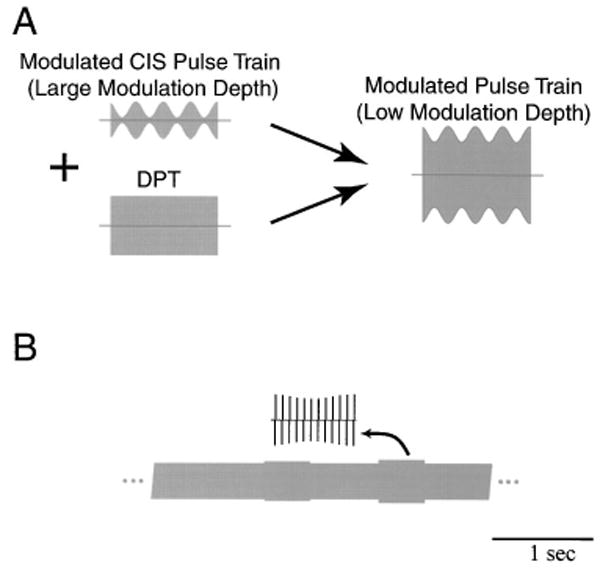
(a) Implementation of the DPT-enhanced stimulation strategy. The left panel shows two pulse train stimuli that might be generated by a cochlear implant processor: one, strongly modulated, is the CIS signal, and the other, unmodulated, is the DPT. We assume that the DPT-enhanced stimulus can be modeled by a carrier of the same frequency as the DPT that is more weakly modulated than the original CIS stimulus (right). (b) Schematic representation of the electric stimuli used in this study. The stimulus consists of a sustained DPT, which is modulated every second for 400 ms. The modulation waveform and/or modulation depth are changed on each successive modulated segment. The entire cycle of modulation waveforms and modulation depths repeats for up to 10 min.
II. METHODS
The animal preparation, electrical stimulation, and recording methods have been described in a companion paper (Litvak et al., 2003b). Briefly, cats were anesthetized with dial in urethane (75 mg/kg), then deafened by co-administration of kanamycin (subcutaneous, 300 mg/kg) and ethacrinic acid (intravenous, 25 mg/kg) (Xu et al., 1993). Two intracochlear stimulating electrodes (400 mm Pt/Ir balls) were inserted into the cochlea through the round window. One electrode inserted approximately 8 mm was used as the stimulating electrode. The return electrode was inserted just inside the round window. To minimize the possible effects of residual hearing in our preparation, we only report responses from neurons having no spontaneous activity in absence of a DPT [see Litvak et al. (2003b) for details].
Standard techniques were used to expose the auditory nerve via a dorsal approach and record from single fibers using glass micropipettes filled with 3M KCl (Kiang et al., 1965). For small modulation depths, most of the stimulus artifact could be removed online using a digital signal processor implementing a moving average filter whose length matched the 0.2-ms pulse period. Neural responses were also recorded digitally at a sampling rate of 20 kHz for off-line analysis. To remove the artifact from these records, we used an extension of the iterative method described in the companion paper for sinusoidal modulators (Litvak et al., 2003a). This modified method is described in Appendix A.
A. Stimuli
We conducted a neural population study by investigating responses to a single DPT level in each animal. The DPT level was set at 8–10 dB above the electric compound action potential threshold, so that a large fraction of the ANF population would respond to the DPT (Litvak et al., 2003b).
The DPT was a 5-kpps pulse train composed of biphasic (cathodic/anodic) pulses (25 μs per phase). In order to acquire responses to both the unmodulated DPT and to modulations of the DPT for several modulation waveforms and depths, the stimulus consisted of alternating modulated (400 ms) and unmodulated (600 ms) segments [Fig. 1(b)].1 Modulation depth and/or modulation waveform was changed on each successive modulated segment. Modulation waveforms were derived from synthetic vowels as described below. Modulation depth ranged from 0.5% to 15%. Modulation was applied such that the mean amplitude of the carrier pulses was the same during modulated and unmodulated segments. The entire sequence of modulated and unmodulated segments had a duration of 13–16 s, and was repeated continuously either for 10 min or until contact with a fiber was lost.
The modulation waveforms were derived from synthetic vowels having a 100-Hz fundamental frequency created by Assmann and Summerfield (1990) using a series formant synthesizer (Klatt, 1980). A single 10-ms period of each vowel was extracted, and digitally resampled at 40 kHz. From each vowel, two modulation waveforms were produced by filtering the vowel period into two frequency bands (0 to 500 Hz, and 500 to 1000 Hz). This filtering roughly mimics that performed by multi-channel cochlear implant processors. Although some of the vowels used by Assman and Summerfield (1990) had second formants as high as 2.2 kHz, we did not analyze formants above 1000 Hz because higher frequencies cannot be represented with a 5-kpps carrier pulse rate without significant aliasing. Filtering was accomplished by computing the discrete Fourier transform of the vowel period, zeroing the harmonics outside of the pass band, and then computing the inverse Fourier transform. The filtered vowel periods were concatenated to produce 400-ms modulators. Finally, only band-vowel combinations that contained at least one formant were investigated. Table I gives the characteristics of the four vowel-band combinations used in this study.
TABLE I.
Vowel stimuli used in this study. The fundamental frequency was 100 Hz. Band 1 refers to the frequency range 0–500 Hz, band 2 to 500–1000 Hz.
| Sound | Band | Formants | Waveform |
|---|---|---|---|
| /ɔ/ | 2 | F1 = 750 Hz |
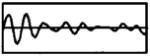
|
| /ɜ/ | 1 | F1 = 450 Hz |
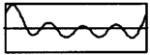
|
| /u/ | 1 | F1 = 250 Hz |
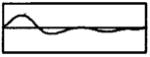
|
| /u/ | 2 | F2 = 850 Hz |
|
Two definitions of modulation depth were used to specify the amplitude of the vowel stimuli. In early experiments, modulation depth was defined based on the peak amplitude of the modulation waveform. Specifically, if e(t) represents a filtered vowel waveform, the DPT envelope was defined as A · (1 + m · e(t)/max(|e(t)|)), where m is the modulation depth and A is the amplitude of the unmodulated DPT. With this definition, the rms amplitude of the envelope can differ by 1.5 dB between vowels at a given modulation depth. In later experiments, we redefined modulation depth so as to equalize the rms amplitudes of the modulation envelopes across vowels. Specifically, for the first vowel in the sequence (the low-pass /ɔ/), modulation depth was set as above. The other vowels were then normalized so that, for a given modulation depth, the rms amplitude of each modulation waveform matched that of the first vowel. Specifically, the modulation envelope was defined as A · (1 + m · e(t) · K/rms(e(t))), where K is the ratio of rms to peak amplitude for the lowpass /ɔ/.
The differences between the two definitions of modulation depth are small compared to the variability in ANF responses for a given modulation depth. For example, for a 10% modulation depth based on rms amplitude, the actual modulation depths for the other vowels (under the original definition) would be 10.7%, 11.9%, and 11.1%. In fact, analysis of responses to vowel modulators revealed no consistent dependence of discharge rate on the definition of modulation depth. For the purpose of this paper, therefore, we pool the data from the two definitions together when describing population responses.
B. Data analysis
Responses collected during the unmodulated DPT segments were used to classify ANFs into two groups as in the companion paper (Litvak et al., 2003b). Some fibers exhibited only a transient response to the DPT, and adapted to a pseudo-spontaneous discharge rate near zero (<5 spikes/s) after a minute of DPT stimulation. We refer to these fibers as “transient DPT responders.” Fibers that responded throughout the unmodulated segments with a pseudo-spontaneous rate above 5 spikes/s are referred to as “sustained responders.”
In a normally functioning ear, each ANF represents the frequency components of the vowel stimulus close to its characteristic frequency in its temporal discharge patterns (Delgutte and Kiang, 1984; Young and Sachs, 1979). To determine whether the fine-time structure of vowels is also coded in responses to a modulated DPT, period histograms were computed locked to the 10-ms period of the vowel. To eliminate the effect of possible phase locking to the 5-kpps carrier, the histograms were computed using 0.2-ms bins. The magnitude and phase of the response to each vowel harmonic were determined from the discrete Fourier transform of the period histogram. If the period histogram is scaled to represent the instantaneous discharge rate in spikes/s, then each Fourier component also has units of spikes/s, and represents the synchronized rate, i.e., the average discharge rate multiplied by the synchronization index to that component (Young and Sachs, 1979).
To formally characterize the transformation between the modulation waveform and the neural response in the frequency domain, we estimated neural modulation transfer functions (MTFs). A MTF expresses, as a function of frequency, the complex ratio (magnitude and phase) of the modulation in the neural response to the modulation in the stimulus. Traditionally, MTFs are estimated from responses to sinusoidal modulators (e.g., Møller, 1974). At frequency fm, the MTF magnitude is twice the synchronization index of the response to a sinusoidal modulator at fm divided by the modulation depth of the stimulus, and the MTF phase is the mean phase of the response minus the phase of the stimulus. Alternatively, if the system behaves linearly, the MTF can be estimated directly from the Fourier transform of the period histogram for a complex stimulus (Møller, 1973; Møller and Rees, 1986). MTFs were estimated from responses to vowel modulators by computing, for each vowel harmonic, twice the ratio of the synchronization index at the harmonic frequency to the same component of the vowel's Fourier transform (e.g., Young and Sachs, 1979). In the case of sinusoidal modulators, this definition is identical to the traditional one. We used bootstrap techniques to derive confidence intervals for the MTF of each fiber (Efron and Tibshirani, 1993). These techniques allow confidence intervals to be determined for arbitrary functions of the data without requiring specific assumptions about the probability distributions of the data. Specifically, we resampled the spike times with replacement to generate 500 bootstrap replications of the spike train. The MTF was computed for each bootstrap spike train, and confidence intervals were estimated by determining, for each modulation frequency, a range that includes 99% of the bootstrap MTF values. To test the linearity assumption, we compared MTFs computed from responses of the same fiber to different vowel modulators. For a linear system, the MTF should be independent of the stimulus. We also compared the average MTF estimated from vowel responses to the estimates at three modulation frequencies (104, 417, and 833 Hz) based on responses to sinusoidal modulators described in the companion paper (Litvak et al., 2003a).
C. Stochastic threshold model
In a companion paper (Litvak et al., 2003a), we introduced a simple functional stochastic threshold model (STM) of ANF responses in the presence of a DPT (Fig. 2). The model takes as input the modulator waveform m(t), which is compared to a noisy threshold. A spike is produced by the model whenever m(t) crosses the threshold. The threshold is the sum of a deterministic term, which includes both an absolute and a relative refractory period, and a Gaussian noise term. In the absence of any input, the STM has a pseudo-spontaneous discharge rate which is determined by the ratio of the noise standard deviation σ to the resting threshold θ0. We showed that this model successfully predicts the dependence of threshold and dynamic range of responses to sinusoidal modulations on the pseudo-spontaneous discharge rate at a given modulation frequency. However, the model failed to account for the dependence of ANF sensitivity on modulation frequency. To account for this dependence, we introduce a linear modulation filter as a first stage of the model (Fig. 2). We will show that this filter can be estimated from ANF responses to complex modulators. Specifically, we will use neural MTFs derived from vowel responses to estimate the model's modulation filter.
FIG. 2.
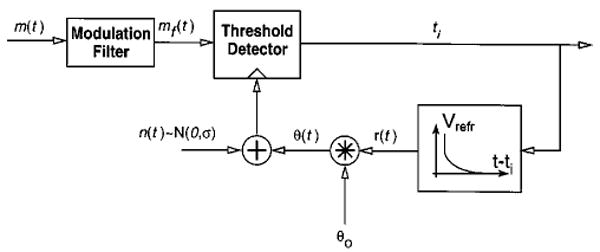
Block diagram of the stochastic threshold model for predicting ANF responses to arbitrary modulation waveforms applied to the DPT. The model takes as input the modulation waveform m(t), which is passed through a modulation filter. It produces a spike whenever the filtered input crosses a noisy threshold. The threshold is the sum of a Gaussian noise term n(t) and a deterministic term θ(t) which depends on the time since the previous spike. The model outputs the set of spike times {ti}. Free parameters of the model are the modulation filter, the resting threshold θ0, and the noise standard deviation σ.
Because the output of the STM is in the form of a spike train, the STM has an MTF which can be estimated using the same methods as for actual neural data. A necessary condition for using the neural MTF as an estimate of the STM's modulation filter is that the model's own MTF matches the underlying filter. We tested this assumption by computing MTFs from spike trains produced by the model in response to vowel stimuli. When the model's pseudo-spontaneous rate was set to 50 spikes/s, the model's empirical MTF differed in shape from the underlying modulation filter. However, if the model's pseudo-spontaneous rate was increased to 300 spikes/s, there was good agreement between the model MTF and the underlying modulation filter (not shown). For this reason, we used only data from ANFs with high pseudo-spontaneous rates (>130 spikes/s) in estimating the STM's modulation filter. Although such fibers form only a small fraction of our sample, we will show that the STM filter derived from responses of these fibers can also predict responses of fibers with lower pseudo-spontaneous rates.
After setting the STM's modulation filter, we computed model responses to vowel modulators with different modulation depths, and compared them to ANF responses to a modulated DPT. The modulation filter was applied directly in the frequency domain for each harmonic of the stimulus; therefore the model in its present form can only predict responses to periodic stimuli with a 100-Hz fundamental. The model was simulated using 0.2-ms time steps.
III. RESULTS
Our results are based on 36 responses recorded from 31 ANFs in four cats to DPTs modulated by vowels. Each record was composed of responses to four filtered vowels at four or five modulation depths ranging from 1% to 15%. In 17 of these records, the fiber responded to the DPT at a rate exceeding 5 spikes/s throughout the stimulus duration; in the other 19 records, the fibers stopped responding to the unmodulated DPT after 1–2 min of stimulation, although it still responded to modulations of the DPT. The percentage of transient responses in this data set (53%) did not significantly differ (p = 0.26, binomial exact test) from the 46% found in a larger data set from ten animals (Litvak et al., 2003b).
A. Temporal discharge patterns
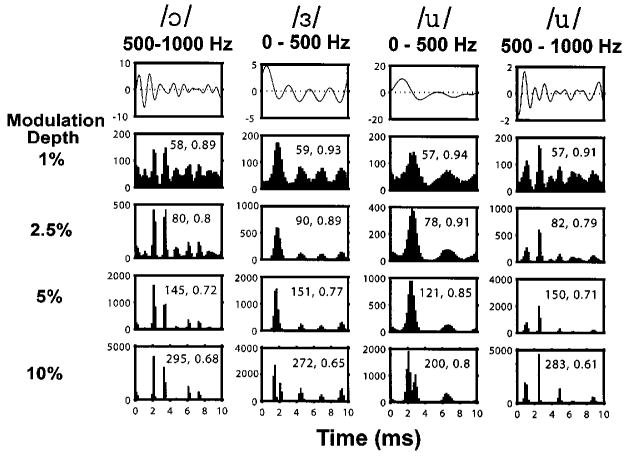
Figure 3 shows period histograms computed from the responses of one fiber to each of the four filtered-vowel modulators at four different modulation depths. During the unmodulated DPT segments, this sustained responder had a pseudo-spontaneous discharge rate of 28 spikes/s. For all modulation depths, the period histograms broadly resemble the modulation waveforms. In particular, modes in the period histograms match peaks of the modulation waveform. The intervals between peaks in the modulation waveforms are related to the vowel formant frequencies. This result suggests that, with a DPT, the responses to modulated vowels code the vowel formant frequencies.
FIG. 3.
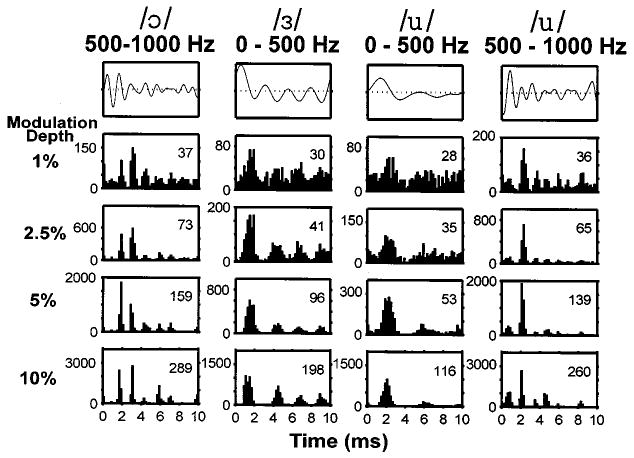
Period histograms of responses to vowel modulators for a sustained DPT responder (pseudo-spontaneous rate: 28 spikes/s). Top row: waveforms of the four filtered vowel modulators. Lower four rows: Period histograms of responses to each vowel for four modulation depths. The ordinate in each panel is in spikes/s. The numbers in each panel indicate the average discharge rate during the vowel modulator in spikes/s.
Although the peaks of the modulation waveform are represented for all modulation depths, the best resemblance between the modulation waveform and the period histograms occurs for modulation depths below 5%. For example, the time between the two largest peaks in the waveform of the filtered /ɔ/ is 1.2 ms. This interval matches the distance between the two largest modes of the corresponding period histogram for modulation depths between 1% and 5%, but not for 10% where the interval between modes increases to 1.4 ms. Similar distortions can be seen in responses to the vowel /u/. In addition, some of the smaller peaks in the modulation waveform are only represented at the lower modulation depths.
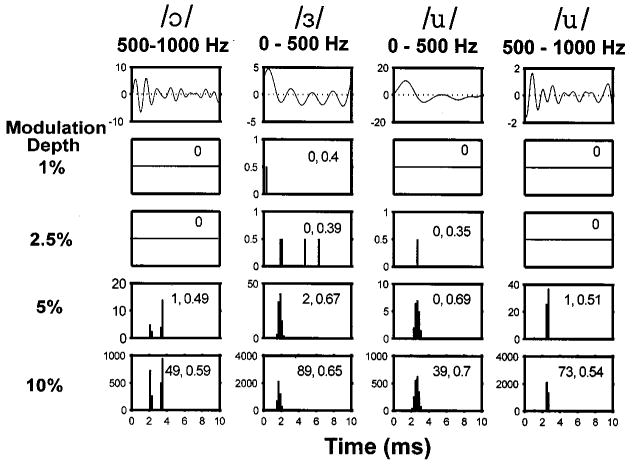
In contrast to sustained DPT responders, transient responders poorly represented the complex modulation waveforms. Figure 4 shows the response of a fiber that responded only transiently to the unmodulated DPT. The fiber did not respond significantly to the vowel modulator for modulation depths below 5%. This observation is consistent with the lower sensitivity of transient DPT responders to sinusoidal modulations (Litvak et al., 2003a). At modulation depths of 5% and 10%, the fiber did respond with high synchrony to the modulator, but spikes occurred almost exclusively in response to the largest peak in the modulation waveform. One exception is the response to the second largest peak for the filtered vowel /ɔ/ at 5% modulation. These responses resemble responses to vowels presented electrically without a DPT (van den Honert and Stypulkowski, 1987; Knauth et al., 1994).
FIG. 4.
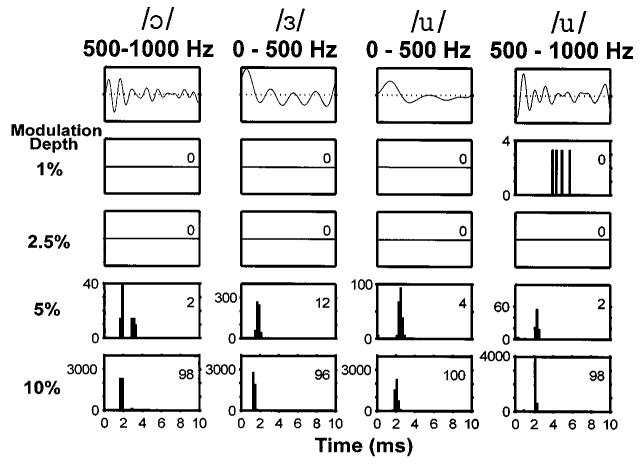
Period histograms of responses to the vowel modulators for a transient DPT responder (pseudo-spontaneous rate: 0 spike/s). Same format as in Fig. 3.
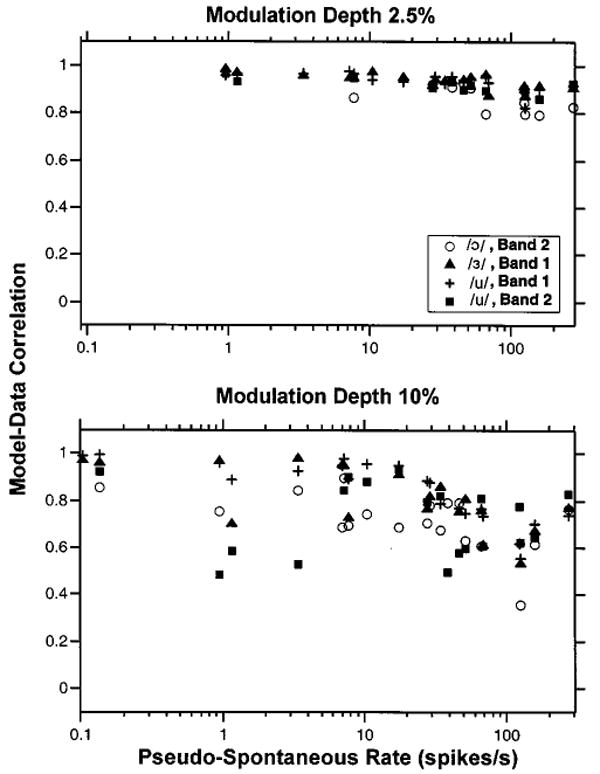
To quantify the resemblance between the modulation waveform and the period histogram of ANF responses, we computed the correlation coefficient between the two. To account for possible neural delay, the modulation waveform was shifted successively in steps of 0.2 ms (up to 2 ms), until the largest stimulus-response correlation was obtained. Figure 5 shows the maximum stimulus–response correlation against pseudo-spontaneous discharge rate for modulation depths of 2.5% (top) and 10% (bottom). At 2.5% modulation, all but two responses from sustained DPT responders (pseudo-spontaneous rates above 5 spikes/s) had correlations above 0.6, with a median correlation of 0.79, implying excellent representation of the vowel waveform. In contrast, transient DPT responders tended to have lower correlations (median 0.65). The difference in correlation between transient and sustained responders is significant [p<0.001, permutation test (Good, 2000, p. 37)]. At 10% modulation depth, the correlation for both sustained and transient responders was lower (median 0.55) than at 2.5% depth, and the difference between the two depths is highly significant (p<0.001, permutation test). At this higher modulation depth, correlations for transient and sustained responders were more similar. Thus, the representation of the vowel waveform in the ANF temporal discharge patterns is better at the 2.5% modulation depth than at the 10% modulation depth, and, at the lower modulation depths, better in sustained responders than in transient responders.
FIG. 5.
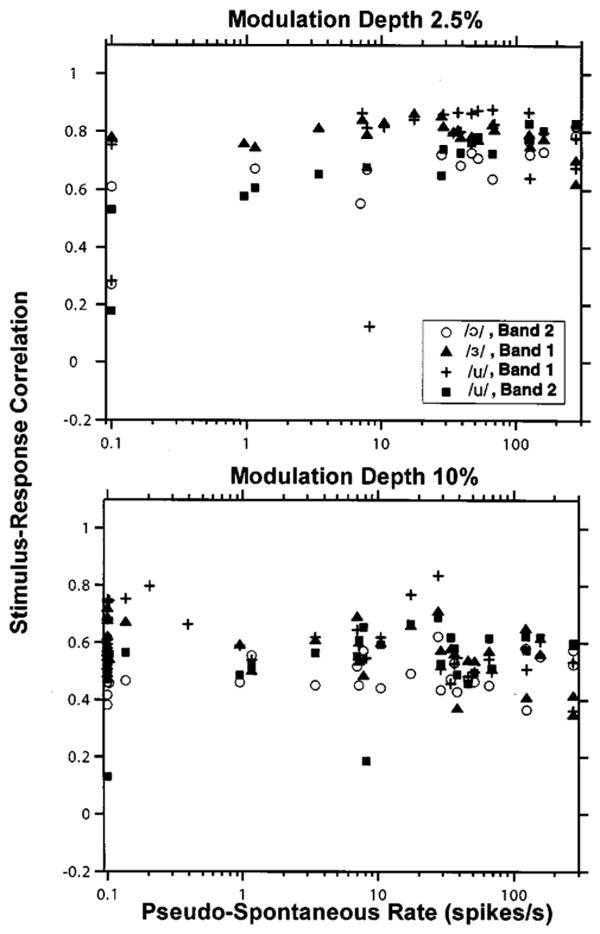
Maximum correlation coefficient between the period histogram of ANF responses and the vowel waveform as a function of pseudo-spontaneous rate for 2.5% (top) and 10% (bottom) modulation depths. Symbols code the correlation coefficients for each vowel. Data are only included if the response contains at least ten spikes and the bootstrap 90% confidence intervals for the correlation coefficient are below 0.1.
B. Representation of formant frequencies
The high correlations of responses to vowel modulators with the stimulus waveform at low modulation depths strongly suggest, but do not directly show, that the spectral peaks of the modulation waveform are well represented in the temporal discharge patterns. In the case of vowels, these spectral peaks correspond to formant frequencies, which are important cues for vowel identification (Peterson and Barney, 1952). To determine whether the spectral peaks of the modulation waveform are accurately represented in the ANF temporal patterns, we computed the discrete Fourier transform of the period histogram (Young and Sachs, 1979). Transforms were computed from histograms containing two stimulus cycles. Because neural responses to the periodic vowels contain both a stimulus-locked, periodic component and an aperiodic, noise component, the amplitudes of the Fourier components located between vowel harmonics (i.e., at odd multiples of 50 Hz) give a measure of the noise floor (Young and Sachs, 1979).
Magnitude spectra of individual fiber responses depended strongly on the pseudo-spontaneous discharge rate. While there were notable differences in the shape of the spectrum between transient and sustained DPT responders, within each group the spectra were more similar. Figure 6 shows the average magnitude spectra for both bands of the vowel /u/ [0–500 Hz (left) and 500–1000 Hz (right)] at two modulation depths (2.5% and 10%). Separate averages were computed for transient (top) and sustained (bottom) responders. Average spectra for the other two vowels showed the same general trends, and are not shown.
FIG. 6.
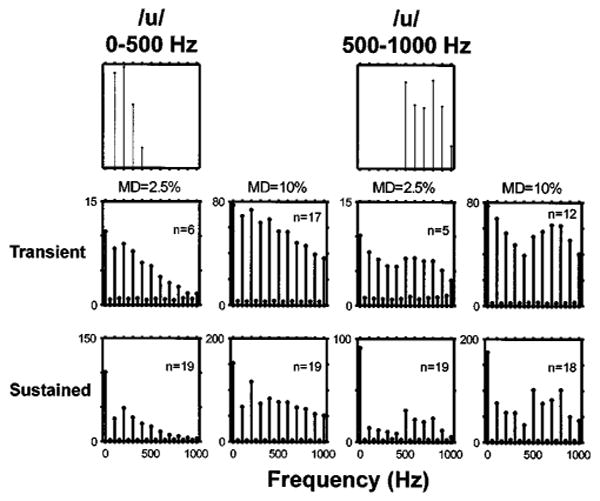
Average of period histograms for two vowel modulators. The top row shows the spectra of the two vowels. Peaks in these spectra occur at the harmonics of the 100-Hz fundamental that are closest to the a formant frequency: 200 Hz for low-pass /u/, and 800 Hz for high-pass /u/. The bottom two rows show the average spectra of period histograms in response to both vowels for modulation depths of 2.5% (left) and 10% (right). The spectra were averaged separately for transient DPT responders (pseudo-spontaneous rates below 5 spikes/s; middle row), and sustained responders (bottom row). Numbers in each panel indicate the number of fibers whose responses are included in the average. Responses had to contain at least ten spikes to be included. The ordinates of each panel are in spikes/s.
In general, peaks in the average response spectra for sustained DPT responders qualitatively match those in the stimulus spectrum. In particular, a first-formant peak at 200 Hz is apparent in responses to the low-pass /u/ at both modulation depths, and a local maximum at 800 Hz gives a representation of the second formant for the high-pass /u/. However, at both modulation depths, the response spectra show components well above the noise floor at frequencies for which the stimulus contains no energy (above 500 Hz for low-pass /u/, and below 500 Hz for high-pass /u/), indicating a nonlinear transformation between the stimulus and the response. These distortion components are particularly apparent at the higher modulation depth. Part of the nonlinearity may just be half-wave rectification, which is clearly apparent in the period histograms of Fig. 3.
The average response spectra for transient DPT responders gave a poorer representation of the stimulus spectra than those of sustained responders. Although there is a small local maximum at 200 Hz for the low-pass /u/ at both modulation depths, it barely exceeds the noise floor. For the high-pass /u/ there may be a small second-formant-related peak near 800 Hz at 10% modulation depth, but not at 2.5% depth. However, for both stimuli and both modulation depths, the presence of the peaks well above the noise floor at the harmonics of the fundamental indicates that the response is locked to the fundamental frequency. For the high-pass /u/, the largest non-dc component of the average spectrum is the fundamental frequency. Thus, transient DPT responders represent primarily the fundamental in their temporal discharge patterns.
C. Representation of fundamental frequency
Because analyses based on period histograms require that the stimulus period be known, they cannot be used to directly test how well the vowel fundamental is represented in ANF temporal discharge patterns. Arbitrary response periodicities can be revealed using all-order interval (a.k.a. autocorrelation) histograms (Cariani and Delgutte, 1996a, b; Møller, 1970). We computed the autocorrelation histograms of individual fibers, and then summed them over the entire fiber population (including both transient and sustained responders) to create “pooled” autocorrelation histograms. Figure 7 shows the pooled autocorrelation histograms for both filtered /u/ stimuli at modulation depths of 2.5% (middle row) and 10% (bottom row). Autocorrelation histograms for the other two vowels show the same general trends and are not shown.
FIG. 7.
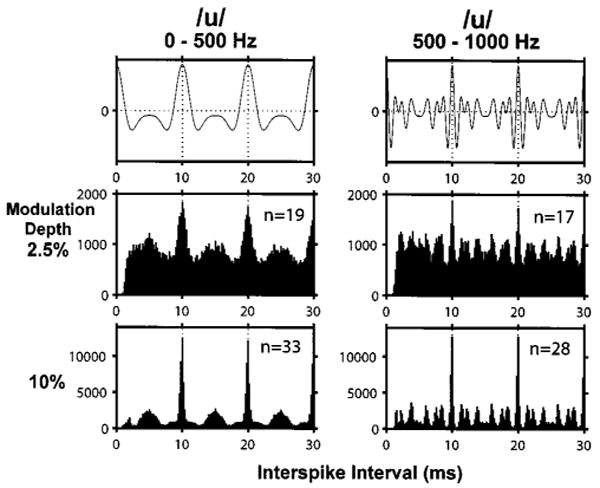
Pooled autocorrelation histograms for two vowel modulators. The top row shows the autocorrelation functions of both vowels. Dashed lines show multiples of the stimulus period. The bottom two rows show pooled autocorrelation histograms of the electric responses for modulation depths of 2.5% (middle row) and 10% (bottom row). Numbers in each panel indicate the number of fibers whose responses were included in the pooled autocorrelation histogram. Responses had to contain at least ten spikes to be included. Ordinates in each panel are numbers of intervals per bin.
All pooled histograms have a pronounced mode at the vowel period of 10 ms, suggesting that the fundamental is robustly coded in the temporal patterns of ANF responses. In addition, the fine structures of the histograms are very different for the two stimuli. The smaller modes in the histogram match peaks in the autocorrelation function of the filtered vowel waveform (top row). Because minor peaks in the stimulus autocorrelation are related to formants, this result shows that the pooled autocorrelation histogram codes the formant frequencies in its pattern of secondary peaks. A similar result has been reported for pooled autocorrelation histograms computed from ANF responses to vowels presented acoustically (Cariani and Delgutte, 1996a, b).
D. Linearity of responses
The modulation transfer function (MTF) is defined as the ratio of modulation in the neural response to the modulation of the stimulus. Traditionally, MTFs are measured using sinusoidal modulators (e.g., Møller, 1974; Delgutte et al., 1998). However, for a system that is nearly linear, the MTF can in principle also be estimated using complex, periodic modulators that contain several frequency components. We tested the linearity assumption by computing MTFs from responses to different vowels. In a linear system, the MTF estimate should be independent of the modulator waveform used to estimate it.
Figure 8 shows the MTFs estimated from responses to vowels at 1% modulation depth for six ANFs, three with pseudo-spontaneous rates below 130 spikes/s (left), and three with rates above 130 spikes/s (right). Estimates based on responses to different vowels are denoted by different symbols. For each vowel, the MTF can only be estimated for frequencies at which the modulator has spectral energy.
FIG. 8.
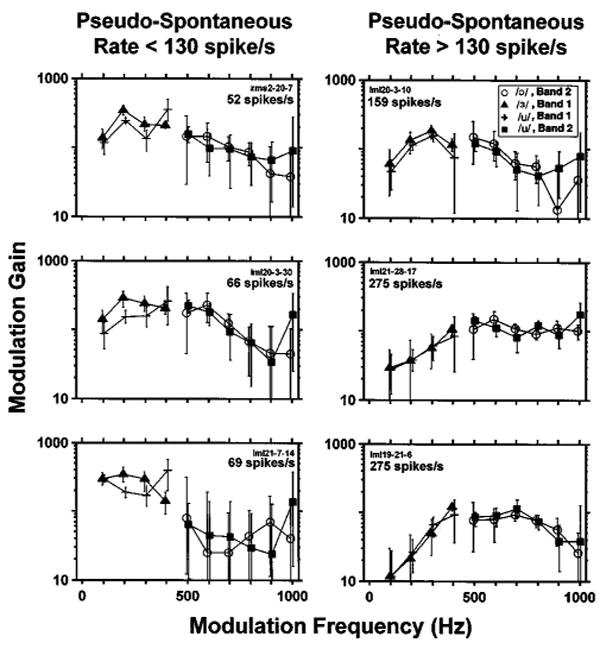
Neural MTFs estimated from responses to vowel modulators at 1% modulation depth for three fibers with pseudo-spontaneous rates below 130 spikes/s (left), and three with pseudo-spontaneous rates above 130 spikes/s (right). Each panel shows the neural MTF magnitudes estimated from responses of one fiber whose pseudo-spontaneous rate is indicated inside the panel. Symbols code estimates based on different vowels. The MTF could only be estimated at frequencies for which the vowel stimulus has energy. Error bars represent the 99% confidence intervals computed by bootstrapping ANF spike trains (see Sec. II). For the three fibers on the right, the intrinsic periodicities (defined as the inverse of the largest mode in the interval histogram of responses to the unmodulated DPT) were, from top to bottom, 234, 537, and 383 Hz.
For this 1% modulation depth, the modulation gain of all fibers is strikingly large, exceeding 100 at frequencies near 400–500 Hz. This means that a stimulus with a 1% modulation depth produces a fully modulated response, consistent with our earlier observations for sinusoidal modulators (Litvak et al., 2003a).
MTFs computed from responses of fibers with pseudo-spontaneous discharge rates above 130 spikes/s (right panels in Fig. 8) are nearly independent of the vowel used to compute the MTF. This can be seen from the overlapping confidence intervals for the different vowels. The independence of the MTF from the vowel stimulus is consistent with the linearity assumption. However, there are statistically significant differences in MTFs across fibers.
For fibers with pseudo-spontaneous discharge rates below 130 spikes/s (Fig. 8, left column), MTF estimates clearly depend on the vowel stimulus. These responses are not consistent with linearity. The most noticeable nonlinearity is half-wave rectification, which is apparent in period histograms (e.g., Fig. 3). The dependence of MTF shape on stimulus spectrum does not necessarily imply that a model that includes a linear modulation filter cannot predict the responses of these fibers if the model also includes nonlinear elements (as the STM does). The data do show, however, that neural MTFs cannot be used to estimate the model's modulation filter when the pseudo-spontaneous rate is below 130 spike/s.
Figure 9 shows the magnitude and the phase of the average MTF computed from the responses of all fibers with pseudo-spontaneous rates above 130 spikes/s. The average MTF obtained by combining responses to all the vowels (solid lines) resembles the MTFs obtained by averaging data from each individual vowel (symbols) over each half of the spectrum, except at 1000 Hz. The average MTF magnitude has a bandpass shape, with a center frequency near 400–600 Hz, and a steeper cutoff on the low-frequency side than on the high-frequency side. The stars show the MTF magnitudes estimated at three frequencies from responses to sinusoidal modulators described in the companion paper (Litvak et al., 2003a). These sinusoid-based estimates follow the general shape of the vowel-based MTF, although with a slightly higher gain. The lower modulation gain with vowel stimuli may reflect the synchrony suppression known to result from half-wave rectification of complex waveforms (Greenwood, 1986). The MTF phase shown in the bottom of Fig. 9 is approximately linear for frequencies between 200 and 1000 Hz, indicating a constant group delay of 700 μs.
FIG. 9.
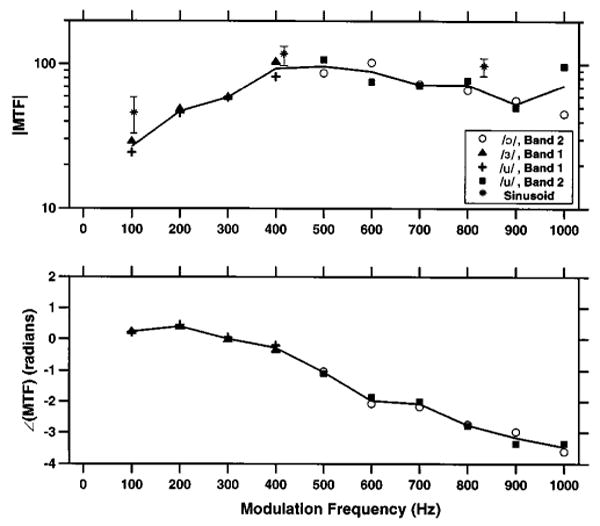
Magnitude (top) and phase (bottom) of the average neural MTF estimated from responses to vowel modulators with 1% modulation depth. The black solid line shows the grand average MTF, which was computed by averaging individual MTFs across the four vowel modulators for ANFs with pseudo-spontaneous rates above 130 spikes/s. The symbols show the average MTF based on responses to individual vowels. The stars indicate the average, and the error bars 99% confidence intervals of the MTF magnitude estimated from responses to sinusoidal modulators with 1% modulation depth (Litvak et al., 2003a).
E. Predictions of the stochastic threshold model
In a companion paper (Litvak et al., 2003a), we introduced a stochastic threshold model (STM) for predicting responses of ANFs in the presence of a DPT. We showed that the STM successfully predicts many aspects of the responses to sinusoidal modulations of the DPT. Here, we examine whether the STM can also predict responses to complex modulators by comparing measured and model responses to vowel modulators.
The parameters of the STM are the resting threshold θ0, the noise standard deviation σ, and the modulation filter. The threshold-to-noise ratio θ0 / σ specifies the pseudo-spontaneous discharge rate. To use the STM with arbitrary stimulus waveforms, both the modulation filter and σ must be specified. We chose the average neural MTF shown by the solid lines in Fig. 9 as the modulation filter. The noise amplitude σ was set to 1.7 in order to match the MTF gain of a model fiber with a pseudo-spontaneous rate of 300 spikes/s with the gain of the neural MTF in Fig. 9 at 400 Hz.
Figure 10 shows the period histograms of responses of a model fiber with a pseudo-spontaneous rate of 50 spikes/s to all four vowel modulators for modulation depths ranging from 1% to 10%. The predicted period histograms have many features in common with measured histograms for sustained DPT responders (Fig. 3). Both encode the peaks of the modulator waveform as modes of the period histogram. The locations and the numbers of major peaks are similar in measured and model histograms. Moreover, the correlations between the vowel waveform and the model response (second number inside each panel) are in the range observed for ANF sustained responders (Fig. 5). For both model and neural responses, the greatest correlations and the smallest discharge rates are observed for the low-pass /u/. However, the stimulus-response correlations are somewhat lower for the data than for the model at the higher modulation depth.
FIG. 10.
Period histograms of responses of a model fiber with a high pseudo-spontaneous rate (50 spikes/s, θ0 / σ = 2.2) to the vowel stimuli. Same format as in Fig. 3. The second number in each panel represents is the stimulus-response correlation as defined as in Fig. 5, while the first number is the average discharge rate during the vowel stimulus.
Figure 11 shows the responses of a model fiber with a pseudo-spontaneous rate near 0 spikes/s to the four vowel modulators. The responses of this model fiber to vowel modulations resembles those of transient DPT responders (e.g., Fig. 4). Both the model fiber and transient DPT responders require large modulation depths to produce a response. For both the model and neural data, responses tend to occur only at the largest peak of the vowel waveform. These responses, therefore, are most accurate in representing the fundamental and poorly represent the formant frequencies. However, responses of both the model fiber and the transient DPT responder do represent the two largest peaks of the high-passed /ɔ/.
FIG. 11.
Period histograms of responses of a model fiber with a low pseudo-spontaneous rate (0.0014 spikes/s, θ0 / σ = 5) to the vowel stimuli. Same format as in Fig. 10.
To quantify how well the STM predicts the temporal discharge patterns of ANFs in response to vowel modulators, we computed the correlation coefficient between the period histogram of the neural response and the period histogram predicted by the STM. The STM was fit to each fiber by adjusting the threshold θ0 so as to match the model fiber's pseudo-spontaneous rate to the data. Figure 12 shows the correlation between measured and model responses for modulation depths of 2.5% (top) and 10% (bottom) against the pseudo-spontaneous rate. Larger modulation depths were used for this correlation analysis than the 1% depth used for estimating the modulation filter because the higher discharge rates at higher modulation depths allow more accurate estimates of the period histograms and, therefore, the correlations. For both modulation depths, the model–data correlations are high, significantly better than the stimulus–response correlations in Fig. 5 (p<0.001, permutations test). For the lower modulation depth, the median model–data correlation is 0.93. Although the modulation filter was estimated from responses of fibers with pseudo-spontaneous rates above 130 spikes/s, the correlations at the lower modulation depth are nearly independent of pseudo-spontaneous rate. This result, as well as the ability of the STM to improve correlation, suggests that the model captures some of the nonlinearities in the neural responses. The correlations are somewhat lower for the 10% modulation depth (median 0.78). Thus, the STM is best at predicting responses to low modulation depths, which are likely to be more linear.
FIG. 12.
Correlation coefficient between the period histograms of STM responses to vowel modulators and those of ANF responses as a function of pseudo-spontaneous discharge rate for modulation depths of 2.5% (top) and 10% (bottom). Each data point shows the correlation coefficient between the period histogram for one ANF and the histogram for a model fiber having the same pseudo-spontaneous rate. To account for differences in neural delay across fibers, we allowed a ±0.4-ms shift between the two responses. Symbols code responses to different vowels. Data are only included if the response contains at least ten spikes and the bootstrap 90% confidence intervals for the correlation coefficient are below 0.1.
IV. DISCUSSION
A. Representation of vowel modulators in ANF responses
In response to filtered vowels, auditory-nerve fibers that gave sustained responses to the unmodulated DPT had complex period histograms whose modes matched peaks in the modulation waveform. Fourier and autocorrelation analyses revealed that sustained responders represent both the fundamental and the formant frequencies in their temporal discharge patterns. Because peaks in the vowel waveform can differ substantially in amplitude, only neurons with a wide dynamic range would be able to simultaneously represent several of these peaks in their temporal discharge patterns. The ability of sustained DPT responders to represent the entire vowel waveform is therefore consistent with the relatively wide (17–23 dB) dynamic range demonstrated previously using sinusoidal modulators (Litvak et al., 2003a).
The closest resemblance between the period histograms of sustained responders and vowel waveforms occurred for modulation depths below 5%. At larger modulation depths, the period histogram showed distortions in the representation of the fine-time structure. In addition, for modulation depths above 5%, the average discharge rates could exceed those seen acoustically.
As with sinusoidal stimuli, the representation of vowels is more accurate in sustained DPT responders than in transient responders. A typical response pattern for a transient DPT responder is a single spike per stimulus period occurring at the modulator peak. For the modulation depths studied, transient DPT responders are poor at representing the formant frequency. They do, however, accurately represent the fundamental. Responses of transient DPT responders resemble responses to vowels presented electrically without a DPT (Knauth et al., 1994; van den Honert and Stypulkowski, 1987).
Reproducing the exact spatio-temporal pattern of ANF activity in a healthy ear in response to acoustic stimuli would require an ability to stimulate narrower portions of the cochlea than is possible with current cochlear implants. However, because the pooled autocorrelation histogram of responses to complex modulators resembles the autocorrelation of the stimulus, reproducing the pooled interspike interval distribution of acoustic responses may be achievable through manipulation of the modulation waveform in a DPT-enhanced strategy. It remains to be seen whether implanted subjects can make use of such interspike interval information.
B. Modulation transfer functions
We have hypothesized that responses of sustained responders to low modulation depths can be characterized by a linear relationship between the modulation waveform and the period histogram. We tested the linearity assumption by estimating neural MTFs for individual fibers using responses to different vowels. Under linearity, the estimated MTF should be independent of the vowel used to derive the estimate. We found that, for a modulation depth of 1%, linearity held for the small fraction of fibers with pseudo-spontaneous rates above 130 spikes/s. As expected, linearity did not hold as well for fibers with lower pseudo-spontaneous rates. Because these responses showed significant half-wave rectification even at 1% modulation depth (e.g., Fig. 3), it is possible that linearity would hold for a larger number of fibers at smaller modulation depths. However, accurately measuring period histograms to smaller modulations would require very long data collection times.
While consistent with linearity, MTFs estimated from fibers with pseudo-spontaneous rates above 130 spikes/s differed somewhat from one fiber to the next. We have previously reported that fibers with high pseudo-spontaneous rates tend to have preferred interspike intervals in response to the DPT, and that these intrinsic periodicities interact with periodicities in the modulation waveform in determining responses to modulations of a DPT (Litvak et al., 2003a,b). One possibility is that these intrinsic periodicities, which differ from fiber to fiber, may be partly responsible for differences in MTFs among fibers with high pseudo-spontaneous rates. Since synchrony to a sinusoidal modulator is highest when the modulation period coincides with the intrinsic period (Litvak et al., 2003a), this hypothesis predicts that the MTF gain should be above average when the modulation period coincides with the intrinsic period. Qualitative analysis of three fibers with pseudo-spontaneous rates above 130 spikes/s suggests that this may indeed be the case (see caption of Fig. 8). However, we do not have sufficient data to conclusively test this hypothesis.
The average neural MTF estimated from the responses of fibers with pseudo-spontaneous rates above 130 spikes/s had approximately the same frequency dependence as the average modulation gain at three frequencies for the sinusoidal modulators investigated in the companion paper (Litvak et al., 2003a). The estimated MTF showed a bandpass characteristic (passband 400–600 Hz). In the passband, the modulation gain was extremely high (near 100), meaning that a stimulus with 1% modulation depth produces a fully modulated response. Above the passband, the response dropped off very gently with frequency, suggesting that, with a DPT, ANFs could represent formant frequencies in their temporal discharge patterns up to at least 1000 Hz.
The neural mechanisms responsible for the bandpass characteristic of the MTFs are unclear. The high-frequency drop off is consistent with low-pass filtering in the neural membrane. Adaptation of electric responses (Dynes and Delgutte, 1992; Killian, 1994; Litvak et al., 2003a) may cause the drop in the magnitude of the MTF for very low frequencies (Delgutte et al., 1998). Another mechanism for the low-frequency drop off may be a partial excitation block for high-frequency stimulation. For example, Litvak et al. (2001a) noted that modulation of a 5-kpps carrier often produced an increase in discharge rate, even though the peak amplitude of the modulated pulse train was the same as that of the unmodulated carrier, and therefore the rms amplitude of the modulated stimulus was lower. The mechanism for excitation block was hypothesized to be the interaction between the dynamics of sodium channels and high-frequency stimulation. One possibility is that the sodium inactivation gate is never able to recover with high-frequency stimulation.
C. Stochastic threshold model
In the companion paper (Litvak et al., 2003a), we showed that the stochastic threshold model (STM) quantitatively predicts many features of single ANF responses to sinusoidal modulations of a DPT, including growth of synchrony and discharge rate with modulation depth, and the dependence of modulation threshold and dynamic range on pseudo-spontaneous rate. In order to extend the STM to arbitrary modulation waveforms, a modulation filter needs to be specified for the model. Because responses to sinusoidal modulators were only measured at three modulation frequencies, these data did not allow us to estimate the modulation filter with sufficient resolution. However, we determined that the modulation filter can be estimated directly from responses to vowel modulators. This approach assumes that (1) the system behaves linearly and that (2) the measured MTF accurately reflects the shape of the underlying modulation filter. We tested the linearity assumption and found that it held for 1% modulation depth in fibers with pseudo-spontaneous rates above 130 spikes/s. To test the second assumption, we measured the MTF of the STM and compared it to its modulation filter. We found that, for fibers with high pseudo-spontaneous rates, the measured MTFs from model fibers resembled the modulation filter. This result confirms that, if the STM is applicable to the responses of ANFs, then the modulation filter can indeed be estimated from measured neural MTFs.
With the modulation filter of Fig. 9, the STM approximately predicted the shapes of period histograms in response to vowel modulators. At a modulation depth of 2.5%, the median correlation coefficient between neural and model period histograms was 0.93. Interestingly, the model was as successful at predicting responses of fibers with low pseudo-spontaneous rates as those of fibers with high pseudo-spontaneous rates, even though only data from the latter were used in deriving the model's modulation filter. This finding suggests that the model captures some of the nonlinearities in the neural response, including half-wave rectification. However, model predictions were poorer for 10% modulation depth than for 2.5% depth. Responses of ANFs to stimuli with large modulation depths are strongly influenced by the fiber's refractory properties because these stimuli drive the fiber at high discharge rates. By adjusting the refractory characteristics of the model to better fit those of ANFs, it might be possible to make the STM better approximate the responses at large modulation depths.
It is worth emphasizing that the STM does not explicitly represent the DPT. The input to the model is the modulation waveform, not a modulated DPT, and the effect of the DPT is only mimicked by adjusting the resting threshold so as to set the model's pseudo-spontaneous rate. The success of this very simple model in predicting responses to complex stimuli further supports the argument made in the companion paper (Litvak et al., 2003a) that the exact details of a DPT may not be essential in improving stimulus coding in temporal discharge patterns of ANFs, so long as it evokes a sustained pseudo-spontaneous discharge rate and the stimulus is a small signal compared to the DPT.
Our results suggest that, with the estimated modulation filter, and at least for small modulation depths, the STM can accurately predict the discharge probability of ANFs for arbitrary modulator waveforms. The predictive capability of the STM makes it a useful tool for investigating the psycho-physics of electric hearing. In particular, the STM can be useful in interpreting psychophysical responses of human cochlear implant subjects to small stimuli superimposed upon a large DPT. The STM could also be useful for modeling responses of neurons in the central nervous system to electric stimulation, where a model of activity in the auditory nerve inputs is necessary.
V. CONCLUSION
Together, the results of this paper and its companions (Litvak et al., 2003a, b) show that a desynchronizing pulse train can improve the representation of both sinusoidal and complex stimuli in the temporal discharge patterns of auditory-nerve fibers that have a sustained response to the DPT. While these results are encouraging, it is not possible to predict the behavioral consequences of this improved representation from single-unit experiments alone. Key unanswered questions include whether a DPT could be safe yet stimulate a sufficient number of ANFs to make a difference, and whether the central nervous system would be able to make use of the more natural temporal information provided by a DPT. The present work provides physiological guidelines for designing DPT-enhanced stimulus strategies whose efficacy can be tested by psychophysical experiments in implanted subjects. Whatever their clinical outcome, such experiments will certainly provide clues as to how the temporal information available in the auditory nerve is processed by the central nervous system.
Acknowledgments
The authors would like to acknowledge tireless efforts of Leslie Liberman without whose surgical skills this work would be impossible. We also thank Z. M. Smith for assistance with data collection, and K. M. Brinsko for help in figure preparation. This work was supported through W. M. Keck Foundation and NIH Grant Nos. DC00361, DC02258, and N01-DC-6-210.
APPENDIX A: ARTIFACT REJECTION METHOD
To remove the artifact in response to vowel modulators, we used a generalization of the method used for sinusoidal modulators in the companion paper (Litvak et al., 2003a). Briefly, the recorded microelectrode signal was first processed through a low-pass digital filter (3 kHz cutoff) to remove the linear component of the stimulus artifact. The remaining artifact was significantly below the spikes for most responses except at the largest modulation depth (10%–15%). To further cancel the residual artifact, we used an iterative algorithm to find the closest fit between the filtered, recorded signal and a model signal consisting of the sum of synthetic spikes and a periodic artifact template composed of N harmonics of the stimulus period (see Litvak et al., 2003a for details). This periodic template was subtracted from the recorded waveform to derive the estimated spike train.
Because the stimuli used in this study are more complex than the sinusoids used in the companion paper, the number of harmonics N in the artifact template had to be increased from 3 to 16. Because some of these harmonics lie in the 1–2-kHz frequency region where spikes have most of their energy, the derived artifact template could in principle include the spike waveform as well as the artifact proper if the response is highly synchronized. To detect whether this condition occurred, we simultaneously monitored the estimated spike waveforms, the artifact template, and the difference between the artifact template and the scaled artifact template estimated from the responses to the same stimulus at half the modulation depth. A record was accepted if either the estimated artifact was at most one-third of the peak spike amplitude, or the difference between the artifact templates at both modulation depths did not contain any spikes.
Footnotes
Portions of this work were presented as a poster at the ARO Midwinter Meeting in St. Petersburg Beach, FL, 2001 and the CIAP Conference in Monterey, CA, 2001.
To expedite data collection, in later experiments we shortened the duration of the unmodulated segments to 300 ms when the preceding modulated segment had a modulation depth below 2.5%, and therefore produced low discharge rates.
Contributor Information
Leonid Litvak, Eaton-Peabody Laboratory and Cochlear Implant Research Laboratory, Massachusetts Eye and Ear Infirmary, 243 Charles Street, Boston, Massachusetts 02114 and Speech and Hearing Bioscience and Technology Program, Massachusetts Institute of Technology, 77 Massachusetts Avenue, Cambridge, Massachusetts 02139.
Bertrand Delgutte, Eaton-Peabody Laboratory, Massachusetts Eye and Ear Infirmary, 243 Charles Street, Boston, Massachusetts 02114 and Research Laboratory of Electronics, Massachusetts Institute of Technology, 77 Massachusetts Avenue, Cambridge, Massachusetts 02139.
Donald Eddington, Cochlear Implant Research Laboratory, Massachusetts Eye and Ear Infirmary, 243 Charles Street, Boston, Massachusetts 02114 and Research Laboratory of Electronics and Neural Prosthesis Research Center, Massachusetts Institute of Technology, 77 Massachusetts Avenue, Cambridge, Massachusetts 02139.
References
- Assmann PF, Summerfield Q. Modeling the perception of concurrent vowels: vowels with different fundamental frequencies. J Acoust Soc Am. 1990;88:680–697. doi: 10.1121/1.399772. [DOI] [PubMed] [Google Scholar]
- Cariani PA, Delgutte B. Neural correlates of the pitch of complex tones. I. Pitch and pitch salience. J Neurophysiol. 1996a;76:1698–1716. doi: 10.1152/jn.1996.76.3.1698. [DOI] [PubMed] [Google Scholar]
- Cariani PA, Delgutte B. Neural correlates of the pitch of complex tones. II. Pitch shift, pitch ambiguity, phase invariance, pitch circularity, rate pitch, and the dominance region for pitch. J Neurophysiol. 1996b;76:1717–1734. doi: 10.1152/jn.1996.76.3.1717. [DOI] [PubMed] [Google Scholar]
- Delgutte B. Speech coding in the auditory nerve: II. Processing schemes for vowel-like sounds. J Acoust Soc Am. 1984;75:879–886. doi: 10.1121/1.390597. [DOI] [PubMed] [Google Scholar]
- Delgutte B, Kiang NYS. Speech coding in the auditory nerve: I. Vowel-like sounds. J Acoust Soc Am. 1984;75:866–878. doi: 10.1121/1.390596. [DOI] [PubMed] [Google Scholar]
- Delgutte B, Hammond BM, Cariani PA. Neural coding of the temporal envelope of speech: Relation to modulation transfer functions. In: Palmer AR, Reese A, Summerfield AQ, Meddis R, editors. Psychophysical and Physiological Advances in Hearing. Whurr; London: 1998. pp. 595–603. [Google Scholar]
- Dynes SBC, Delgutte B. Phase-locking of auditory-nerve discharges to sinusoidal electric stimulation of the cochlea. Hear Res. 1992;58:79–90. doi: 10.1016/0378-5955(92)90011-b. [DOI] [PubMed] [Google Scholar]
- Efron B, Tibshirani R. An Introduction to the Bootstrap. Chapman and Hall; New York: 1993. [Google Scholar]
- Good P. Permutation Tests. A Practical Guide to Resampling Methods for Testing Hypotheses. Springer; New York: 2000. [Google Scholar]
- Greenwood DD. What is ‘Synchrony suppression’? J Acoust Soc Am. 1986;79:1857–1872. doi: 10.1121/1.393194. [DOI] [PubMed] [Google Scholar]
- Hartmann R, Topp G, Klinke R. Discharge patterns of cat primary auditory fibers with electrical stimulation of the cochlea. Hear Res. 1984;13:47–62. doi: 10.1016/0378-5955(84)90094-7. [DOI] [PubMed] [Google Scholar]
- Johnson DH. The relationship between spike rate and synchrony in responses of auditory-nerve fibers to single tones. J Acoust Soc Am. 1980;68:1115–1122. doi: 10.1121/1.384982. [DOI] [PubMed] [Google Scholar]
- Kiang NYS, Watanabe T, Thomas EC, Clark LF. Discharge Patterns of Single Fibers in the Cat's Auditory Nerve. Cambridge, MA: The MIT Press; 1965. [Google Scholar]
- Killian MJP. PhD thesis. University of Utrecht; Netherlands: 1994. Excitability of the Electrically Stimulated Auditory Nerve. [Google Scholar]
- Klatt DH. Software for cascade/parallel formant synthesizer. J Acoust Soc Am. 1980;67:971–995. [Google Scholar]
- Knauth M, Hartmann R, Klinke R. Discharge pattern in the auditory nerve evoked by vowel stimuli: a comparison between acoustical and electrical stimulation. Hear Res. 1994;74:247–258. doi: 10.1016/0378-5955(94)90193-7. [DOI] [PubMed] [Google Scholar]
- Litvak LM, Delgutte B, Eddington DK. Auditory nerve fiber responses to electric stimulation: modulated and unmodulated pulse trains. J Acoust Soc Am. 2001;110:368–379. doi: 10.1121/1.1375140. [DOI] [PMC free article] [PubMed] [Google Scholar]
- Litvak LM, Delgutte B, Eddington DK. Improved temporal coding of sinusoids in electric stimulation of the auditory nerve using desynchronizing pulse trains. J Acoust Soc Am. 2003a;14:2079–2098. doi: 10.1121/1.1612493. [DOI] [PMC free article] [PubMed] [Google Scholar]
- Litvak LM, Smith ZM, Delgutte B, Eddington DK. Desynchronization of electrically evoked auditory-nerve activity by high-frequency pulse trains of long duration. J Acoust Soc Am. 2003b;14:2066–2078. doi: 10.1121/1.1612492. [DOI] [PMC free article] [PubMed] [Google Scholar]
- Miller MI, Sachs MB. Representation of voice pitch in discharge patterns of auditory-nerve fibers. Hear Res. 1984;14:257–279. doi: 10.1016/0378-5955(84)90054-6. [DOI] [PubMed] [Google Scholar]
- Møller AR. The use of correlation analysis in processing neuroelectric data. In: Schade JP, Smith J, editors. Progress in Brain Research, Computers and Brains. Elsevier; Amsterdam: 1970. pp. 87–99. [DOI] [PubMed] [Google Scholar]
- Møller AR. Statistical evaluation of the dynamic properties of cochlear nucleus units using stimuli modulated with pseudorandom noise. Brain Res. 1973;57:443–456. doi: 10.1016/0006-8993(73)90148-0. [DOI] [PubMed] [Google Scholar]
- Møller AR. Responses of units in the cochlear nucleus to sinusoidally amplitude-modulated tones. Exp Neurol. 1974;45:104–117. doi: 10.1016/0014-4886(74)90104-6. [DOI] [PubMed] [Google Scholar]
- Møller AR, Rees A. Dynamic properties of the responses of single neurons in the inferior colliculus of the rat. Hear Res. 1986;24:203–215. doi: 10.1016/0378-5955(86)90019-5. [DOI] [PubMed] [Google Scholar]
- Peterson GE, Barney HL. Control methods used in a study of vowels. J Acoust Soc Am. 1952;24:175–184. [Google Scholar]
- Rubinstein JT, Wilson BS, Finley CC, Abbas PJ. Pseudospontaneous activity: stochastic independence of auditory nerve fibers with electrical stimulation. Hear Res. 1999;127:108–118. doi: 10.1016/s0378-5955(98)00185-3. [DOI] [PubMed] [Google Scholar]
- van den Honert C, Stypulkowski PH. Temporal response patterns of single auditory nerve fibers elicited by periodic electrical stimuli. Hear Res. 1987;29:207–222. doi: 10.1016/0378-5955(87)90168-7. [DOI] [PubMed] [Google Scholar]
- Xu SA, Shepherd RK, Chen Y, Clark GM. Profound hearing loss in the cat following the single co-administration of kanamycin and ethacrynic acid. Hear Res. 1993;70:205–215. doi: 10.1016/0378-5955(93)90159-x. [DOI] [PubMed] [Google Scholar]
- Young ED, Sachs MB. Representation of steady-state vowels in the temporal aspects of the discharge patterns of populations of auditory nerve fibers. J Acoust Soc Am. 1979;66:1381–1403. doi: 10.1121/1.383532. [DOI] [PubMed] [Google Scholar]