Abstract
Expression of Snail1 in epithelial cells triggers an epithelial–mesenchymal transition (EMT). Here, we demonstrate that the synthesis of Zeb2, a transcriptional repressor of E-cadherin, is up-regulated after Snail1-induced EMT. Snail1 does not affect the synthesis of Zeb2 mRNA, but prevents the processing of a large intron located in its 5′-untranslated region (UTR). This intron contains an internal ribosome entry site (IRES) necessary for the expression of Zeb2. Maintenance of 5′-UTR Zeb2 intron is dependent on the expression of a natural antisense transcript (NAT) that overlaps the 5′ splice site in the intron. Ectopic overexpression of this NAT in epithelial cells prevents splicing of the Zeb2 5′-UTR, increases the levels of Zeb2 protein, and consequently down-regulates E-cadherin mRNA and protein. The relevance of these results is demonstrated by the strong association between NAT presence and conservation of the 5′-UTR intron in cells that have undergone EMT or in human tumors with low E-cadherin expression. Therefore, the results presented in this article reveal the existence of a NAT capable of activating Zeb2 expression, explain the mechanism involved in this activation, and demonstrate that this NAT regulates E-cadherin expression.
[Keywords: Zeb2/Sip1, EMT, Snail1, NAT, IRES]
Epithelial–mesenchymal transition (EMT) is a cellular process characterized by the loss of epithelial features and the acquisition of a mesenchymal phenotype (Thiery 2003; Huber et al. 2005). This morphological change is accompanied by the down-modulation of specific epithelial genes, such as E-cadherin, and the induction of mesenchymal genes. Ectopic overexpression of Snail1 in epithelial cells induces EMT concomitantly with the down-modulation of E-cadherin gene expression. Moreover, an essential role for the Snail1 transcriptional factor in EMT was demonstrated on the basis of its general induction in cellular conditions triggering this transition, and by the absence of EMT in the development of murine embryos null for Snail1 (for review, see Peinado et al. 2007).
Snail1 represses E-cadherin transcription through its direct binding to 5′-CACCTG-3′ boxes (E boxes) present in the E-cadherin promoter (Batlle et al. 2000; Cano et al. 2000). Moreover, Snail1 induces the expression of the Zeb1 transcriptional factor (Guaita et al. 2002), a transcriptional repressor that also binds to E-cadherin promoter E-boxes (Grooteclaes and Frisch 2000; Eger et al. 2005). Zeb1/deltaEF1 belongs to a small family of transcriptional factors characterized by containing a homeodomain flanked by two separated Zn finger clusters (Verschueren et al. 1999). High levels of Zeb1 are detected in cells with a mesenchymal phenotype and are also observed after Snail1-induced EMT (Guaita et al. 2002). On the basis of these data, and the sustained expression of Zeb1 after Snail1 down-regulation (Guaita et al. 2002), it has been suggested that Zeb1 might work by extending the repression of E-cadherin initiated by Snail1.
Overexpression of Zeb2/Sip1, another member of the Zeb family (HUGO nomenclature ZFHX1B), also induces E-cadherin down-regulation and EMT (Comijn et al. 2001; Vanderwalle et al. 2005). However, Zeb2 transcripts are not generally induced after EMT and do not always correlate with the mesenchymal phenotype (Guaita et al. 2002; Barberà et al. 2004). In this article, we demonstrate that the Zeb2 protein is also up-regulated in response to Snail1 expression. However, unlike Zeb1, the effect of Snail1 on Zeb2 expression does not depend on increased levels of this mRNA, but on its alternative processing. The consequences and mechanism of this impaired splicing are investigated in this study.
Results
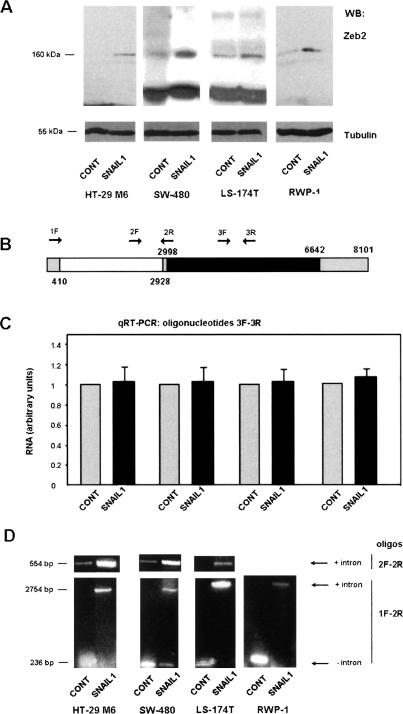
To study the possible relevance of Zeb2 in the effects of Snail1, we analyzed the expression of the Zeb2 protein by Western blot using a recently available monoclonal antibody (mab). This mab does not recognize Zeb1 (data not shown). In four different cell lines, HT-29 M6, RWP-1, SW-480, and LS-174T, we detected increased levels of Zeb2 after stable expression of Snail1, though to different extents (Fig. 1A). However, as in previously published results from our group (Guaita et al. 2002), we did not observe significant differences in Zeb2 RNA in these Snail1-stable transfectants and control cells. These analyses were performed by semiquantitative RT–PCR (data not shown) or quantitative RT–PCR (qRT–PCR) (Fig. 1C), using two oligonucleotides corresponding to the ORF (Fig. 1B). We then further investigated the reasons for this discrepancy.
Figure 1.
Zeb2 protein is increased in Snail1 transfectants by a post-transcriptional mechanism. (A) Total cell extracts were prepared from HT-29 M6, SW-480, LS-174T, or RWP-1 cells, control or transfected with Snail1-HA cDNA (see the Materials and Methods). One-hundred-fifty micrograms of protein from total cell extracts were analyzed by Western blot using a mab specific to Zeb 2 protein. mRNA was isolated from the indicated cell lines and analyzed by qRT–PCR (C) or semiquantitative RT–PCR (D), with the oligonucleotides depicted in B. Oligos 3F–2R (C) corresponded to the translated sequence, 1F1R (D, bottom) flanked the intron present in the 5′-UTR, and 2F–1R (D, top), determined the conservation of the intron. The size of the DNA fragments amplified is indicated. The figure shows the result of one experiment out of three performed. In B, the ORF is depicted in black, the 5′-UTR and 3′-UTR exons are in gray, and the 5′-UTR intron is in white.
An exhaustive analysis of these cell populations indicated that differences between Snail1 transfectants and control cells were detected when we carried out the RT–PCR analysis with two oligonucleotides corresponding to the 5′ untranslated region (UTR) of Zeb2 RNA. As shown in Figure 1D, expression of Snail1 induced the conservation of an additional 2.5-kb sequence in human Zeb2 mRNA. Analysis of this sequence indicated that it corresponds to an intron situated between nucleotides +410 and +2928 (with respect to the main transcription site). An alternative splicing of the murine Zeb2 5′-UTR has been described previously by other investigators (Nelles et al. 2003).
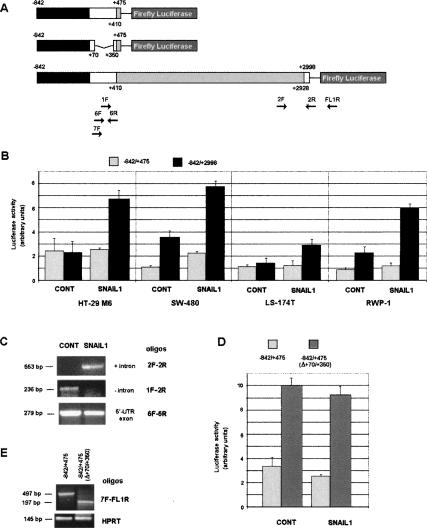
We cloned a DNA fragment corresponding to the human Zeb2 promoter and part of the 5′-UTR (Fig. 2A). This DNA fragment corresponds to the main promoter described in mouse (Nelles et al. 2003). In reporter assays, the activity of this fragment (−842/+475 from the main transcription site) was not significantly stimulated in cells transfected with Snail1; only in SW-480 cells was a detectable up-regulation observed (Fig. 2B). However, when we extended the construction in order to cover the entire 5′-UTR (−842/+2998), including the intron, the activity of the promoter increased reproducibly after Snail1 expression in the four cell lines studied (Fig. 2B). This higher activity of the construction correlated with the conservation of the intron in the exogenous RNA transcribed from the transfected promoter. As observed in Figure 2C, the intron was conserved only in exogenous mRNA in cells expressing Snail1. On the contrary, the 5′-UTR exon sequence was present at similar levels in control and Snail1-expressing genes, further indicating that the differences in Firefly Luciferase activity were not caused by altered gene transcription.
Figure 2.
Zeb2 5′-UTR controls the expression of Luciferase. (A) Diagram of the constructions used in these assays. The sequence corresponding to the Zeb2 promoter (−842/+1) is indicated in black, the 5′-UTR intron (+410/+2928) is indicated in gray, and the rest of the 5′-UTR is indicated in white. The relative position of the oligonucleotides used in this figure is indicated. (B) Firefly Luciferase activity was determined after transfecting the constructions into the indicated cells. Firefly Luciferase was standardized to the value of Renilla Luciferase. (C) RNA was obtained from RWP-1 cells transfected with −842/+2998 construction in pGL3 plasmid. Splicing of exogenous intron was determined by semiquantitative RT–PCR with oligonucleotides specific to the intron and the exon. At this number of cycles, no amplified product was detected in mock-transfected cells. (D) Control or RWP1 cells stably expressing Snail1 cDNA were transfected with the indicated constructions and Firefly Luciferase activity was determined as described. (E) In parallel, RNA was obtained from the above-mentioned transfected RWP-1 cells and levels of exogenous transcript were determined with the indicated oligonuclotides. Results from B and D show the average ± SD of three experiments performed in triplicate.
To analyze the origin of the low activity of the spliced form of the RNA, we eliminated part of the 5′-UTR form of this RNA. This construction, −842/+475 (Δ+70/+350), had threefold higher activity than −842/+475 (Fig. 2D), indicating that the +70/+350 sequence exerts a negative effect on the translation of the Luciferase. Deletion of this element did not significantly affect transcription, since both RNAs, with or without the +70/+350 sequence, were similarly expressed (Fig. 2E).
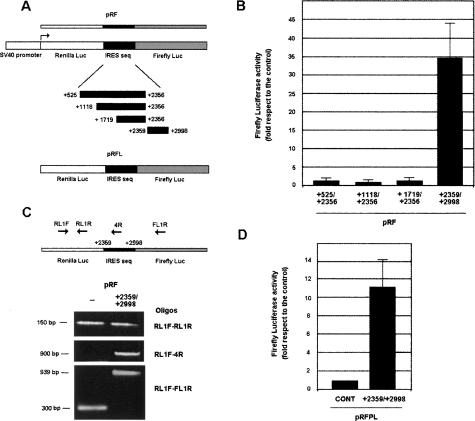
A possibility to explain the increased expression of Firefly Luciferase when containing the 5′-UTR intron is the presence in this element of an internal ribosome entry site (IRES). We checked if this was the case using two different methods. First, we analyzed the expression of the presumptive IRES by transfecting a DNA construction where transcription is controlled by the SV40 promoter and the IRES sequence is placed between Renilla and Firefly Luciferase ORFs (Fig. 3A). High ratios of Firefly to Renilla Luciferase indicate that the IRES is functional. We used a pRF plasmid without insert between both Luciferases as a control. The insertion of part of the 5′-UTR intron, the +2358/+2998 sequence, increased the expression of Firefly Luciferase >30-fold (Fig. 3B). Three other DNA fragments also corresponding to the intron (+525/+2356, +1158/+2356, and +1719/+2356) had no significant effect.
Figure 3.
Zeb2 5′-UTR contains an IRES element. (A) Diagram of the bicistronic plasmids, pRF and pRF-L (promoterless), used in these assays. (B) RWP-1 cells were transfected with pRF plasmid containing the indicated inserts. Results were normalized according to Renilla Luciferase and referred to the value obtained with empty pRF vector. The figure shows the average ± SD of four experiments performed in triplicate. (C) pRF and pRF +2359/+2998 plasmids were transfected to RWP-1 cells; RNA was collected 2 d after transfection and analyzed by RT–PCR with the oligonucleotides indicated in the diagram, corresponding to Renilla Luciferase (top), Renilla Luciferase and +2359/+2998 insert (middle), or Renilla Luciferase and Firefly Luciferase (bottom). (D) RWP1- cells were transfected with pRF-L and pRF-L +2359/+2998 plasmids and pRF containing just Renilla Luciferase. Expression of Renilla Luciferase was dependent on the expression of this plasmid; no activity was detected with pRF-L plasmid. Activity of Firefly Luciferase was normalized according to Renilla Luciferase and represented in respect to the value obtained with empty pRF-L plasmid. The figure shows the average ± SD of three experiments performed in triplicate.
It is formally possible that the observed induction of IRES activity is due to spurious splicing of the bicistronic RNA transcript, eliminating the Renilla Luciferase. We therefore determined the levels of this transcript by qRT–PCR. As shown in Figure 3C, the presence of the +2538/+2998 sequence in pRF did not alter the levels of Renilla Luciferase transcript; similar levels of Renilla RNA were detected when pRF or pRF-+2358/+2998 was transfected. Moreover, a transcript containing the Renilla Luciferase and the +2358/+2998 sequence was detected in cells transfected with pRF-+2358/+2998, indicating that both sequences are present in the same RNA.
We also studied the possibility that this increased expression of the reporter gene was due to cryptic promoter activity in the +2358/+2998 fragment. Therefore, the assay was repeated using a promoterless version of the pRF plasmid (pRFL). Although this assay indicated the existence of a weak promoter activity in this element, as previously reported for the murine gene (Nelles et al. 2003), the activation of Firefly Luciferase was clearly lower than that obtained with pRF plasmid, suggesting the existence of an IRES in this sequence (Fig. 3D).
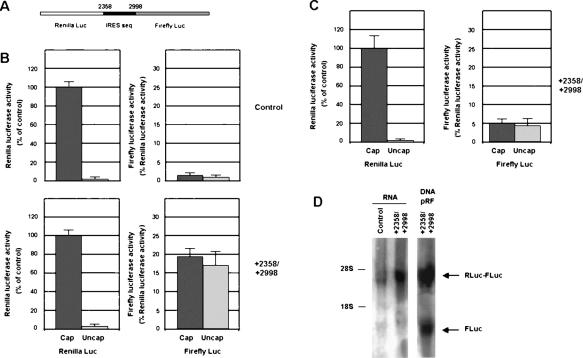
To further demonstrate the existence of an IRES in this 5′-UTR, a bicistronic RNA was synthesized in vitro and transfected into RWP-1 cells stably expressing Snail1. This RNA contained the +2358/+2998 sequence placed between Renilla and Firefly Luciferases (Fig. 4A). Expression of Renilla Luciferase was greatly dependent on the capping of this RNA (Fig. 4B, top left panel). In the control RNA, without insert (Fig. 4B, top right panel), Firefly Luciferase was not significantly expressed. However, when the +2358/+2998 sequence was present in the RNA, Firefly Luciferase activity was detected, at ∼20% of the expression of the Renilla one (Fig. 4B, bottom right panel), confirming that this sequence can work as an IRES. Moreover, Firefly Luciferase activity was independent of the addition of the cap to the RNA, further indicating that the ribosome is being recruited to an internal element (Fig. 4B, bottom right panel). Transfection of the transcript containing the +2358/+2998 sequence to control RWP-1 cells (Fig. 4C) produced similar results, although in this case the ratio between Firefly and Renilla Luciferase activities was lower than in RWP-1 cells expressing Snail1 (Fig. 4, cf. Firefly activity in B [bottom right panel] and C [right panel]). This result suggests that factors controlled by Snail1 are also relevant for full activity of this IRES.
Figure 4.
Zeb2 5′-UTR contains an IRES element. (A) A bicistronic RNA containing +2359/+2998 insert placed between Renilla and Firefly Luciferase was synthesized in vitro and capped as indicated in the Materials and Methods. This bicistronic RNA and a control without insert were transfected to RWP-1 cells ectopically expressing Snail1 (B), or to control RWP-1 cells (C). Renilla and Luciferase activities were determined after 12 h and referred to the value obtained for Renilla Luciferase in the transfection of capped RNA. The figure shows the average ± SD of three experiments performed in triplicate. (D) RNA was isolated from RWP-1 Snail1 cells transfected with the uncapped bicistronic transcripts 6 h after transfection, or from cells transfected with pRF-+2359/+2998 plasmid. Five micrograms of RNA were analyzed by Northern blot using a random prime [32P]-labeled probe corresponding to Firefly Luciferase coding region. Migration of the 28S and 18S ribosomal RNAs is indicated. The arrows indicate the migration of the transcripts corresponding to RLuc-+2359/+2998-FLuc and FLuc.
A Northern analysis of the transfected transcript to RWP-1 Snail1 cells did not show the presence of partially degraded fragments that might contribute to Firefly Luciferase expression (Fig. 4D). Even though the autoradiograph was overexposed, we did not detect any RNA different than that corresponding to the RLuc-+2358/+2998-Fluc transcript, when a Firefly Luciferase ORF sequence was used as probe. As a control, a Firefly Luciferase transcript was observed when the plasmid pRF +2358/+2998 was transfected, in accordance with results shown in Figure 3D, indicating that this element also contains a weak promoter.
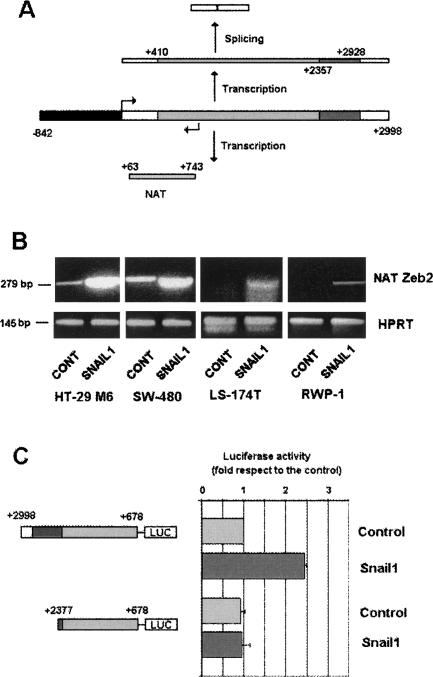
The existence of a natural antisense transcript (NAT) corresponding to the 5′-UTR of murine Zeb2 has also been reported (Nelles et al. 2003). A similar NAT was detected in our human cells (Fig. 5A). Using rapid amplification of 5′-cDNA end (RACE), we determined that the start site of this NAT corresponded to nucleotide +743, referring to the main transcription start of sense mRNA (data not shown). The complete NAT extended from +743 to at least +63, therefore covering the 5′ splice site of the Zeb2 5′-UTR placed at +411. Expression of this NAT was greatly stimulated by stable transfection of Snail1 in the four different cell lines studied (Fig. 5B), suggesting a positive role for this NAT in the maintenance of the intron.
Figure 5.
Expression of a Zeb2 NAT is up-regulated in Snail1-transfected cells. (A) The diagram shows the sequence of NAT and the correspondence with sequences of the Zeb2 intron (shaded in gray) and the exon in 5′-UTR. The sequence within the intron corresponding to the IRES (+2357/2928) is shaded in dark gray. (B) RNA was purified from different cell lines stably transfected with control plasmids or Snail1-HA cDNA and analyzed by RT–PCR using oligonucleotides and conditions specific to Zeb2 5′-UTR NAT (see Materials and Methods). (C) The indicated fragments of the Zeb2 gene were inserted in the opposite orientation in pGL3 plasmid. The promoter activity of these DNA fragments was analyzed in RWP1 control or expressing Snail1. Values refer to that obtained with the longest fragment in RWP-1 Snail1 cells. The figure shows the average ± SD of three experiments performed in duplicate.
We also analyzed the elements controlling expression of the Zeb2 NAT. A fragment of DNA corresponding to +678 to +2998 was placed in the opposite orientation in the pGL3 plasmid. In this orientation (+2998/+678), this construction, corresponding to −2255/+65 if we refer to the transcription start of the Zeb2 NAT, showed significant activity inducing the expression of the reporter gene. This promoter activity was higher in cells expressing Snail1 than in controls (Fig. 5C), indicating that the differences in the Zeb2 NAT between these two cell populations are due to up-regulated transcription. Deletion of the +2358/+2998 element (−1615/−2265 from the NAT transcription start) greatly affected the activity of this promoter and prevented the stimulation observed in cells expressing Snail1 (Fig. 5C). Therefore, the same element that we demonstrated above to present IRES activity in the Zeb2 RNA is also relevant for NAT transcription.
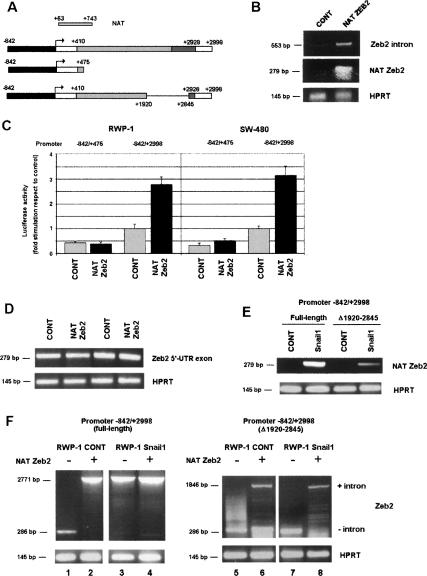
We also determined whether expression of the Zeb2 NAT was determinant for the conservation of the intron in the 5′-UTR. To verify this, we overexpressed this NAT in epithelial cell lines. As shown in Figure 6B, expression of this NAT induced the maintenance of the intron in the 5′-UTR of endogenous Zeb2 mRNA. The effect of overexpression of the NAT on the activity of the Firefly Luciferase under the control of the −842/+2998 DNA fragment was also analyzed. Expression of the Zeb2 NAT increased the activity of Firefly Luciferase in SW-480 and RWP-1 epithelial cells (Fig. 6C), without significantly affecting the levels of the transcript (Fig. 6D). As expected, transfection of the NAT did not up-regulate activity of the reporter gene when it was placed under the control of the −842/+475 DNA fragment, which constitutively lacks the intron (Fig. 6C). These results suggest the levels of the NAT control Zeb2 5′-UTR splicing in these cell lines.
Figure 6.
Expression of Zeb2 NAT in epithelial cells prevents splicing of the 5′-UTR intron. (A) The different constructions used in this figure are shown, indicating also the relative position of the NAT. (B) Epithelial RWP-1 cells were transiently transfected with pcDNA3-Zeb2 NAT or pcDNA3 as control. RNA was collected and analyzed by RT–PCR with oligonucleotides specific for NAT, Zeb2 5′-UTR intron, or HPRT as control. (C) RWP-1 or SW-480 cells were cotransfected with pcDNA3 NAT, pGL3 (−842/+2998), or pGL3 (−842/+475) and Renilla Luciferase expression plasmid. Firefly Luciferase was determined and normalized according to the value of Renilla Luciferase. The values correspond to the average ± SD of stimulation observed in three experiments performed in these two cell lines. (D) Levels of transcript from transfected cells from C were analyzed by RT–PCR with two oligonuclotides corresponding to 5′-UTR exon. (E,F) pGL3 (−842/+2998) plasmid, either wild type or with a deletion comprising nucleotides 1920–2845, was transfected to RWP-1 control or Snail1-expressing cells. (E) Levels of NAT were determined as above by RT–PCR. At this number of cycles, RWP-1 Snail1 cells not transfected with pGL3 plasmids presented levels of NAT similar to those detected for pGL3 (−842/+2998)(Δ1920–2845). (F) Analysis of the splicing of the 5′-UTR intron in the exogenous RNA was carried out as above by RT–PCR with two oligonucleotides flanking this intron. When indicated, pcDNA3-Zeb2 NAT or pcDNA3 as control were cotransfected. In D and F, no amplified fragments corresponding to exon or intron sequences were detected at this number of cycles in mock-transfected cells.
To further characterize the relevance of the NAT in the spicing of the Zeb2 5′-UTR transcribed from the exogenous −842/+475 promoter, we used a mutant deficient for the transcription of the exogenous NAT. This mutant, −842/+2998 (Δ+1920/+2845) (Fig. 6A), induces the synthesis of lower levels of the NAT than the full-length DNA construct when transfected to RWP-1 Snail1 cells (Fig. 6E). The levels of the NAT detected when we transfected the −842/+2998 (Δ+1920/+2845) construction were comparable with those observed in untransfected RWP-1 Snail1 cells (data not shown), indicating that they probably correspond to the endogenous NAT. Moreover, this experiment indicates that the NAT is efficiently produced from the exogenous −842/+2998 DNA construct. Compared with the wild-type DNA, deletion of the +1920/+2845 sequence affected the maintenance of the exogenous intron in RWP-Snail1 cells (Fig. 6F, cf. lanes 3 and 7). As expected, processing of the exogenous intron was always detected in RWP-1 cells (Fig. 6F, lanes 1,5). The mutation did not promote per se the splicing of the Zeb2 5′-UTR, since ectopic transfection of the NAT was capable of causing retention of the exogenous intron from the −842/+2998 (Δ1920–2845) construct, when both were coexpressed either in RWP-1 or in RWP-1-Snail1 cells (Fig. 6F, lanes 7, 8).
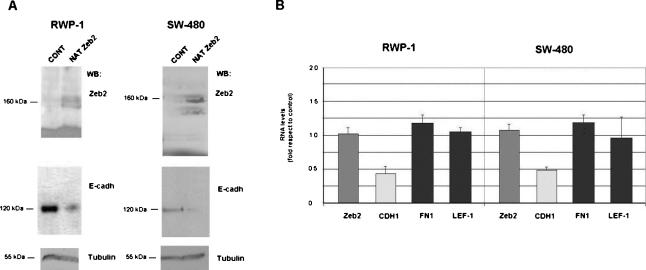
Next, the Zeb2 NAT was also stably cotransfected with pGFP into RWP-1 cells or SW-480 cells, and GFP-positive cells were isolated and analyzed. Expression of the NAT up-regulated Zeb2 protein (Fig. 7A) without significantly modifying the levels of Zeb2 mRNA when qRT–PCR analysis was performed with two oligonucleotides corresponding to the Zeb2 ORF (Fig. 7B). As a consequence of the increase in Zeb2 protein, E-cadherin protein and RNA were down-regulated. No significant changes were observed in the mRNA levels of two characteristic mesenchymal markers, Fibronectin and Lef-1, in the two cell lines (Fig. 7B), indicating that the Zeb2 NAT represses E-cadherin but does not cause a complete EMT.
Figure 7.
Stable expression of Zeb2 NAT in RWP1 or SW-480 cells up-regulates Zeb2 protein and down-regulates E-cadherin mRNA and protein. RWP-1 or SW-480 cell populations stably expressing Zeb2 NAT were obtained as indicated in the Materials and Methods. (A) Total protein extracts were prepared and analyzed by Western blot using antibodies specific to Zeb2, E-cadherin, or β-tubulin as loading control. (B) In parallel, RNA was purified and analyzed by qRT–PCR using oligonucleotides specific to Zeb2 RNA (ORF), E-cadherin (CDH1), or the mesenchymal markers fibronectin (FN1) and LEF-1. The values are represented as fold in respect to the value obtained in a cell population selected after transfecting the empty vector. The figure shows the average ± range of two analysis performed.
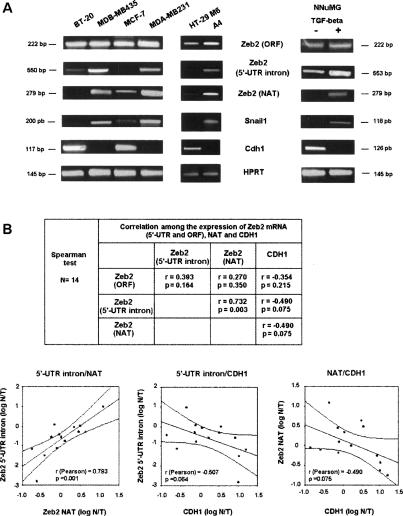
Finally, we analyzed whether the expression of the NAT and maintenance of the Zeb2 5′-UTR intron could be detected in other experimental conditions. As seen in Figure 8A, whereas the Zeb2 ORF was ubiquitously expressed, sequences corresponding to the Zeb2 5′-UTR intron were observed in cell lines with low expression of E-cadherin, such as breast MDA-MB231 or MDB-MB435, and not in cell lines with a more epithelial phenotype and the highest levels of E-cadherin, such as BT-20 or MCF-7. Cells retaining the Zeb2 5′-UTR intron also presented higher levels of the NAT than cells showing E-cadherin expression. Similar results were obtained when we compared HT-29 M6 with A4 cells, a clone of HT-29 M6 constitutively transfected with an activated form of cPK-Cα (Batlle et al. 1998). This cell line shows lower E-cadherin RNA levels and higher expression of Snail1 with respect to the control cells, especially after treatment with PMA (Fig. 8A; Barberà et al. 2004). Fibronectin and other mesenchymal markers were also increased (Barberà et al. 2004). As above, a clear up-regulation of both the Zeb2 NAT and Zeb2 5′-UTR intron were observed in A4 cells, whereas the levels of the Zeb2 transcript were only slightly increased (Fig. 8A).
Figure 8.
Expression of Zeb2 NAT and 5′-UTR correlates closely in cell lines and human tumors. RNA was obtained from the indicated cell lines (A), treated with TGF-β (5 ng/mL) when appropriate, or from a panel of 14 colon adenocarcinomas (B). The expression of the different transcripts was performed by semiquantitative RT–PCR (A) or qRT–PCR (B) as indicated in the Materials and Methods. B, top, shows the Spearman coefficient and the P index corresponding to the association of expression of the different transcripts; the bottom shows the results corresponding to the most significant correlations, indicating the Pearson correlation coefficient.
A more conclusive analysis was performed in a cell line, NuMG, that undergoes EMT upon treatment with TGF-β (Miettinen et al. 1994). As expected, this EMT was accompanied by down-regulation of E-cadherin expression and up-regulation of Snail1 (Fig. 8A). We found no significant change in the levels of Zeb2 transcript when the semiquantitative RT–PCR analysis was performed with two primers corresponding to the ORF. However, both the Zeb2 5′-UTR intron and NAT increased greatly after treatment with TGF-β (Fig. 8A).
A similar study was also carried out with a small set of human colon adenocarcinomas. The various Zeb2 transcripts were measured by qRT–PCR and represented with respect to the value in distal normal tissue. As shown in Figure 8B, expression of the 5′-UTR intron and NAT correlated closely, with a Spearman coefficient of 0.732 (P = 0.003). Presence of the 5′-UTR intron and NAT inversely correlated with E-cadherin (CDH1) expression, with a Spearman coefficient close to −0.5, but with a P-value above statistical significance (0.075) (Fig. 8B). On the other hand, we found no association between the expression of the Zeb2 ORF and CDH1, or between that of the Zeb2 ORF and the 5′-UTR intron or NAT (Fig. 8B).
Discussion
As shown in this article, expression of the Zeb2 protein correlates with the conservation of a long 5′-UTR in its mRNA. Average 5′-UTRs in eukaryotic mRNAs contain 50–100 nucleotides (nt) (Hellen and Sarnow 2001). This size is compatible with the ribosome-scanning mechanism, where the ribosome binds to the cap structure at the 5′ end and slides on the mRNA until finding the first AUG codon within an optimal context. However, the main transcription site for Zeb2 (Nelles et al. 2003) generates a 3-kb 5′-UTR mRNA, which is unlikely to be suitable for this mechanism since its length inhibits efficient ribosome scanning (Kozak 2002). At the beginning of this research, we considered the possibility that a shorter (481-nt) 5′-UTR originated by splicing of this mRNA might be scanned by the ribosome. However, our results indicate that it is the longest, and not the shortest, 5′-UTR that associates with expression. Moreover, our results showing that deletion of 300 nt in the spliced 5′-UTR of Zeb-2 mRNA increases the expression of the reporter gene suggest that this processed 5′-UTR is still too long to allow translation. As indicated, its length, 481 nt, is far longer than average 5′-UTRs. The presence of this long 5′-UTR probably enables the formation of secondary structures, which prevents efficient ribosome scanning. Therefore, to produce the Zeb2 protein, the translation machinery must use an alternative mechanism to scanning, such as internal ribosome entry.
Our results demonstrate the existence of an IRES in Zeb2 mRNA, placed between nucleotides 2358 and 2998, a region seen by in silico analysis as highly structured. Insertion of this sequence in the bicistronic pRF plasmid increased the expression of the Firefly Luciferase to an extent that cannot be explained by the promoter activity of this fragment. More conclusively, this sequence induced the translation of Firefly Luciferase when a bicistronic Renilla–Firefly Luciferase mRNA was transfected into mesenchymal cells, an induction that was independent of the capping of this mRNA. Although IRES elements were first discovered and characterized in RNA genomes of picornaviruses that naturally lack 5′-terminal cap structures (Pelletier and Sonenberg 1988), they have also been identified in a number of eukaryotic cellular mRNAs (Hellen and Sarnow 2001). Many of these IRES-containing mRNAs are regulated during stress situations such as differentiation or apoptosis (Hellen and Sarnow 2001; Holcik and Sonenberg 2005). We showed that the activity of the Zeb2 IRES is increased after the Snail1-induced conversion of epithelial cells to a mesenchymal phenotype, a condition that causes significant stress to the cell. Accordingly, Snail1 and Zeb2 are induced by HIF in cells under hypoxic stress, promoting E-cadherin transcription down-regulation (Esteban et al. 2006; Krishnamanchary et al. 2006; Evans et al. 2007). Therefore, Zeb2 might belong to the class of genes regulated by an IRES sensitive to physiological stress. It is possible that this IRES-dependent translation of Zeb2 is an alternative mechanism to maintain sufficient levels of E-cadherin repressors even in conditions where cap-dependent translation is affected, such as after severe stress. Consequently, the contribution of the two members of the Zeb family, Zeb1, which presents a more standard promoter, and Zeb2, to E-cadherin repression might be different depending on the stress conditions associated with EMT.
Analysis of the Zeb2 IRES using both RNA transfections and the pRF plasmid shows higher activity in mesenchymal than in epithelial cells, even though removal of the intron is prevented in epithelial cells (Fig. 4). Therefore, factors activated during EMT may be required for the complete activation of the IRES, as shown for other stress-dependent IRESes. A subject for further research consists of the identification of these factors and the analysis of the IRES stimulated during the acquisition of the migratory fibroblastic phenotype characteristic of EMT.
As explained in this article, the Zeb2 IRES is maintained only in mature RNA in cells that have undergone EMT (Fig. 1). This provides an explanation for Zeb2 protein up-regulation in these cells without changes in Zeb2 mRNA content. Moreover, our data showing that Zeb2 RNA undergoes alternative splicing might account for the different results obtained when Zeb2 RNA levels were determined by RT–PCR, since the choice of a sense primer in the 5′-UTR intron or in the coding sequence gives different results. In any case, we cannot discard that this main control of Zeb2 translation, based on the different activity of this IRES, may be accompanied by increased transcription of Zeb2 mRNA in other cell systems. This would explain why other investigators have detected changes in Zeb2 mRNA levels in EMTs induced in other cellular conditions when using RT–PCR and primers corresponding to different exons (Maeda et al. 2005; Bindels et al. 2006).
Impaired splicing of the IRES-containing intron is dependent on the presence of a NAT. Inhibition of splicing by a NAT was previously observed for the c-erbA gene (Munroe and Lazar 1991). Most NATs are transcribed from regions encoding UTRs (Lehner et al. 2002). In this case, the Zeb2 NAT extends from +743 to at least +63, therefore covering the donor splice site situated at +410. Expression of the Zeb2 NAT is induced after EMT in different cell systems. Preliminary assays indicated that the expression of this NAT is activated by transfection of a gain-of-function mutant of the NF-κB pathway (M. Beltran and A.G. de Herreros, unpubl.), similarly to other mesenchymal genes induced after expression of Snail1 (G. Solanas, C. Agustí, M. Porta-de-la-Riva, D. Casagolda, F. Sánchez-Aguilera, F. Pons, S. Peiró, M. Escrivà, M.J. Larriba, A. Muñoz, et al., in prep.). Moreover, an analysis of the DNA elements controlling the expression of this NAT demonstrated that the sequence present between nucleotides +2377 and +2998 is necessary for the stimulation of transcription observed in cells expressing Snail1. Therefore, the same element required for the stimulation of the transcription of the Zeb2 NAT also works, when transcribed, as an IRES. The proteins binding to this element, both in the DNA or in the RNA, remain to be characterized, as well as whether some of these proteins may be associating with both nucleic acids. According to our results, this putative factor or factors should bind with greater affinity to these elements in cells expressing Snail1, in order to cause higher transcription of the NAT and greater activity of the IRES.
An analysis of a small group of tumor samples indicates that the presence of this NAT and maintenance of the 5′-UTR intron correlate closely. Although not totally significant, these two transcripts are associated with down-regulated E-cadherin levels, a relationship that was not observed when the Zeb2 ORF was determined. In addition to the low number of tumors analyzed, other factors might account for this lack of total correlation between the expression of the NAT/5′-UTR intron (and presumably Zeb2 protein) and the loss of E-cadherin; for instance, Zeb1 might be also contributing to E-cadherin down-regulation. Alternatively, repression by Zeb2 might be also dependent on the levels of the transcriptional regulators p300 and CtBP, which modulate the inverse correlation between Zeb1 and E-cadherin (Peña et al. 2006). In any case, these analyses suggest that maintenance of the 5′-UTR intron is probably the consequence of increased transcription of the Zeb2 NAT in human tumors and further underline the relevance of our findings.
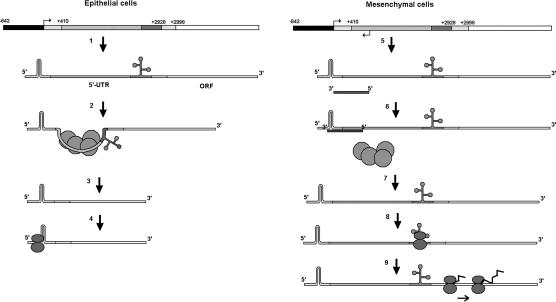
The importance of antisense transcription has been stressed by the widespread occurrence of antisense transcripts in the human genome: Between 5% and 10% of all genes have an antisense counterpart (Yelin et al. 2003; Katayama et al. 2005). Evolution studies have ruled out that this high level of expression represents a leakage of the RNA transcription machinery (Dahary et al. 2005). Moreover, studies on individual NATs show that they regulate gene expression at different levels such as genomic imprinting (Rougeulle and Heard 2002), transcriptional interference (Prescott and Proudfoot 2002), translational regulation (Brantl 2002), alternative splicing (Hastings et al. 2000), and RNA editing (Peters et al. 2003). In most cases, these NATs are associated with decreased expression of their target genes. However, expression of the Zeb2 NAT in cell lines increases the levels of Zeb2 protein. The control mechanism of Zeb2 protein expression by this NAT is depicted in Figure 9, which summarizes the results reported in this article, and the differences observed between epithelial and mesenchymal cells (or cells that have undergone EMT). Moreover, since Zeb2 is a transcriptional repressor of E-cadherin, overexpression of the NAT causes down-regulation of E-cadherin, a key protein in the maintenance of the epithelial phenotype. It is noteworthy that this decrease in E-cadherin is not accompanied by a significant up-regulation of the expression of mesenchymal genes, suggesting that Zeb2, differently from Snail1, does not promote a full EMT in our cell models, but regulates only E-cadherin. It is possible that Zeb2 is playing a role similar to that suggested for Zeb1, thus extending or cooperating in the effect of Snail1 on E-cadherin expression. In any case, the results presented in this article demonstrate the existence of a NAT capable of activating Zeb2 expression, explain the mechanism involved in this activation, and demonstrate that this NAT regulates E-cadherin expression, suggesting a role for noncoding RNAs in the control of epithelial morphology.
Figure 9.
A model for the regulation of Zeb2 expression in epithelial and mesenchymal cells. (Left side, 1) In epithelial cells transcription of the main promoter of Zeb2 gene (in black) generates an RNA composed of a 3-kb 5′-UTR (in gray) and the ORF (in white). Upon binding of the spliceosome (2), an intron corresponding to 2.5 kb is eliminated, generating a processed transcript with a 5′-UTR of 481 nt (3). (4) This 5′-UTR contains a sequence that inhibits scanning by the ribosomes and therefore prevents translation of Zeb2 protein. (Right side, 5) After completion of the EMT, transcription of Zeb2 is accompanied by expression of a NAT depending on the activation of a different promoter placed 5′ downstream. Expression of this NAT is greater than the long transcript (not shown) and prevents binding of the spliceosome to the 5′ splice site (6) and, consequently, the intron present in the 5′-UTR is conserved (7). This intron contains an IRES situated close to the start of translation. Binding of the ribosomes to this IRES (8) makes the translation of Zeb2 protein possible (9).
Materials and methods
Cell culture
All cells were grown in Dulbecco’s modified Eagle’s medium (Invitrogen) containing 10% fetal calf serum (Biological Industries) and the standard complements. Culture medium for NuMG cells was also supplemented with insulin (10 μg/mL). The generation of colon HT-29 M6, SW-480, and LS-174T, or pancreatic RWP-1 cell populations transfected with Snail1 has been reported elsewhere (Batlle et al. 2000; Peiró et al. 2006; G. Solanas, C. Agustí, M. Porta-de-la-Riva, D. Casagolda, F. Sánchez-Aguilera, F. Pons, S. Peiró, M. Escrivà, M.J. Larriba, A. Muñoz, et al., in prep.). The characterization of A4 cells, a HT-29 M6 clone transfected with an activated form of cPK-Cα, has been reported previously (Batlle et al. 1998). As indicated, these cells were treated with phorbol 12-myristate, 13-acetate (PMA) (50 nM, 24 h) (Sigma) in order to further stimulate cPK-Cα activity and the mesenchymal phenotype. RWP-1 and SW-480 cells were also transfected with a pcDNA3-Zeb-2 NAT plasmid or pcDNA3 as control, and pEGFP, using a Lipofectamine Plus kit (Gibco) according to the manufacturer’s instructions. Transfected cells were grown in medium containing 500 μg/mL G-418 (Gibco) and were selected by a fluorescent-activated cell sorter. Human breast cancer cell lines MCF-7, BT-20, MDA-MB231, or MDB-MB435, or murine mammary cell line NuMG were obtained from our institute Cell Bank. When indicated, NuMG was treated with TGF-β (5 ng/mL) (PeproTec) for 7 d in order to promote EMT.
Plasmid construction
Sequences of Zeb2 RNA were indicated according to the published mRNA sequence (NM014795.2) and referred to the main transcription start site. Our sequence also included the intron placed between +410/+2928 not present in the GeneBank RNA; sequence of this intron corresponded to that present in the chromosome 2 genomic contig, reference NT_022135.15|Hs2_22291, between 33982840 and 33985429.
Zeb2 promoter fragments −842/+475 and −842/+2998 were amplified using HT29-M6 genomic DNA and oligonucleotides corresponding to sequences −842/−861 (forward) and +442/+478 or +2976/+2998 (reverse). Oligonucleotides include SacI and BglII sites for facilitating the cloning of the fragment in the pGL3 basic plasmid. Deletion of the fragment +70/+370 from the −842/+475 Zeb2 promoter was performed with oligonucleotides corresponding to +350/+370 as forward primer, and to +45/+70 as reverse primer. Deletion of fragment +1920/+2845 was carried out by digesting pGL3 Zeb2 −842/+2998 with ApaI and XhoI, refilling with the Klenow fragment, and religating.
The DNA sequence containing the IRES element was cloned by amplifying the sequences +525/+2377, +1118/+2377, +1719/+2377, and +2356/+2998 (from the main transcription start site) using high-fidelity Pfx Platinium polymerase (Invitrogen). Oligonucleotides include EcoRI and NcoI sites for facilitating cloning of the fragment in plasmids pRF or pRFL (pRF without promotor), kindly provided by Dr. Raúl Méndez, (Centre de Regulació Genòmica, Barcelona, Spain).
A DNA fragment corresponding to the Zeb2 NAT was amplified using HT 29-M6 genomic DNA and oligonucleotides corresponding to +89/+109 and +707/+727. The fragment was inserted in pcDNA3 in the antisense orientation. The NAT promoter was cloned using oligonuclotides corresponding to +670/+696 and +2356/2377 or +2976/+2998 with respect to the main transcription site, and cloned in a SmaI site of the PGL3 vector in antisense orientation. All constructions were verified by sequencing.
Transcript analysis in cell lines
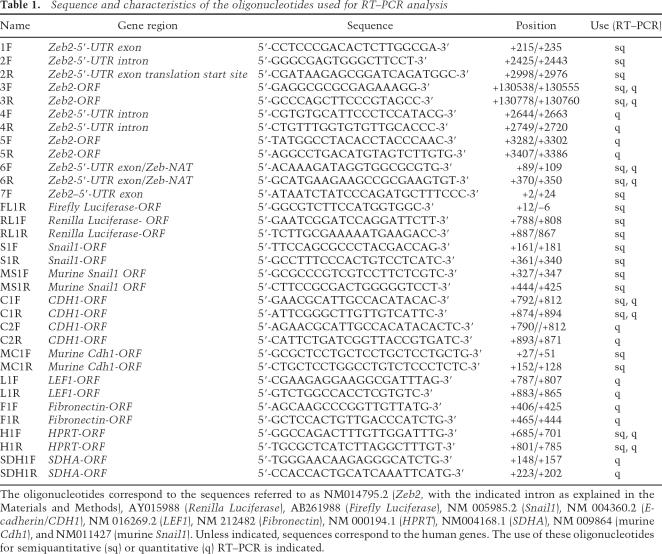
Transcripts were analyzed by RT–PCR, using 0.5–1 μg of total RNA. The semiquantitative analysis of the different spliced forms of the 5′-UTR of the Zeb2 RNA was performed with a One Step RT–PCR kit (Qiagen) and oligonucleotides corresponding to sequences +2976/+2998, +215/+235 and +2425/+2443 (see Table 1). The semiquantitative analysis of the NAT complementary to the Zeb2 5′-UTR was performed in two steps, using an oligonucleotide corresponding to sequence +89/+109 for reverse transcription, digesting with RNase, and adding another oligonucleotide corresponding to +707/+727 for PCR. Other oligonucleotides used for the analysis of the various transcripts are shown in Table 1. The levels of Zeb2 RNA sequences in murine NNuMG cells were determined with oligonucleotides 4F–4R, 5F–5R, and 6F–6R, since they present high homology with the corresponding murine sequences; the identity of the amplified fragments was verified by sequencing.
Table 1.
Sequence and characteristics of the oligonucleotides used for RT–PCR analysis
The oligonucleotides correspond to the sequences referred to as NM014795.2 (Zeb2, with the indicated intron as explained in the Materials and Methods), AY015988 (Renilla Luciferase), AB261988 (Firefly Luciferase), NM 005985.2 (Snail1), NM 004360.2 (E-cadherin/CDH1), NM 016269.2 (LEF1), NM 212482 (Fibronectin), NM 000194.1 (HPRT), NM004168.1 (SDHA), NM 009864 (murine Cdh1), and NM011427 (murine Snail1). Unless indicated, sequences correspond to the human genes. The use of these oligonucleotides for semiquantitative (sq) or quantitative (q) RT–PCR is indicated.
Expression levels of transcripts were also calculated by real-time RT–PCR using SYBR Green (Roche Diagnostics). RNA levels were determined quantitatively in triplicate using the indicated primers (Table 1) on an ABI PRISM 7900HT. All quantifications were normalized to an endogenous control (Hipoxanthine–guanine phosphoribosyl transferase, HPRT). The relative quantification value for each target gene compared with the calibrator for that target is expressed as 2-(Ct-Cc) (Ct and Cc are the mean threshold cycle differences after normalizing to HPRT).
Alternatively, Northern blot analysis was carried out following standard procedures. Total RNA was denatured and resolved on a 1% formaldehyde–37% agarose gel. Following transfer, the membranes were UV irradiated and prehybridized for 4 h at 55°C in Express Hybridization solution. Membranes were then hybridized in fresh hybridization solution containing a random prime [32P]-labeled probe corresponding to the Firefly Luc ORF. Bands were visualized in a PhosphorImager.
Transcript analysis of tumor samples
Fourteen samples of colon adenocarcinomas and their matched normal colon mucosa (taken at least 3 cm from the outer tumor margin) were obtained immediately after surgery, immersed in RNA later (Ambion, Inc.), snap-frozen in liquid nitrogen, and stored at −80°C until processing. The use of these samples for the study was approved by the Research Ethics Board of the Hospital Universitario Puerta de Hierro (Madrid, Spain). RNA was extracted from tumor cells lines and from ∼30 mg of tumor and normal tissues using the RNeasy Mini Kit (Qiagen). RNA samples were treated with an RNase-free DNase, DNA-free (Ambion), as in the manufacturer’s protocol, and nucleic acids were quantified spectrophotometrically with a NanoDrop ND-1000 Spectrophotometer (nanoDrop Technologies, Inc.).
Four-hundred nanograms of total RNA were retro-transcribed using the Gold RNA PCR Core Kit (PE Biosystems), and RNA levels corresponding to the Zeb2 ORF, 5′-UTR intron, Zeb2 NAT, or CDH1 ORF were analyzed as indicated above by qPCR using a LightCycler apparatus (Roche) and the LightCycler-FastStartPLUS DNA Master SYBR Green I Kit (Roche). The primers used in these assays were 4F and 4R, 5F and 5R, 6F and 6R, and C2F and C2R for the Zeb2 5′-UTR intron, Zeb2 ORF, Zeb2 NAT, and CDH1, respectively (see Table 1). RNA levels were calculated in the normal and tumor counterpart samples in a relative quantification approach, whereby the amount of the targets was expressed in relation to the reference housekeeping gene succinate dehydrogenase complex subunit A (SDHA). The relative concentrations of the target and the reference gene were calculated by interpolation, using a standard curve of each gene plotted from the same serial dilution of cDNA from tumor tissue. The expression level of a target gene in a patient was calculated as the ratio of its expression in normal to its expression in tumor tissues (N/T).
The correlations between Zeb2 mRNA (5′-UTR intron and ORF), NAT, and CDH1 were studied using the Spearman and Pearson coefficient. In all statistical tests, two-tailed P-values ≤ 0.05 were considered statistically significant. Statistical analysis was performed using SPSS, version 11.0 (SPSS, Inc.).
In vitro transcription
Plasmids were linearized using AfeI, and transcription reactions were performed using the T/MEGAscript kit (Ambion). When indicated, RNAs were capped by adding to the reaction m7G(5′)ppp(5′)G Cap analog (Ambion). The integrity of the resultant RNAs was checked in 1% agarose gels.
Luciferase reporter assay
Reporter assays were performed using 200–400 ng of the indicated constructions containing the different fragments of Zeb2 5′-UTR sequence clones in pGL3 or pRF plasmids. Transfections were performed as reported previously using Lipofectamine (Gibco) (Batlle et al. 2000). When appropriate, cells were also transfected with 50 ng of the NAT inserted in the pcDNA3 plasmid. Renilla luciferase was also cotransfected to control efficiency of transfection. Expression of Firefly and Renilla luciferases was analyzed 48 h after transfection according to the manufacturer’s instructions. RNA transfections were performed using 6 μg of the bicistronic constructs syntethized in vitro, and luciferase activity was analyzed 12 h post-transfection.
Western blot
Cell extracts were prepared in SDS buffer (1% SDS, 65 mM Tris-HCl at pH 8.8), lysates were clarified by centrifugation, and supernatants were collected. Western blots were performed according to standard procedures using mabs against Zeb2 (Abcam), E-cadherin (BD Biosciences), or β-tubulin (Sigma). The mab against Zeb2 does not cross-react with Zeb1, on the basis of the absence of signal when extracts from Zeb1-transfected cells were analyzed by Western blot. The two bands occasionally detected with this mab probably correspond to post-translational modifications of Zeb2, as has been published previously (Long et al. 2005), since they were also observed after transfection of Zeb2 cDNA.
Acknowledgments
We greatly appreciate the advice and help of Drs. Juan Valcarcel, Fátima Gebauer, and Raúl Méndez. This study was supported by grants from the Ministerio de Educación y Ciencia (SAF2003-02324 and SAF2006-00339) and the Asociación Española contra el Cáncer (Catalunya contra el Càncer) to A.G.H. Partial support from the Instituto Carlos III (RD06/0020/0040) and from the Generalitat de Catalunya (2005SGR00970) is also appreciated. M.B. is a recipient of a predoctoral fellowship from the Instituto Carlos III.
Footnotes
Article is online at http://www.genesdev.org/cgi/doi/10.1101/gad.455708.
References
- Barberà M.J., Puig I., Domínguez D., Julien-Grille S., Guaita-Esteruelas S., Peiro S., Baulida J., Francí C., Dedhar S., Larue L., et al. Regulation of Snail transcription during epithelial to mesenchymal transition of tumor cells. Oncogene. 2004;23:7345–7354. doi: 10.1038/sj.onc.1207990. [DOI] [PubMed] [Google Scholar]
- Batlle E., Verdú J., Dominguez D., Llosas M.M., Díaz V., Loukiili N., Paciucci R., Alameda F., García de Herreros A. Protein kinase C-α activity differently modulates invasion and growth of intestinal cells. J. Biol. Chem. 1998;273:15091–15098. doi: 10.1074/jbc.273.24.15091. [DOI] [PubMed] [Google Scholar]
- Batlle E., Sancho E., Francí C., Domínguez D., Monfar M., Baulida J., García de Herreros A. The transcription factor Snail is a repressor of E-cadherin gene expression in epithelial tumor cells. Nat. Cell Biol. 2000;2:84–89. doi: 10.1038/35000034. [DOI] [PubMed] [Google Scholar]
- Bindels S., Mestdagt M., Vanderwalle C., Jacobs N., Volders L., Noël A., van Roy F., Berx G., Foidart J.M., Gilles C. Regulation of vimentin by Sip1 in human epithelial breast tumor cells. Oncogene. 2006;25:4975–4985. doi: 10.1038/sj.onc.1209511. [DOI] [PubMed] [Google Scholar]
- Brantl S. Antisense-RNA regulation and RNA interference. Biochim. Biophys. Acta. 2002;1575:15–25. doi: 10.1016/s0167-4781(02)00280-4. [DOI] [PubMed] [Google Scholar]
- Cano A., Pérez-Moreno M.A., Rodrigo I., Locascio A., Blanco M.J., del Barrio M.G., Portillo F., Nieto M.A. The transcription factor Snail controls epithelial–mesenchymal transitions by repressing E-cadherin expression. Nat. Cell Biol. 2000;2:78–83. doi: 10.1038/35000025. [DOI] [PubMed] [Google Scholar]
- Comijn J., Berx G., Vermassen P., Verschueren K., van Grunsven L., Bruyneel E., Mareel M., Huylebroeck D., van Roy F. The two-handed E box binding zinc finger protein SIP1 downregulates E-cadherin and induces invasion. Mol. Cell. 2001;7:1267–1278. doi: 10.1016/s1097-2765(01)00260-x. [DOI] [PubMed] [Google Scholar]
- Dahary D., Elroy-Stein O., Sorek R. Naturally occurring antisene: Transcriptional leakage or real overlap? Genome Res. 2005;15:364–368. doi: 10.1101/gr.3308405. [DOI] [PMC free article] [PubMed] [Google Scholar]
- Eger A., Aigner K., Sonderegger S., Dampier B., Oehler S., Schreiber M., Berx G., Cano A., Beug H., Foisner R. DeltaEF1 is a transcriptional repressor of E-cadherin and regulates epithelial plasticity in breast cancer cells. Oncogene. 2005;24:2375–2385. doi: 10.1038/sj.onc.1208429. [DOI] [PubMed] [Google Scholar]
- Esteban M.A., Tran M.G.B., Harten S.K., Hill P., Castellanos M.C., Chandra A., Raval R., O’Brien T.S., Maxwell P. Regulation of E-cadherin expression by VHL and hypoxia-inducible factor. Cancer Res. 2006;66:3567–3575. doi: 10.1158/0008-5472.CAN-05-2670. [DOI] [PubMed] [Google Scholar]
- Evans A.J., Russell R.C., Roche O., Burry T.N., Fish J.E., Chow V.W.K., Kim W.Y., Saravanan A., Maynard M., et al. VHL promotes E2 box-dependent E-cadherin transcription by HIF-mediated regulation of SIP1 and Snail1. Mol. Cell. Biol. 2007;27:157–169. doi: 10.1128/MCB.00892-06. [DOI] [PMC free article] [PubMed] [Google Scholar]
- Grooteclaes M.L., Frisch S.M. Evidence for a function of CtBP in epithelial gene regulation and anoikis. Oncogene. 2000;19:3823–3828. doi: 10.1038/sj.onc.1203721. [DOI] [PubMed] [Google Scholar]
- Guaita S., Puig I., Franci C., Garrido M., Domínguez D., Batlle E., Sancho E., Dedhar S., Garcia de Herreros A., Baulida J. Snail induction of epithelial-to-mesenchymal transition in tumor cells is accompanied by MUC-1 repression and ZEB1 expression. J. Biol. Chem. 2002;277:39209–39216. doi: 10.1074/jbc.M206400200. [DOI] [PubMed] [Google Scholar]
- Hastings M.L., Inhe H.A., Lazar M.A., Munroe S.H. Post-transcriptional regulation of thyroid hormone receptor expression by cis-acting sequences and a naturally occurring antisense RNA. J. Biol. Chem. 2000;275:11507–11513. doi: 10.1074/jbc.275.15.11507. [DOI] [PubMed] [Google Scholar]
- Hellen C., Sarnow P. Internal ribosome entry sites in eukaryotic mRNA molecules. Genes & Dev. 2001;15:1593–1621. doi: 10.1101/gad.891101. [DOI] [PubMed] [Google Scholar]
- Holcik M., Sonenberg N. Translational control in stress and apoptosis. Nat. Rev. Mol. Cell Biol. 2005;6:318–327. doi: 10.1038/nrm1618. [DOI] [PubMed] [Google Scholar]
- Huber M.A., Kraut N., Beug H. Molecular requirements for epithelial–mesenchymal transition during tumor progression. Curr. Opin. Cell Biol. 2005;17:1–11. doi: 10.1016/j.ceb.2005.08.001. [DOI] [PubMed] [Google Scholar]
- Katayama S., Tomaru Y., Kasukawa T., Waki K., Nakanishi M., Nakamura M., Nishida H., Yap C.C., Suzuki M., Kawai J., et al. Antisense transcription in the mammalian transcriptome. Science. 2005;309:1564–1566. doi: 10.1126/science.1112009. [DOI] [PubMed] [Google Scholar]
- Kozak M. Pushing the limits of the scanning mechanism for initiation of translation. Gene. 2002;299:1–34. doi: 10.1016/S0378-1119(02)01056-9. [DOI] [PMC free article] [PubMed] [Google Scholar]
- Krishnamanchary B., Zagzag D., Nagaswa H., Rainey K., Okuyama H., Baek J.H., Semenza G.L. Hypoxia-inducible factor 1-dependent repression of E-cadherin in von Hippel-Lindau tumor suppressor-null renal cell carcinoma mediated by TCF3, ZFHX1A and ZFHX1B. Cancer Res. 2006;66:2725–2731. doi: 10.1158/0008-5472.CAN-05-3719. [DOI] [PubMed] [Google Scholar]
- Lehner B., Williams G., Campbell D., Sanderson C.M. Antisense transcripts in the human genome. Trends Genet. 2002;18:63–65. doi: 10.1016/s0168-9525(02)02598-2. [DOI] [PubMed] [Google Scholar]
- Long J., Zuo D., Park M. Pc2-mediated sumoylation of Smad-interacting protein 1 attenuates transcriptional repression of E-cadherin. J. Biol. Chem. 2005;280:35477–35489. doi: 10.1074/jbc.M504477200. [DOI] [PubMed] [Google Scholar]
- Maeda M., Johnson K.R., Wheelock M.J. Cadherin switching: Essential for behavioral but not morphological changes during an epithelium-to-mesenchyme transition. J. Cell Sci. 2005;118:873–887. doi: 10.1242/jcs.01634. [DOI] [PubMed] [Google Scholar]
- Miettinen P.J., Ebner R., Lopez A.R., Derynck R. TGF-β induced transdifferentiation of mammary epithelial cells to mesenchymal cells: Involvement of type I receptors. J. Cell Biol. 1994;127:2021–2036. doi: 10.1083/jcb.127.6.2021. [DOI] [PMC free article] [PubMed] [Google Scholar]
- Munroe S.H., Lazar M.A. Inhibition of c-erbA mRNA splicing by a naturally occurring antisense RNA. J. Biol. Chem. 1991;266:22083–22086. [PubMed] [Google Scholar]
- Nelles L., Van de Putte T., van Grunsven L., Huylebroeck D., Verschueren K. Organization of the mouse Zfh1b gene encoding the two-handed zinc finger repressor Smad-interacting protein-1. Genomics. 2003;82:460–469. doi: 10.1016/s0888-7543(03)00169-1. [DOI] [PubMed] [Google Scholar]
- Peinado H., Olmeda D., Cano A. Snail, ZEB and bHLH factors in tumour progression: An alliance against the epithelial phenotype? Nat. Rev. Cancer. 2007;7:415–428. doi: 10.1038/nrc2131. [DOI] [PubMed] [Google Scholar]
- Pelletier J., Sonenberg N. Internal initiation of translation of eukaryotic mRNA directed by a sequence derived from poliovirus RNA. Nature. 1988;334:320–325. doi: 10.1038/334320a0. [DOI] [PubMed] [Google Scholar]
- Peiró S., Escrivà M.J., Puig I., Barberà M.J., Dave N., Larriba M.J., Takkunen M., Francí C., Muñoz A., Virtanen I., et al. Snail1 transcriptional repressor binds to its own promoter and controls its expression. Nucleic Acids Res. 2006;34:2077–2084. doi: 10.1093/nar/gkl141. [DOI] [PMC free article] [PubMed] [Google Scholar]
- Peña C., García J.M., García V., Silva J., Domínguez G., Rodríguez R., Maximiano C., García de Herreros A., Muñoz A., Bonilla F. The expression levels of the transcriptional regulators p300 and CtBP modulate the correlations between SNAIL, ZEB1, E-cadherin and vitamin D receptor in human colon carcinomas. Int. J. Cancer. 2006;119:2098–2104. doi: 10.1002/ijc.22083. [DOI] [PubMed] [Google Scholar]
- Peters N.T., Rohrbach J.A., Zalewski B.A., Byrkett C.M., Vaughn J.C. RNA editing and regulation of Drosophila 4f-rnp expression by sas-10 antisense read through mRNA transcripts. RNA. 2003;9:698–710. doi: 10.1261/rna.2120703. [DOI] [PMC free article] [PubMed] [Google Scholar]
- Prescott E.M., Proudfoot N.J. Transcriptional collision between convergent genes in budding genes. Proc. Natl. Acad. Sci. 2002;99:8796–8801. doi: 10.1073/pnas.132270899. [DOI] [PMC free article] [PubMed] [Google Scholar]
- Rougeulle C., Heard E. Antisense RNA in imprinting: Spreading silence through air. Trends Genet. 2002;18:434–437. doi: 10.1016/s0168-9525(02)02749-x. [DOI] [PubMed] [Google Scholar]
- Thiery J.P. Epithelial–mesenchymal transitions in development and pathologies. Curr. Opin. Cell Biol. 2003;15:740–746. doi: 10.1016/j.ceb.2003.10.006. [DOI] [PubMed] [Google Scholar]
- Vanderwalle C., Comijn J., De Craene B., Vermassen P., Bruyneel E., Andersen H., Tulchinsky E., Van Roy F., Berx G. Sip1/Zeb2 induces EMT by repressing genes of different epithelial cell–cell junctions. Nucleic Acids Res. 2005;33:6566–6578. doi: 10.1093/nar/gki965. [DOI] [PMC free article] [PubMed] [Google Scholar]
- Verschueren K., Remacle J.E., Collart C., Kraft H., Baker B.S., Tylzanowski P., Nelles L., Wuytens G., Su M.T., Bodmer R., et al. SIP1, a novel zinc finger/homeodomain repressor, interacts with Smad proteins and binds to 5′-CACT sequences in candidate target genes. J. Biol. Chem. 1999;274:20489–20498. doi: 10.1074/jbc.274.29.20489. [DOI] [PubMed] [Google Scholar]
- Yelin R., Dahary D., Sorek R., Levanon E.Y., Goldstein O., Shoshan A., Diber A., Biton S., Tamir Y., Khosravi R., et al. Widespread occurrence of antisense transcription in the human genome. Nat. Biotechnol. 2003;21:379–386. doi: 10.1038/nbt808. [DOI] [PubMed] [Google Scholar]


