

Abstract
Abdominal obesity is a principal risk factor in the development of metabolic syndrome. Previously, we showed that a palatinose-based liquid formula, Inslow/MHN-01, suppressed postprandial plasma glucose level and reduced visceral fat accumulation better than the standard formula (SF). To elucidate the mechanism of Inslow-mediated anti-obesity effect, expression levels of genes involved in the glucose and lipid metabolism were compared in Inslow- and SF-fed rats. Both fasting plasma insulin level and average islet sizes were reduced in the Inslow group. We also found less abdominal fat accumulation and reduced hepatic triacylglycerol content in the Inslow group. Expression of the β-oxidation enzymes and uncoupling potein-2 (UCP-2) mRNAs in the liver of the Inslow group were higher than the SF group, which was due to a concomitant higher expression of the peroxisome proliferator-activated receptor (PPAR)-α mRNA in the former. Furthermore, expression of the UCP-2 and adiponectin mRNAs in the epididymal fat were higher in the Inslow group than the SF group, and were stimulated by a concomitant increase of the PPAR-γ gene expression in the former. These results strongly suggested that the anti-obesity effect of Inslow was due to an increase in the hepatic PPAR-α and adipocyte PPAR-γ gene expressions.
Keywords: palatinose, PPAR-α, PPAR-γ, fat oxidation, insulin-sparing effect
Introduction
Metabolic syndrome, characterized by hyperglycemia and dyslipidemia, is increasingly becoming prevalent in industrialized countries [1, 2]. Obesity is the principal risk factor of metabolic syndrome, and is developed when the energy intake exceeds the energy expenditure [3, 4]. In particular, high fat diets induces hyperglycemia and hyperinsulinemia due to pancreas overworking and/or dysfunction, and increases fat storage in the liver and adipose tissue. Consequently, the vicious cycle of the insulin resistance is enhanced.
It is well known that liver and adipose tissues play important roles in lipid and glucose homeostasis. Peroxisomal proliferator-activated receptor (PPAR)-α has a role in fatty acid catabolism and is expressed at high levels in the liver [5–7]. PPAR-γ, which is most abundant in adipose tissues, modulates the expression of the genes involved in lipogenesis and also of the adipokine gene [5, 8, 9]. Furthermore, PPAR-γ up-regulates adiponectin gene expression in the white adipose tissues [10]. Increased level of adiponectin enhances insulin sensitivity by increasing the fat oxidation, resulting in reduced levels of circulating fatty acids and intracellular triacylglycerol content in the liver and skeletal muscle [11].
Recently, it was suggested that a dual activation of both PPAR-α in the liver and PPAR-γ in the adipose tissue are important for the improvement of the obesity-associated hyperlipidemia and diabetes [12–14]. Therefore, finding a food source or a nutrient capable of activating the functions of both PPAR-α and PPAR-γ would be very desirable for the treatment and prevention of diseases associated with obesity. The glycemic index (GI), originally described by Jenkins et al., is a ranking of carbohydrates based on their immediate effects on blood glucose levels [15]. Several studies recently reported that low GI diets improved both glycemic control and blood lipid profiles [16, 17]. Furthermore, Pawlak et al. suggested that low GI diet protects β cell expansion and dysfunction [18]. We previously reported that the MHN-01 (Inslow), which was developed as a low GI liquid formula, containing palatinose and oleic acid, suppressed postprandial hyperglycemia, and reduced hepatic and visceral fat accumulation better than other commercially available conventional standard formulas (SF), despite the daily food intake remaining the same for long-term period in both groups [19]. However, the detail mechanism of anti-obesity effect on rat fed Inslow is not clear.
In this study, to elucidate the mechanism of Inslow-mediated anti-obesity effect, we compared the expression of several glucose and lipid metabolism-related genes in Inslow-fed Sprague-Dawley rats with those of the SF-fed rats.
Materials ands Methods
Animals and diets
All protocols for animal use and euthanasia were reviewed and approved by the Animal Care Committee of the University of Tokushima and were in accordance with National Institute of Health guidelines. Sprague-Dawley 19-week-old male rats obtained from SLC (Shizuoka, Japan) were used for the experiment. All rats were maintained under a 12 hr light-dark cycle (lights on from 08:00 to 20:00). They were fed a standard chow MF (Oriental Yeast Co., Tokyo, Japan) and water ad libitum for 1 week. After the rats were allowed to fast for 24 hours, blood samples were collected under nonanesthesia from the tail vein for the measurement of plasma glucose and insulin, and under diethyl ether anesthesia from the left jugular vein for the measurement of plasma triacyglycerol, free fatty acids (FFAs) and total cholesterol. Blood glucose was measured by the glucose oxidase method using Accu-Chek (Roche Diagnostics, Tokyo, Japan). Plasma insulin level (IRI) was measured with a commercially available enzyme-linked immunosorbent assay (ELISA) kit (Morinaga, Yokohama, Japan). Plasma triacyglycerol and FFAs level were measured using the triacyglycerol and NEFA kit (Wako, Osaka, Japan).
After the acclimatization period, rats were divided into two groups: spray-dried Inslow powder fed-rats and spray-dried SF powder fed-rats, as reported previously [19] (Table 1). Each group was administered a given diet (80 kcal/day) with pair feeding condition and water ad libitum for 8 weeks. Food intake was measured daily and the body weight was measured weekly during the experimental period.
Table 1.
Composition of experimental diets
| SF | Inslow | |
|---|---|---|
| Energy balance | ||
| Protein (%) | 16.0 | 20.0 |
| Fat (%) | 25.0 | 29.7 |
| Carbohydrate (%) | 59.0 | 50.3 |
| Fatty acid composition include | ||
| Palmitic acid (%) | 6.0 | 5.8 |
| Stearic acid (%) | 3.0 | 3.7 |
| Oleic acid (%) | 45.0 | 68.5 |
| Linoleic acid (%) | 32.0 | 12.6 |
| α-linolenic acid (%) | 8.0 | 4.2 |
| Other fatty acid (%) | 6.0 | 5.2 |
| Carbohydrate composition include | ||
| Palatinose (%) | 55.7 | |
| Branched dextrin (%) | 23.9 | |
| Xylitol (%) | 5.3 | |
| Dextrin (%) | 97.2 | |
| Sucrose (%) | 2.8 | |
| Other carbohydrate (%) | 15.1 |
SF: standard formula
Preparation of organs and determination of triacylglycerol content of liver
All rats on experimental diets were sacrificed after 8 weeks for histological preparations, or to extract total RNA. The organs were removed and weighed. After weighing, liver and epididymal fat were immediately frozen in liquid nitrogen and stored at −80°C until they were used for total RNA extraction and triacylglycerol content measurement. Total lipid was extracted from the liver tissues by the method of Folch et al. as previously described using 2:1 (v/v) chloroform–methanol [20]. The lipid concentration was determined by using the triacyglycerol KIT (Wako, Osaka, Japan).
Histological analysis of pancreas, adipose and hepatic tissues and determination of islet and adipocyte sizes
Freshly isolated pancreas, liver and mesenteric fat were fixed in formaldehyde, dehydrated with increasing concentrations of ethanol (the final step in 100% ethanol), and embedded in paraffin. All tissues were cut into 5 µm sections, the sections were mounted on SuperFrost® slide glasses (Matsunami Glass Ind., Ltd., Osaka, Japan) and were stained with hematoxylin and eosin (H&E). To measure the sizes of the islets and adipocyte, images were captured with a Nikon DXM1200 digital camera and analyzed using Image-Pro Plus 6.0 software (Media Cybernetics, Silver Springs, MD).
RNA extraction and real-time quantitative PCR
The tissue was homogenized in ISOGEN (Nippon Gene Inc, Tokyo, Japan) with a Polytron tissue homogenizer. Total RNA was extracted with chloroform, precipitated with isopropanol, washed with 75% (v/v) ethanol, dissolved in diethyl pyrocarbonate (DEPC) water. The RNA concentration was determined by measuring the absorbance at 260 nm.
For cDNA synthesis, 5 µg of total RNA was used as template. Briefly, the RNA was mixed with 3 µl of random primers (50 ng/µl) and DEPC-treated water to a final volume of 25 µl, incubated at 70°C for 10 min, followed by incubation on ice for 10 min. Then 1 µl of M-MLV-RT (200 units/µl), 10 µl of 5x first strand synthesis buffer, 10 µl of 2.5 mM dNTP, 5 µl of 0.1 mM DTT and 2 µl of DEPC-treated water was added to the RNA/primer mix and incubated at 42°C for 1 hr. The reaction was stopped by heat in activation at 95°C for 2 min and rapidly cooled on ice. The cDNA was stored immediately at −20°C.
Real-time quantitative PCR was performed in a fluorescence temperature cycler (LightCyclerTM, Roche Molecular Biochemicals, Mannheim, Germany) according to the manufacturer’s instructions. The 20 µl amplification mixture contained 1 µl of cDNA, 0.8 µl of plus 25 mM MgCl2, 1 µl of each primer, 10 µl of 2 × QuantiTectTM SYBER® Green PCR Master Mix (QIAGEN, Tokyo, Japan) and 6.2 µl of dH2O. After 15 min preincubation at 95°C, the PCR amplification was performed for 50 cycles using the following cycling conditions: 10 sec denaturation at 95°C, 15 sec annealing at 60°C, and 15 sec extension at 72°C. Primers were designed using the manufacturer’s software and the sequences available in the GenBankTM database. Table 2 shows the sequences of the gene specific PCR primers. The relative expression levels of the mRNAs of the target genes were normalized using the β-actin internal standard.
Table 2.
Primers sets for real-time PCR analysis
| GenBank accession no. | Forward 5' → 3' | Reverse 5' → 3' | Product length (bp) | |
|---|---|---|---|---|
| PPAR-α | M88529 | tgtatgaagccatcttcacg | ggcattgaacttcatagcga | 163 |
| PPAR-γ | AF156665 | tcaaaccctttaccacggtt | caggctctactttgatcgca | 147 |
| SREBP1c | AF286470 | ggagccatggattgcacattt | tccttcgaaggtctctcctc | 190 |
| CPT-1 | NM-031559 | ggtgggccacaaattacgtg | cagcatctccatggcgtagt | 104 |
| DCI | NM-017306 | tccgaggtgtcatcctcact | tgcacagccttccagtactc | 115 |
| ACO | J02752 | atggcagtccggagaataccc | cctcataacgctggcttcgagt | 114 |
| FAS | M76767 | tgggcccagcttcttagcc | ggaacagcgcagtaccgtaga | 104 |
| Acrp30 | NM-144744 | ggaaacttgtgcaaggttgga | ggtcacccttaggaccaaga | 140 |
| TNF-α | NM-012675 | atggatctcaaagacaacca | tcctggtatgaaatggcaaa | 143 |
| UCP-2 | NM-019354 | tctcccaatgttgcccgaaa | gggaggtcgtctgtcatgag | 107 |
| GK | J04218 | gtgaggcacgaagacctaga | ctgtgtcgttcaccattgcc | 160 |
| L-PK | L37333 | ctgccttctggatatcgact | gagtcgtgcaatgttcatcc | 133 |
| G6Pase | M11709 | cctccaagtgaattacgaag | cagtctcttgaatgtggaac | 116 |
| PEPCK | AH007109 | agacaaatccgaacgccatt | catcctgtggtctccactct | 162 |
| β-actin | NM-031144 | gtcccagtatgcctctggtcgtac | ccacgctcggtcaggatcttcatg | 171 |
PPAR, peroxisome proliferator activated receptor; SREBP1c, sterol response element binding protein 1c; CPT-1, carnitine palmitoyltransferase 1; DCI, 3-2 trans enoyl-coA isomerase; ACO, acyl-CoA oxidase; FAS, fatty acid synthase; Acrp30, adiponectin; TNF-α, tumor necrosis factor-α; UCP-2, uncoupling protein-2; GK, glucokinase; L-PK, liver-type pyruvate kinase; G6Pase, glucose 6-phosphatase; PEPCK, phosphoenolpyrvate carboxykinase.
Statistical analysis
Data are expressed as mean ± S.E. The statistical significance of the differences in mean values between the Inslow and SF groups were assessed by Student’s t test. All statistical analyses were performed using StatView software (Windows, version 5.0).
Results
Effects of Inslow on glucose and lipid metabolism
Table 3 shows the metabolic parameters after the ingestion of Inslow or SF for 8 weeks. In both groups, there was no difference in average food intake. However, the average body weight gain in the Inslow group was significantly lower than that in the SF group (p<0.05). Furthermore, the average IRI level was significantly lower in the Inslow group than in the SF group (p<0.01) although the average fasting blood glucose levels in both groups were not different. In addition, the average plasma triacylglycerol level in the Inslow-fed rats was significantly lower than that in the SF-fed rats (p<0.01), whereas the average FFAs and total cholesterol levels were comparable between the two groups.
Table 3.
Effects of SF and Inslow diets on food intake, body weight gain and plasma parameter levels in SD rats
| SF | Inslow | ||
|---|---|---|---|
| Food intake (kcal/day) | 73.4 ± 2.6 | 72.6 ± 4.5 | |
| Body weight gain (g/8wks) | 79.8 ± 15.0 | 33.7 ± 10.0 | * |
| Glucose (mmol/l) | 4.54 ± 0.63 | 4.23 ± 0.41 | |
| Insulin (pmol/l) | 1171.00 ± 81.33 | 755.33 ± 41.67 | ** |
| Free fatty acid (mEq/l) | 0.62 ± 0.02 | 0.58 ± 0.06 | |
| Total-cholesterol (mmol/l) | 1.98 ± 0.13 | 2.20 ± 0.14 | |
| Triacylglycerol (mmol/l) | 1.23 ± 0.13 | 0.57 ± 0.05 | ** |
SF:standard formula. Data are presented as mean ± SE. *: p<0.05, vs SF, **: p<0.01, vs SF.
Histological analysis of the pancreas
Because the IRI level was significantly lower in the Inslow group, we histologically analyzed the size of the islets in Inslow and SF groups. Representative results obtained from the Inslow and SF groups are shown in Fig. 1 A and B, respectively. As shown, the average area of islets in the Inslow group was approximately one-half of that in the SF group (compare Fig. 1 A and B; p<0.05). Interestingly, smaller islet size may explain why the IRI level in the Inslow group was lower than that in the SF group, as documented in Table 3.
Fig. 1.
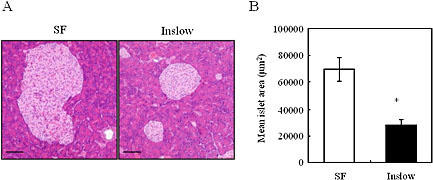
Effects of SF and Inslow diets on pancreas. A) Hematoxylin and eosin staining of the pancreas. Original magnification, ×200. Scale bars indicate 100 µm. B) Mean islet size. Values are expressed as mean ± SE (n = 5). *p<0.05 vs SF.
Effects of Inslow administration on the expression of hepatic glucose and lipid metabolism genes
Fig. 2A shows hematoxylin and eosin stained liver tissues from the Inslow and SF groups. As shown, Inslow group contains less lipid accumulation than the SF group. Consistent with this observation, we found that the hepatic triacylglycerol level was significantly lower in the Inslow group than the SF group (Fig. 2B; p<0.05). Next, we performed real-time PCR analysis of hepatic samples to investigate the expression profiles of genes involved in the glucose and lipid metabolism. There were no differences in the mRNA levels of the hepatic glycolytic genes (such as glucokinase and pyruvate kinase), and hepatic gluconeogenic genes (such as glucose 6-phosphatase (G6Pase) and phosphoenolpyrvate carboxykinase (PEPCK)) between the Inslow and SF groups (data not shown). In contrast, expression level of the PPAR-α mRNA, a gene involved in the lipid metabolism, was significantly higher in the Inslow group compared with that in the SF group (Fig. 2C: p<0.01), although the expression level of the sterol response element binding protein 1c (SREBP1c) gene, another gene involved in lipid metabolism, showed no difference between these two groups (data not shown). Expressions of ACO (Fig. 2C), CPT-1 (Fig. 2C) and DCI (data not shown) genes, which are involved in lipid metabolism and are known to be up-regulated by PPAR-α, were significantly higher in the Inslow group than in the SF group (p<0.05, p<0.05 and p<0.01, respectively). We have also found that the expression level of the FAS mRNA was slightly lower (data not shown) and the expression level of the UCP-2 mRNA was significantly higher (Fig. 2C, p<0.05) in the Inslow group as compared to those in the SF group.
Fig. 2.
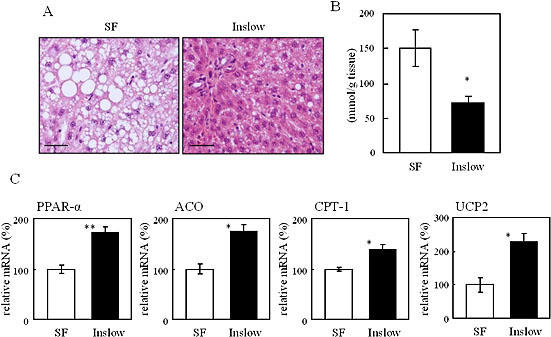
Effects of SF and Inslow on lipid metabolism in liver. A) Hematoxylin and eosin staining of the liver. Original magnification, ×200. Scale bars indicate 100 µm. B) Hepatic triacylglycerol content. C) Hepatic gene expression. The gene expression level was expressed relative to the SF group (=100%) after normalization using the β-actin gene expression level. Values are expressed as mean ± SE (n = 5). *p<0.05, **p<0.01 vs SF.
Effects of Inslow administration on the expression of adipocyte lipid metabolism genes
As shown in Fig. 3A, the mesenteric, epididymal and retroperitoneal fat masses in the Inslow group were significantly lower than those in the SF group (p<0.0001, p<0.05 and p<0.001, respectively). The average sizes of the adipocytes in the Inslow group were significantly smaller than those in the SF group in mesenteric fat (Fig. 3B); the reduced adipocyte size might explain the decreased abdominal fat mass. Fig. 3C shows the expression of several lipid metabolism associated genes in Inslow and SF adipose tissues. Expression of the PPAR-γ, UCP-2, adiponectin mRNAs in the epididymal fat of the Inslow group were higher in the Inslow than in the SF group. The expression of the CPT-1 and DCI mRNAs in the Inslow group were also higher than those in the SF group (data not shown). In contrast, expression of the TNF-α mRNA in the Inslow group was lower than that in the SF group (Fig. 3C).
Fig. 3.
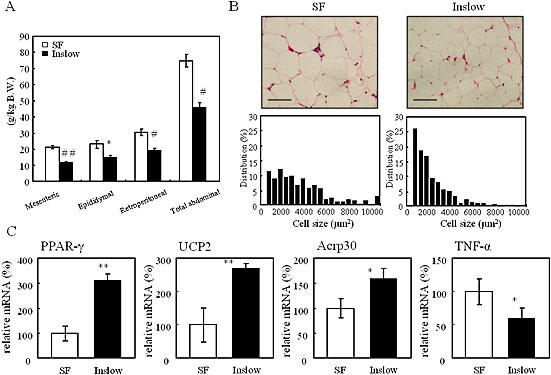
Effects of SF and Inslow diets on adiposity in white adipose tissue (WAT). A) Weight of mesenteric, epididymal, retroperitoneal and total abdominal fat. B) Histological analysis (top), and cell size distribution (bottom) of mesenteric WAT. Bar indicates 100 µm. C) Adipose gene expression. The gene expression level was expressed relative to the SF group (=100%) after normalization using the β-actin gene expression level. Values are expressed as mean ± SE (n = 5). *p<0.05, **p<0.01, #p<0.001, ##p<0.0001 vs SF.
Discussion
In this study, we have observed that even though there was no significant difference in the amount of food intake between the Inslow and SF groups, the Inslow group showed less body weight gain in 8 weeks than the SF group. This significant decrease in the body weight gain of the Inslow-fed rats can be attributed to the effectively small amount of plasma insulin levels in these animals, causing suppression of postprandial hyperglycemia described in our previous report [19]. High concentration of glucose was shown to induce β-cell apoptosis in cultured human and rodent islets [21, 22]. It was also suggested that suppression of early insulin secretion controls additional over secretion, and thus, represses the possibility of pancreatic exhaustion. Pawlak et al. [18] reported that animals fed a high-GI diet tended to have a larger β-cell mass compared to those fed a low-GI diet. Results shown in this study also suggested that Inslow feeding protected islets from hypertrophic change. Hyperglycemia was shown to lower β-cell insulin content as a result of chronic overstimulation [23]. Together, these data suggest that Inslow might reduce the burden on the endocrine pancreas by reducing postprandial plasma glucose and produce insulin–sparing effect. Consequently, the insulin-sparing might prevent obesity.
Increased levels of hepatic PPAR-α, β-oxidation enzymes and UCP-2 mRNAs might explain the lower plasma and hepatic triacylglycerol levels in the Inslow group. The liver plays a central role in whole-body glucose and lipid homeostasis, and the hepatic regulation of the expression of the genes involved in fat oxidation is dependent on functional PPAR-α [5, 24]. PPAR-α is the molecular target for the hypolipidemic fibrate drugs, such as clofibrate, fenofibrate and benzafibrate, which are used for the treatment of dyslipidemia [7, 25, 26]. It is suggested that the role of UCP-2 is to eliminate excess energy, and to reduce free radical formation within the cell. In obesity-resistant strain mice, UCP-2 mRNA levels significantly increased in response to a high-fat diet [27]. Induction of UCP-2 may reduce reactive oxygen species (ROS) [28–30]. Furthermore, it has been shown that the level of plasma thiobarbituric acid-reactive substance, a marker of lipid peroxidation, is inversely proportional to the hepatic PPAR-α mRNA levels [31]. Therefore, we suggest that Inslow, like fibrate drugs, exerts hypolipidemic effect, controls energy expenditure and plays a protective role against formation of ROS.
In the adipose tissue, expression of the PPAR-γ and adiponectine genes were increased in the Inslow group as compared to those in the SF group. The PPAR-γ is a master regulator of adipocyte differentiation, and controls expressions of various kinds of adipocyte specific genes [5]. Pharmacologial activators of PPAR-γ, such as thiazolidinedione (TZD), significantly improve insulin sensitivity in type 2 diabetes [32, 33]. Okuno et al. [34] previously reported that in obese rats TZD did not change the total weight of the white adipose tissues, but increased the number of small adipocytes. Our results show that Inslow decreased the abdominal fat mass and increased the number of small adipocytes. Furthermore, Inslow enhanced the β-oxidation enzyme gene expression in the adipose tissue. Therefore, we suggest that Inslow promotes insulin–sparing effect, increases the number of small adipocyte, and increases the expression of the PPAR-γ mRNA to stimulate the fatty acid utilization.
Adiponectin is an adipocyte-derived hormone that plays a role in insulin sensitivity and energy homeostasis [11]. Previous reports showed that both heterozygous PPAR-γ deficiency [35] and administration of PPAR-γ agonist [36] up-regulated the adiponectin mRNA level in the small size adipocytes. Increased plasma adiponectin level improves insulin action accompanied by enhanced fatty acid oxidation in liver and muscle [10, 37]. Furthermore, recent reports showed that adiponectin enhanced AMP-activated protein kinase (AMPK) phosphorylation, which resulted in increased fatty acid oxidation [38]. Therefore, increased adiponectin mRNA expression in the Inslow administered group might be attributable to the activation of the adiponectin promoter via the PPAR-γ pathway, which might consequently enhance the fatty acid oxidation in liver.
In conclusion, our findings suggested that Inslow, which contains palatinose, was an effective functional food for the prevention and treatment of obesity, diabetes and metabolic syndrome because it can maintain the glucose and lipid homeostasis by regulating the expression of the hepatic PPAR-α and adipose PPAR-γ genes.
Acknowledgments
This work was supported by Grants-in-Aid for Scientific Research from the Ministry of Education, Culture, Sports, Science and Technology in Japan (for H.A., Y.T., E.T.), and from the 21th Century COE Program, Human Nutritional Science on Stress Control, Tokushima, Japan.
References
- 1.Ford E.S., Giles W.H., Dietz W.H. Prevalence of the metabolic syndrome among US adults: findings from the third National Health and Nutrition Examination Survey. JAMA. 2002;287:356–359. doi: 10.1001/jama.287.3.356. [DOI] [PubMed] [Google Scholar]
- 2.Grundy S.M., Brewer H.B., Jr., Cleeman J.I., Smith S.C., Jr., Lenfant C. American heart association; national heart, lung, and blood institute. definition of metabolic syndrome: report of the national heart, lung, and blood institute/American heart association conference on scientific issues related to definition. Circulation. 2004;109:433–438. doi: 10.1161/01.CIR.0000111245.75752.C6. [DOI] [PubMed] [Google Scholar]
- 3.Lebovitz H.E. The relationship of obesity to the metabolic syndrome. Int. J. Clin. Pract. Suppl. 2003;134:18–27. [PubMed] [Google Scholar]
- 4.Lubrano C., Cornoldi A., Pili M., Falcone S., Brandetti F., Fabbrini E., Ginanni-Corradini S., Eramo A., Marini M., Migliaccio S., Giancotti V., Badiali M., Falsetto N., Prossomariti G., Spera G. Reduction of risk factors for cardiovascular diseases in morbid-obese patients following biliary-intestinal bypass: 3 years’ follow-up. Int. J. Obes. Relat. Metab. Disord. 2004;28:1600–1606. doi: 10.1038/sj.ijo.0802782. [DOI] [PubMed] [Google Scholar]
- 5.Lee C.H., Olson P., Evans R.M. Minireview: lipid metabolism, metabolic diseases, and peroxisome proliferator-activated receptors. Endocrinology. 2003;44:2201–2207. doi: 10.1210/en.2003-0288. [DOI] [PubMed] [Google Scholar]
- 6.Dreyer C., Keller H., Mahfoudi A., Laudet V., Krey G., Wahli W. Positive regulation of the peroxisomal β-oxidation pathway by fatty acids through activation of peroxisome proliferator-activated receptors (PPAR) Biol. Cell. 1993;77:67–76. doi: 10.1016/s0248-4900(05)80176-5. [DOI] [PubMed] [Google Scholar]
- 7.Peters J.M., Hennuyer N., Staels B., Fruchart J.C., Fievet C., Gonzalez F.J., Auwerx J. Alterations in lipoprotein metabolism in peroxisome proliferator-activated receptor -deficient mice. J. Biol. Chem. 1997;272:27307–27312. doi: 10.1074/jbc.272.43.27307. [DOI] [PubMed] [Google Scholar]
- 8.Barak Y., Nelson M.C., Ong E.S., Jones Y.Z., Ruiz-Lozano P., Chien K.R., Koder A., Evans R.M. PPAR is required for placental, cardiac, and adipose tissue development. Mol. Cell. 1999;4:585–595. doi: 10.1016/s1097-2765(00)80209-9. [DOI] [PubMed] [Google Scholar]
- 9.Kubota N., Terauchi Y., Miki H., Tamemoto H., Yamauchi T., Komeda K., Satoh S., Nakano R., Ishii C., Sugiyama T., Eto K., Tsubamoto Y., Okuno A., Murakami K., Sekihara H., Hasegawa G., Naito M., Toyoshima Y., Tanaka S., Shiota K., Kitamura T., Fujita T., Ezaki O., Aizawa S., Kadowaki T. PPAR mediates high-fat diet-induced adipocyte hypertrophy and insulin resistance. Mol. Cell. 1999;4:597–609. doi: 10.1016/s1097-2765(00)80210-5. [DOI] [PubMed] [Google Scholar]
- 10.Yamauchi T., Kamon J., Waki H., Terauchi Y., Kubota N., Hara K., Mori Y., Ide T., Murakami K., Tsuboyama-Kasaoka N., Ezaki O., Akanuma Y., Gavrilova O., Vinson C., Reitman M.L., Kagechika H., Shudo K., Yoda M., Nakano Y., Tobe K., Nagai R., Kimura S., Tomita M., Froguel P., Kadowaki T. The fat-derived hormone adiponectin reverses insulin resistance associated with both lipoatrophy and obesity. Nat. Med. 2001;7:941–946. doi: 10.1038/90984. [DOI] [PubMed] [Google Scholar]
- 11.Kadowaki T., Yamauchi T. Adiponectin and adiponectin receptors. Endocr. Rev. 2005;26:439–451. doi: 10.1210/er.2005-0005. [DOI] [PubMed] [Google Scholar]
- 12.Doebber T.W., Kelly L.J., Zhou G., Meurer R., Biswas C., Li Y., Wu M.S., Ippolito M.C., Chao Y.S., Wang P.R., Wright S.D., Moller D.E., Berger J.P. MK-0767, a novel dual PPARalpha/gamma agonist, displays robust antihyperglycemic and hypolipidemic activities. Biochem. Biophys. Res. Commun. 2004;318:323–328. doi: 10.1016/j.bbrc.2004.04.032. [DOI] [PubMed] [Google Scholar]
- 13.Guo Q., Sahoo S.P., Wang P.R., Milot D.P., Ippolito M.C., Wu M.S., Baffic J., Biswas C., Hernandez M., Lam M.H., Sharma N., Han W., Kelly L.J., MacNaul K.L., Zhou G., Desai R., Heck J.V., Doebber T.W., Berger J.P., Moller D.E., Sparrow C.P., Chao Y.S., Wright S.D. A novel peroxisome proliferator-activated receptor alpha/gamma dual agonist demonstrates favorable effects on lipid homeostasis. Endocrinology. 2004;145:1640–1648. doi: 10.1210/en.2003-1270. [DOI] [PubMed] [Google Scholar]
- 14.Reifel-Miller A., Otto K., Hawkins E., Barr R., Bensch W.R., Bull C., Dana S., Klausing K., Martin J.A., Rafaeloff-Phail R., Rafizadeh-Montrose C., Rhodes G., Robey R., Rojo I., Rungta D., Snyder D., Wilbur K., Zhang T., Zink R., Warshawsky A., Brozinick J.T. A peroxisome proliferator-activated receptor alpha/gamma dual agonist with a unique in vitro profile and potent glucose and lipid effects in rodent models of type 2 diabetes and dyslipidemia. Mol. Endocrinol. 2005;19:1593–1605. doi: 10.1210/me.2005-0015. [DOI] [PubMed] [Google Scholar]
- 15.Jenkins D.J., Wolever T.M., Taylor R.H., Barker H., Fielden H., Baldwin J.M., Bowling A.C., Newman H.C., Jenkins A.L., Goff D.V. Glycemic index of foods: a physiological basis for carbohydrate exchange. Am. J. Clin. Nutr. 1981;34:362–366. doi: 10.1093/ajcn/34.3.362. [DOI] [PubMed] [Google Scholar]
- 16.Schulze M.B., Liu S., Rimm E.B., Manson J.E., Willett W.C., Hu F.B. Glycemic index, glycemic load, and dietary fiber intake and incidence of type 2 diabetes in younger and middle-aged women. Am. J. Clin. Nutr. 2004;80:348–356. doi: 10.1093/ajcn/80.2.348. [DOI] [PubMed] [Google Scholar]
- 17.Liljeberg H., Bjorck I. Effects of a low-glycaemic index spaghetti meal on glucose tolerance and lipaemia at a subsequent meal in healthy subjects. Eur. J. Clin. Nutr. 2000;54:24–28. doi: 10.1038/sj.ejcn.1600887. [DOI] [PubMed] [Google Scholar]
- 18.Pawlak D.B., Kushner J.A., Ludwig D.S. Effects of dietary glycaemic index on adiposity, glucose homoeostasis, and plasma lipids in animals. Lancet. 2004;364:778–785. doi: 10.1016/S0140-6736(04)16937-7. [DOI] [PubMed] [Google Scholar]
- 19.Arai H., Mizuno A., Matsuo K., Fukaya M., Sasaki H., Arima H., Matsuura M., Taketani Y., Doi T., Takeda E. Effect of a novel palatinose-based liquid balanced formula (Inslow) on glucose and lipid metabolism in male Sprague-Dawley rats after short- and long-term ingestion. Metabolism. 2004;53:977–983. doi: 10.1016/j.metabol.2004.03.004. [DOI] [PubMed] [Google Scholar]
- 20.Folch J., Lees M.S., Stanley G.H. A simple method for the isolation and purification of total lipids from animal tissues. J. Biol. Chem. 1957;116:497–509. [PubMed] [Google Scholar]
- 21.Maedler K., Oberholzer J., Bucher P., Spinas G.A., Donath M.Y. Monounsaturated fatty acids prevent the deleterious effects of palmitate and high glucose on human pancreatic β-cell turnover and function. Diabetes. 2003;52:726–733. doi: 10.2337/diabetes.52.3.726. [DOI] [PubMed] [Google Scholar]
- 22.Efanova I.B., Zaitsev S.V., Zhivotovsky B., Kohler H., Efendic S., Orrenius S., Berqqren P.O. Glucose and tolbutamide induce apoptosis in pancreatic β-cells. A process dependent on intracellular Ca2+ concentration. J. Biol. Chem. 1998;273:33501–33507. doi: 10.1074/jbc.273.50.33501. [DOI] [PubMed] [Google Scholar]
- 23.Song S.H., Rhodes C.J., Veldhuis J.D., Butler P.C. Diazoxide attenuates glucose-induced defects in first-phase insulin release and pulsatile insulin secretion in human islets. Endocrinology. 2003;144:3399–3405. doi: 10.1210/en.2003-0056. [DOI] [PubMed] [Google Scholar]
- 24.Ferre P. The biology of peroxisome proliferator-activated receptors: relationship with lipid metabolism and insulin sensitivity. Diabetes. 2004;53:43S–50S. doi: 10.2337/diabetes.53.2007.s43. [DOI] [PubMed] [Google Scholar]
- 25.Lee S.S., Pineau T., Drago J., Lee E.J., Owens J.W., Kroetz D.L., Fernandez-Salguero P.M., Westphal H., Gonzalez F.J. Targeted disruption of the alpha isoform of the peroxisome proliferator-activated receptor gene in mice results in abolishment of the pleiotropic effects of peroxisome proliferators. Mol. Cell. Biol. 1995;15:3012–3022. doi: 10.1128/mcb.15.6.3012. [DOI] [PMC free article] [PubMed] [Google Scholar]
- 26.Aoyama T., Peters J.M., Iritani N., Nakajima T., Furihata K., Hashimoto T., Gonzalez F.J. Altered constitutive expression of fatty acid-metabolizing enzymes in mice lacking the peroxisome proliferator-activated receptor alpha (PPARalpha) J. Biol. Chem. 1998;273:5678–5684. doi: 10.1074/jbc.273.10.5678. [DOI] [PubMed] [Google Scholar]
- 27.Fleury C., Neverova M., Collins S., Raimbault S., Champigny O., Levi-Meyrueis C., Bouillaud F., Seldin M.F., Surwit R.S., Ricquier D., Warden C.H. Uncoupling protein-2: a novel gene linked to obesity and hyperinsulinemia. Nat. Genet. 1997;15:269–272. doi: 10.1038/ng0397-269. [DOI] [PubMed] [Google Scholar]
- 28.Chavin K.D., Yang S., Lin H.Z., Chatham J., Chacko V.P., Hoek J.B., Walajtys-Rode E., Rashid A., Chen C.H., Huang C.C., Wu T.C., Lane M.D., Diehl A.M. Obesity induces expression of uncoupling protein-2 in hepatocytes and promotes liver ATP depletion. J. Biol. Chem. 1999;274:5692–5700. doi: 10.1074/jbc.274.9.5692. [DOI] [PubMed] [Google Scholar]
- 29.Cortez-Pinto H., Lin H.Z., Yang S.Q., Da Costa S.O., Diehl A.M. Lipids up-regulate uncoupling protein 2 expression in rat hepatocytes. Gastroenterology. 1999;116:1184–1193. doi: 10.1016/s0016-5085(99)70022-3. [DOI] [PubMed] [Google Scholar]
- 30.Shiota G., Tsuchiya H. Pathophysiology of NASH: Insulin Resistance, Free Fatty Acids and Oxidative Stress. J. Clin. Biochem. Nutr. 2006;38:127–132. [Google Scholar]
- 31.Innoe I., Noji S., Shen M.Z., Takahashi K., Katayama S. The peroxisome proliferator-activated receptor (PPAR) regulates the plasma thiobarbituric acid-reactive substance (TBARS) level. Biochem. Biophys. Res. Commun. 1997;237:606–610. doi: 10.1006/bbrc.1997.7196. [DOI] [PubMed] [Google Scholar]
- 32.Nagashima K., Lopez C., Donovan D., Ngai C., Fontanez N., Bensadoun A., Fruchart-Najib J., Holleran S., Cohn J.S., Ramakrishnan R., Ginsberg H.N. Effects of the PPAR gamma agonist pioglitazone on lipoprotein metabolism in patients with type 2 diabetes mellitus. J. Clin. Invest. 2005;115:1323–1332. doi: 10.1172/JCI23219. [DOI] [PMC free article] [PubMed] [Google Scholar]
- 33.Ide T. Seeking for the endogenous ligands for PPARγ. J. Clin. Biochem. Nutr. 2005;37:39–44. [Google Scholar]
- 34.Okuno A., Tamemoto H., Tobe K., Ueki K., Mori Y., Iwamoto K., Umesono K., Akanuma Y., Fujiwara T., Horikoshi H., Yazaki Y., Kadowaki T. Troglitazone increases the number of small adipocytes without the change of white adipose tissue mass in obese Zucker rats. J. Clin. Invest. 1998;101:1354–1361. doi: 10.1172/JCI1235. [DOI] [PMC free article] [PubMed] [Google Scholar]
- 35.Yamauchi T., Kamon J., Waki H., Murakami K., Motojima K., Komeda K., Ide T., Kubota N., Terauchi Y., Tobe K., Miki H., Tsuchida A., Akanuma Y., Nagai R., Kimura S., Kadowaki T. The mechanisms by which both heterozygous peroxisome proliferator-activated receptor gamma (PPARgamma) deficiency and PPARgamma agonist improve insulin resistance. J. Biol. Chem. 2001;276:41245–41254. doi: 10.1074/jbc.M103241200. [DOI] [PubMed] [Google Scholar]
- 36.Hammarstedt A., Sopasakis V.R., Gogg S., Jansson P.A., Smith U. Improved insulin sensitivity and adipose tissue dysregulation after short-term treatment with pioglitazone in non-diabetic, insulin-resistant subjects. Diabetologia. 2005;48:96–104. doi: 10.1007/s00125-004-1612-3. [DOI] [PubMed] [Google Scholar]
- 37.Fruebis J., Tsao T.S., Javorschi S., Ebbets-Reed D., Erickson M.R., Yen F.T., Bihain B.E., Lodish H.F. Proteolytic cleavage product of 30-kDa adipocyte complement-related protein increases fatty acid oxidation in muscle and causes weight loss in mice. Proc. Natl. Acad. Sci. U.S.A. 2001;98:2005–2010. doi: 10.1073/pnas.041591798. [DOI] [PMC free article] [PubMed] [Google Scholar]
- 38.Yamauchi T., Kamon J., Minokoshi Y., Ito Y., Waki H., Uchida S., Yamashita S., Noda M., Kita S., Ueki K., Eto K., Akanuma Y., Froguel P., Foufelle F., Ferre P., Carling D., Kimura S., Nagai R., Kahn B.B., Kadowaki T. Adiponectin stimulates glucose utilization and fatty-acid oxidation by activating AMP-activated protein kinase. Nat. Med. 2002;8:1288–1295. doi: 10.1038/nm788. [DOI] [PubMed] [Google Scholar]