

Abstract
Archaeal ATP synthase (A-ATPase) is the functional homolog to the ATP synthase (F-ATPase) found in bacteria, mitochondria and chloroplasts, but the enzyme is structurally more related to the proton pumping vacuolar ATPase (V-ATPase) found in the endomembrane system of eukaryotes. We have cloned, over-expressed and characterized the stator-forming subunits E and H of the A-ATPase from the thermoacidophilic Archaeon, Thermoplasma acidophilum. Size exclusion chromatography, circular dichroism (CD), MALDI-TOF mass spectrometry and NMR spectroscopic experiments indicate that both polypeptides have a tendency to form dimers and higher oligomers in solution. However, when expressed together or reconstituted, the two individual polypeptides interact with high affinity to form a stable heterodimer. Analyses by gel filtration chromatography and analytical ultracentrifugation show the heterodimer to have an elongated shape, and the preparation to be monodisperse. Thermal denaturation analyses by circular dichroism and differential scanning calorimetry revealed the more co-operative unfolding transitions of the heterodimer in comparison to those of the individual polypeptides. The data are consistent with the EH heterodimer forming the peripheral stalk(s) in the A-ATPase in a fashion analogous to the related V-ATPase.
Keywords: A-ATPase, ATP synthase, rotary molecular motor, stator complex, protein structure
Introduction
The archaeal ATP synthase (A1A0-ATP synthase; A-ATPase) is the functional homolog to the ATP synthase found in bacteria, mitochondria and chloroplasts (F1F0-ATP synthase; F-ATPase) but is structurally more related to the vacuolar proton pumping ATPase (V1V0-ATPase; V-ATPase) found in the endomembrane system of eukaryotic organisms1-4. The A-ATPase is organized in two domains, a water soluble A1 and a membrane bound A0, in analogy to the related F1/V1- and F0/V0 domains of the F- and V-ATPases, respectively. The subunit composition of the A-ATP synthase is A3B3DExFHy for A1 and CIKz for A01. The A1 domain is formed by the catalytic A and non-catalytic B subunits, which are arranged in a pseudo hexagonal barrel surrounding a hydrophobic cavity within which is located part of the D subunit. The A0 domain is made of multiple copies of the membrane bound K subunits (proteolipids), which are arranged in a ring, an I subunit, which contains a C-terminal membrane bound- and a cytoplasmic N-terminal domain, and subunit C. The A1 and A0 domains are joined by a central stalk that is made of subunits D, F and C. The central stalk connects to the membrane bound ring of the K subunits via the C subunit, which binds in the cytoplasmic opening of the K subunit ring. F-, V- and (presumably) A-ATPases are rotary molecular motor enzymes5,6 (reviewed in7); sequential nucleotide binding and catalysis taking place on the water soluble domains (F1, V1 or A1) is coupled to ion translocation across the membrane bound domains (F0, V0 or A0) via rotation of the central stalk and proteolipid ring. Ion translocation takes place at the interface of the membrane bound domain of the I subunit and the ring of K subunits, which each have a lipid exposed carboxyl residue (Asp or Glu). As in the F- and V-ATPases, peripheral stators or stalks function to hold the rotary molecular motors together during turnover. While there is general agreement as to the subunit structure of the catalytic and rotor domains, the exact nature of the subunit composition and the number of the peripheral stalks in the A- and V-ATPases are matters of ongoing controversy. In the bacterial F-ATPase, a single peripheral stalk is found, which is composed of the membrane-anchored b subunits together with the δ subunit bound on the top of the F18. The situation is less clear in the A- and V-ATPases; electron microscopy studies have suggested the presence of multiple peripheral stators in the related enzymes9-11 and studies with individual polypeptides have lead to the proposal that dimeric species of subunits E12 and H13 (or G14) are structural elements of the A- (or V-) ATPase peripheral stalks. A role of the cytoplasmic domain of A-ATPase subunit I15 (or V-ATPase subunit a16) as peripheral stator has also been proposed.
In the current study, we have analyzed the putative stator domain from the A-type ATP synthase from Thermoplasma acidophilum, a thermoacidophilic member of the euryarchaeota. Secondary structure analysis of the T. acidophilum A-ATPase E and H subunits revealed that these two subunits are most likely the structural homologues to the V-ATPase E and G subunits. Circular dichroism, gel-permeation, MALDI-TOF and NMR measurements indicate that the individual E and H polypeptides have a tendency to form dimers and higher oligomers, while a complex containing each one copy of the subunits behaved as a monodisperse species in solution. Thermal denaturation analyses by circular dichroism and differential scanning calorimetry revealed the more co-operative unfolding transitions of the heterodimer in comparison to those of the individual polypeptides. The data are consistent with the hypothesis that the EH heterodimer is the structural unit that constitutes the peripheral stator(s) in the A-ATPase from T. acidophilum.
Results
Purification of the E & H Subunits and the EH Complex
Subunits E and H of the T. acidophilum A-ATPase were expressed as N-terminal fusions with E. coli maltose binding protein (MBP). Fusion proteins were isolated by amylose resin affinity chromatography, protease cleaved, and purified by size exclusion chromatography. The EH complex was prepared by reconstituting purified E and H subunits at a 1:1.1 molar ratio followed by gel filtration to remove excess of H subunit. Fig. 1 summarizes purification of the E and H subunits as well as the EH complex. As can be seen from the SDS-PAGE analysis (Fig. 1A), the individual subunits and the complex are all highly purified. Fig. 1B shows the elution profiles of the proteins from the size exclusion chromatography steps. Both individual subunits E and H eluted around 40-42 ml, corresponding to a relative molecular size of 75,000 – 65,000 (assuming globular proteins). Interestingly, the EH complex eluted later, at a volume of around 45 ml, corresponding to a size of around 60,000. The significantly lower than predicted elution volumes indicate that both individual subunits behave much larger than their predicted molecular weights. This behavior might be due to the formation of oligomeric aggregates or the presence of an unusually elongated shape, or a combination of both effects. From the fact that the EH complex elutes later than the individual subunits, the first possibility seems more likely (see also below).
Figure 1. Expression and Purification of T. acidophilum A-ATPase E & H subunits and the EH subunit complex.

(A) Purified recombinant proteins E and H and reconstituted EH complex. Proteins were expressed in E. coli as N-terminal maltose binding protein fusions. Following purification and cleavage from the fusion protein, subunits were used to reconstitute EH. Sample aliquots were analyzed via SDS-PAGE on a 12% acrylamide gel and visualized by Coomassie staining. (B) Overlay of E, H, and EH gel filtration profiles. Individual subunits were separated from MBP by passage over a 16×500 mm Superdex 75 gel filtration column. Following reconstitution, EH complex was passed over the gel filtration column in order to separate unbound subunits from the complex.
MALDI-TOF Mass Spectrometry
In order to confirm the purity, identity and oligomeric state of the individually expressed polypeptides, we performed mass spectrometry with the purified subunits and the subunit complex. The spectra for subunits H and E and the EH complex are shown in Fig. 2A, B and C, respectively. As can be seen, the most intense peaks match expected m/z values for singly charged species for the individual subunits, irrespective of whether individual subunits or the subunit complex were analyzed. The measured molecular weights are very close to the predicted values (measured 21,861 vs. predicted 21,886 for E and 13,698 vs. 13,688 for H, respectively), confirming the identity of the polypeptides. Furthermore, next to the monomer peaks of E and H, peaks for subunit dimers, trimers and higher oligomers (for H) can be observed, consistent with the size exclusion chromatography results (see above). The matrix chosen (ferulic acid) has been shown to allow detection of native protein-protein interactions using laser-induced desorption and ionization mass spectrometry17, indicating that at least some of the observed oligomeric species were already present in the aqueous solutions of the subunits used for sample preparation. MALDI-TOF of the EH complex resulted in a peak for the complex (observed mass 35,558, expected mass 35,555) next to peaks for the individual subunits and low abundance oligomeric adducts. Dissociation of some of the complex into individual subunits is not surprising, given the high energy input during the laser irradiation for sample desorption and ionization.
Figure 2. MALDI-TOF Mass Spectrometry of E & H subunits.
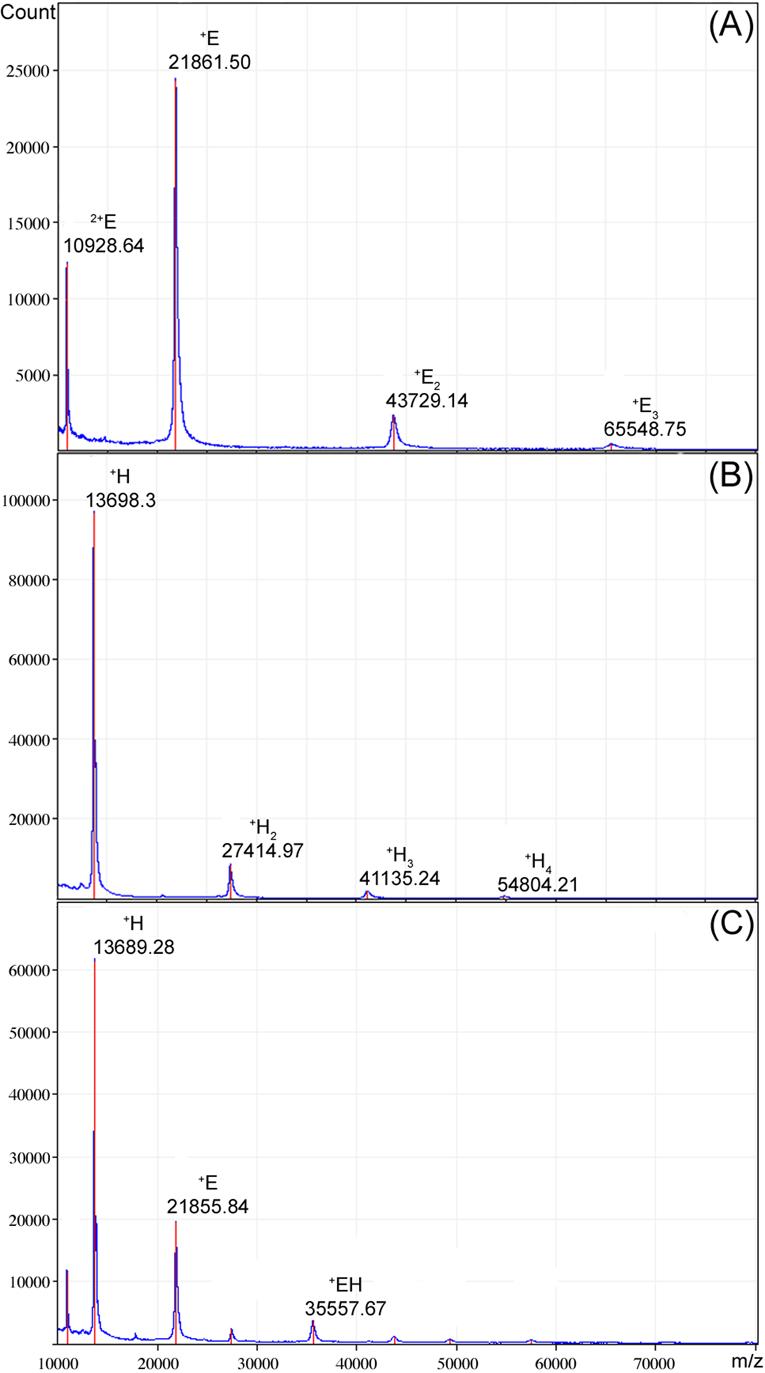
Mass spectra of (A) E and (B) H subunits and (C) subunit EH complex. Proteins were spotted onto the probe 1:1 with ferulic acid saturated in 30:70 ACN/TFA (0.1%). 450 shots were summed for each spectrum using a m/z range of 10,000 to 80,000.
Analytical Ultracentrifugation
To analyze the shape and molecular weight of the individual subunits and the EH complex in solution, proteins were subjected to analytical ultracentrifugation experiments. Both sedimentation velocity and equilibrium centrifugation runs were performed. Initial sedimentation velocity runs of the individual E and H subunits gave poorly defined boundaries, consistent with a polydisperse behavior of both subunits (data not shown); analytical ultracentrifugation with the individual subunits was therefore not further pursued. Ultracentrifugation of the EH subunit complex, on the other hand, showed a very different behavior. Fig. 3A shows the results of a representative sedimentation velocity experiment conducted with a protein concentration of 0.9 mg/ml and a temperature of 20 °C. The well-defined boundary and the flat plateau regions indicate that the sample is monodisperse, lacking higher aggregates. Fitting of the data to the modified Fujita-MacCosham function using the program SVEDBERG (see Experimental Procedures) revealed the single species to have a s20,w of 2.14 S. A virtually identical result (s20,w =2.15 S) was obtained from another of the cells in this run, loaded with the EH heterodimer at a concentration of 1.7 mg/ml, indicating the lack of significant concentration-dependent aggregation. Given the expected mass of the complex (35,555 Da), the frictional ratio was calculated to be 1.71, indicating an extended structure. Analysis of sedimentation velocity runs carried out at 40 °C led to similar but slightly lower s20,w values of 2.07 S and 2.08 S at the lower and higher concentrations, respectively, indicating that any structural changes over this temperature range were minor.
Figure 3. Analytical Ultracentrifugation of EH subunit complex.
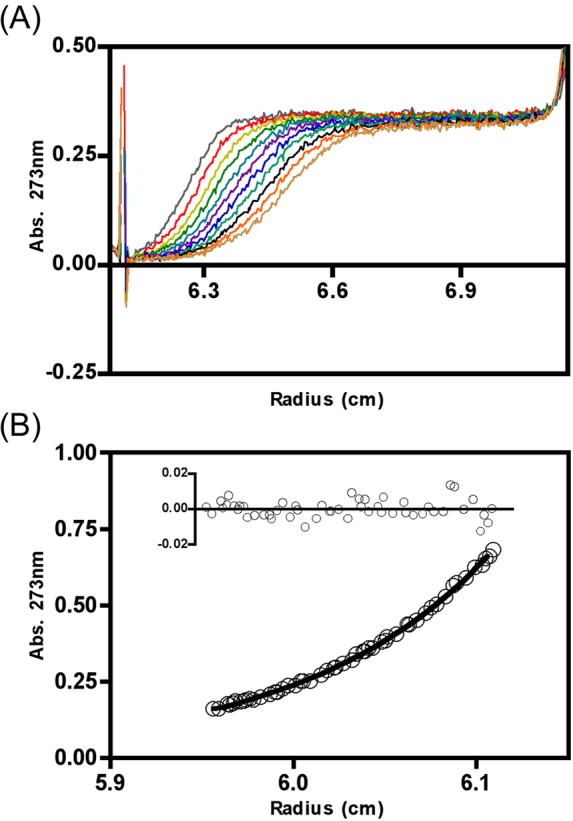
(A) Overlay of scans from a sedimentation velocity experiment with 0.9 mg/ml EH heterodimer in 25 mM sodium phosphate at pH 7, 100 mM NaCl, 1 mM EDTA, and 0.02% NaN3 at 20 °C with a rotor speed of 50,000 rpm. The strong positive deflection at 6.16 cm comes from the sample channel meniscus. Scans were collected at 10-min intervals. (B) Representative data from a sedimentation equilibrium experiment with 0.9 mg/ml EH under the same buffering and temperature conditions as (A) with a rotor speed of 20,000 rpm. Data were fitted as an ideal single species and the residuals from this fit are shown above the curve.
Sedimentation equilibrium analyses were conducted in triplicate at rotor speeds of 20,000 and 25,000 rpm at 20 °C, and at 40 °C after equilibration at 25,000 rpm. Fig. 3B shows a sample data set collected at 20,000 rpm; analysis of these data gave a good fit for a single species of molecular weight 34,680 with a standard error of 500. The randomness of the residuals (inset) indicates the appropriateness of the single species model. Analysis of the triplicate data sets under three conditions gave average values (± standard deviations) as follows: 20 °C at 20,000 rpm, 34,200±380; 20 °C at 25,000 rpm, 33,870±560; and 40 °C at 25,000 rpm, 32,840±520. The slight decrease in average molecular weight at 40 °C could indicate a slight reduction in affinity between subunits at that temperature, but it should be remembered that high-speed sedimentation tends to exaggerate the influence of trace low molecular weight species, and the magnitude of the change is borderline in significance. Overall, the sedimentation data indicate that the EH complex behaves as an extended, non-aggregating high-affinity heterodimer.
Secondary Structure Analysis by CD Spectroscopy
The secondary structure content of the stalk subunits was estimated by CD spectroscopy experiments. The results are shown in Fig. 4A. As can be seen, spectra of both individual E and H subunits as well as the EH subunit complex show an evidence of α-helical structure based on the distinct minima at 222 and 208 nm. However, the magnitude of the molar ellipticity of the EH complex at the two minima around 221 and 209 nm (∼25,052 and −25,681 degrees · cm2 · dmol−1, respectively) is significantly greater compared to the individual subunits (∼−14,000 and −12,500 for E and H, respectively), indicating that EH complex formation leads to a dramatic increase in α-helical secondary structure and/or its stabilization. Using the program K2d (see Experimental Procedures), the amount of α helix, β strand and random coil was estimated to be 37%, 15% and 48% for E, 27%, 15% and 58% for H and 81%, 0% and 19% for the EH complex. Interestingly, the EH complex showed a ratio of the magnitudes of the CD minima near 222 and 208 nm (θ222/θ208) of 0.99, indicative of the presence of coiled coil secondary structure18. In the isolated E- and H subunits, the θ222/θ208 ratios are 0.92 and 0.86, respectively. The significantly lower θ222/θ208 ratios for the isolated subunits suggest that individual subunit oligomerization probably does not involve formation of stable α helical coiled-coil secondary structure.
Figure 4. Circular Dichroism Spectroscopy and Differential Scanning Calorimetry of E & H subunits.

(A) CD spectra of E, H, and reconstituted EH complex in 10 mM sodium phosphate, pH 7, 25 °C. (B) CD signal measured at 222nm as a function of increasing temperature (T-melt). For H, no cooperative loss of CD signal was observed, while E exhibited a cooperative transition around 25 °C (explored further in Figure 6). The melting curve of EH features two gradual transitions that were further studied by DSC due to the relatively high temperatures necessary to carry out the melt. (C) A comparison of the changes in heat capacity as a function of temperature for E, H and reconstituted EH. Thermograms were generated for each sample at a scan rate of 60 °C/hour from 10 °C to 115 °C, and buffer-buffer reference scans subtracted. The large exothermic signal acquired for E (red line) was due to sample aggregation/precipitation above 70 °C, and no significant changes in heat capacity could be seen for H (blue line). In contrast, large, endothermic peaks can be seen for the EH complex (green) above 60 °C. After baseline subtraction (D), data were best fit to a non-two-state model with three transitions (black, dotted lines).
Thermal Stability of the Individual Subunits and the EH Complex
To estimate the thermal stability of the T. acidophilum A-ATPase stalk subunits, the CD signal at 222 nm was recorded as a function of temperature. Fig. 4B shows thermal denaturation curves for the individual subunits and the heterodimeric complex. Subunit H showed a monotonic decrease in CD signal with increasing temperature. The absence of any cooperative melting behavior is consistent with some portions of subunit H forming solvent-exposed α helices. Thermal unfolding of subunit E showed a weak cooperative transition around 25 °C followed by a monotonic decrease in CD signal up to 70 °C. The melting behavior of the EH subunit complex was more complicated in that it seemed to involve more than one cooperative transition. Thermal denaturation of the individual subunits and the subunit complex was therefore analyzed in more detail by differential scanning calorimetry (Fig. 4C&D). Fig. 4C shows the change in specific heat capacity for the individual subunits and the EH complex as a function of temperature. Again, for subunit H, no distinct transition can be observed, consistent with the lack of any cooperativity during thermal unfolding of the subunit. Subunit E shows virtually no change in specific heat capacity up to 75 °C, followed by a strong exothermic transition that would imply aggregation/precipitation of the subunit around this temperature. Samples recovered at the end of the experiment confirmed that precipitation had occurred. The temperature-dependent change in specific heat capacity for the EH complex, on the other hand, was positive throughout the entire temperature range with multiple transitions above 60 °C. Fig. 4D shows fitting of the temperature dependence of the excess specific heat capacity for the EH complex after baseline subtraction. As can be seen, the best fit to the data indicates three transitions occurring at around 63, 83 and 92 °C, respectively. Nevertheless, the data indicate that the EH complex is relatively stable up to ∼60 °C, which is the temperature where Thermoplasma acidophilum shows optimum growth behavior19.
Binding Affinity of the E and H Subunits by Isothermal Titration Calorimetry (ITC)
In order to estimate the affinity of the two polypeptides, isothermal titration calorimetry experiments were performed. The results of a representative experiment are shown in Fig. 5. In the experiment, subunit H at a concentration of 125 μM was injected 29 times in 6 μl aliquots into 1.4 ml of subunit E at a concentration of 10.6 μM, with one pre-injection of 3 μl (Fig. 5A). The amounts of heat release for the titration were fitted to a model with one set of binding sites, resulting in a dissociation constant of 40 +/− 20 nM, a value close to the technical limit of the instrument (Fig. 5B). The value for the stoichiometry from the fit was given as approximately 0.85:1 (H:E). A possible explanation for the deviation from the expected 1:1 ratio might be due to the observation that the individual E and H subunits exist as oligomeric species (see above), and therefore, some of the heat generated during binding will be consumed to break up the subunit E and H oligomers. Indeed, when injecting subunit H into buffer alone, a significant positive heat change was observed (Fig. 5A, inset). That also means that the fitted association constant is probably underestimated and that the true affinity between E and H subunits is even greater. Trying to determine the EH affinity by diluting small amounts of pre-formed EH complex into the calorimeter cell did not result in a measurable heat absorption, again consistent with the high affinity of the subunit interaction (data not shown).
Figure 5. Isothermal Titration Calorimetry of subunit E and H.

Isothermal titration calorimetry measurements for the binding interaction of subunit H with subunit E at 40 °C in 10 mM sodium phosphate buffer, pH 7. (A) Raw data for 29 6-μl injections of 125 μM H into a cell containing 10.6 μM E, with a pre-injection of 3-μl. (a) Raw data from the dilution of H into buffer alone. (B) Areas under the raw data peaks were integrated and plotted versus [H]/[E]. The solid-line represents the best fit of the data to a one set of sites model as analyzed in Origin 7.0. The fit estimates the stoichiometry of H:E of 0.85:1, a Kd of 40 +/− 20 nM, a binding enthalpy (ΔH) of −96 +/− 1 kJ/mol and a change in entropy (ΔS) of −268 J/K.
Solution NMR Spectroscopy of Subunit E
As shown in Fig. 4B, subunit E undergoes a cooperative melting transition at around 25 °C. To determine whether this transition might be accompanied by a dissociation of the subunit E oligomers, 15N-HSQC spectra of uniformly labeled subunit E were recorded below (10 °C), at (25 °C) and above (37 °C) the transition temperature. NMR spectra were recorded and processed under identical conditions. As can be seen in Fig. 6, there is virtually no signal in the spectrum recorded at 10 °C (Fig. 6A), consistent with subunit E existing as high molecular weight oligomers. Here, the lack of signal might be due to intermediate chemical exchange and/or slow tumbling of the subunit E oligomers. At 37 °C (Fig. 6B) on the other hand, subunit E produced a 15N-HSQC spectrum typical for a protein containing solvent exposed α helix (poorly resolved peaks in the center around 8 ppm) and some β sheet (peaks downfield of 9 ppm). An intermediate situation is found in the spectrum recorded around the transition temperature of 25 °C (Fig. 6C). Overall, these data are consistent with subunit E forming more stable secondary structure at low temperature by interacting with itself to produce dimers and/or higher oligomers. At temperatures above 25 °C, some of these oligomeric species will dissociate to produce monomeric subunit E, which is tumbling at a fast enough rate to produce observable peaks in the HSQC NMR spectra. At the same time, however, some of the α helical secondary structure present at 10 °C is probably destabilized, leading to the poorly resolved NMR signals in the center of the spectrum.
Figure 6. 2-D 15N-HSQC NMR Spectroscopy of the A-ATPase E subunit.

1H/15N-HSQC NMR spectra of 0.6 mM E subunit in 25 mM sodium phosphate buffer, pH 7, 0.5 mM EDTA, and 0.02% NaN3 at (A) 10 °C, (B) 25 °C, and (C) 37 °C. These temperatures lie below, within, and above the transition observed for E during the T-melt observed by CD (Fig. 4B). The signal increase with increasing temperature signifies a faster molecular tumbling rate, suggestive of a reduced oligomeric state.
Discussion
In the present study, we have characterized the peripheral stalk subunits E and H of the A-ATPase form Thermoplasma acidophilum, a moderately thermophilic acidophilic Archaeon growing optimally at 59°C and a pH of 219. Gel filtration, analytical ultracentrifugation, mass spectrometry and NMR spectroscopy experiments all indicate that the individual subunits in absence of their binding partner tend to interact with themselves to form dimers and higher oligomers. Furthermore, we provide evidence that when the two subunits are allowed to interact with equimolar stoichiometry, they form a stable, heterodimeric subunit EH complex with a Kd in the nanomolar range. The resulting subunit EH complex, as shown by analytical ultracentrifugation experiments, presented itself as a well-behaved, monodisperse species under the conditions tested. In addition, CD spectroscopy experiments showed that upon complex formation, there was a dramatic increase in α helical secondary structure, most likely due to α helical coiled coil formation between the two subunits as indicated by the increased ratio of θ222/θ208. While the estimated α helix content in the isolated subunits was significantly lower than expected based on secondary structure prediction (see Figure 7A), for the EH heterodimer it was 81%, very close to the predicted value of 78%. The relatively low degree of α helicity estimated for the isolated subunits (especially H) is expected, given the generally accepted model for formation of coiled coils, which involves two largely unfolded monomers coming together to form a folded (hetero)dimer20,21. Additional evidence that the resulting EH heterodimer is the physiologically relevant species comes from thermal denaturation experiments, which show that the EH complex exhibits cooperative unfolding behavior, a hallmark of native protein structure. On the other hand, the cooperative loss of CD signal observed for the isolated E subunit probably does not indicate the unfolding of a native structure as it occurs at a temperature of ∼25 °C, which is significantly below the optimum growth temperature for T. acidophilum (59 °C)19. Instead, the NMR data shown in Fig. 6 suggest that this transition is the result of the reduction of oligomeric species. Taken together, the data strongly suggest that it is the heterodimer of subunits E and H that functions as a structural element in the intact A-ATP synthase complex.
Figure 7. Building the Stator of the A- and V-ATPase.

(A) Secondary structure analysis of the peripheral stalk forming subunits of the A-, V- and F-ATPase. Secondary structure prediction was carried out using the PsiPred server (bioinf.cs.ucl.ac.uk/psipred). Vma4p and Vma10p, E and G subunits of the yeast vacuolar ATPase. Bov_E and Bov_G1, E subunit and G1 subunit isoform of the bovine clathrin coated vesicle vacuolar ATPase. Ec_δ and Ec_b, δ and b subunits of the E. coli F1F0-ATP synthase. The structure of the E. coli F-ATPase δ subunit N-terminal domain (residues 1-106; indicated in cyan) has been determined by NMR spectroscopy27. (B,C) Structural models of the (B) bacterial F- and the (C) archaeal A-ATPase. Subscripts N and C next to the subunit name (EN, EC) stand for N- and C-terminal domain, respectively. For reasons of simplicity, the coiled-coil nature of the interaction between subunit H and the N-terminal domain of subunit E (EN) has been omitted from the model. The collar observed in EM images of the intact A-ATPase11 is formed in our model by the hydrophilic domain of subunit I plus contributions from the N-terminal domains of the EH heterodimer that interact with the I subunit hydrophilic domain. For details, see text.
What might be the function of this heterodimer in the A-ATPase? From earlier studies, it had been suggested that homodimers of subunit E12, H13 and the related G subunit of the V-ATPase14 are key structural elements of the A- and V-ATPase peripheral stalks, but these conclusions were all based on experimental data obtained for isolated, individual subunits. For example, isolated subunit H from M. jannaschii A-ATPase was shown to exist as a dimer in solution, a structural model of which was determined by small angle X-ray scattering13. The low resolution model showed an elongated, elbow like structure and it was speculated in that study that one of the peripheral stalks is constituted by the subunit H dimer alone. In the case of subunit E, dimer formation has been observed in a crystal structure obtained for the C-terminal domain of the subunit from the Pyrococcus horikoshii A-ATPase12. The structure contains residues 81-198 and is composed of four β strands and six α helices, consistent with the secondary structure prediction shown in Fig. 7A. The dimer interface is generated via domain swapping in that the C-terminal α helix of one monomer interacts with the N-terminal α helix of the other monomer and vice versa.
However, the evidence provided here, namely that E and H form a stable complex with high affinity, casts doubt on the physiological significance of the homodimers. Dimerization of E subunit C-terminal domain may result from the missing N-terminal domain, as the results from the current study indicate that the dimerization seen in the crystal structure does not occur in the intact EH subunit complex in solution under the conditions tested. Similarly, while we have observed dimer (and higher oligomer) formation for isolated subunit H, addition of subunit E is able to break up this interaction of subunit H with itself, indicating preferential formation of the EH heterodimer.
Of course, for the EH complex to be able to function as peripheral stalk in the A-ATPase, its structure would have to be highly elongated, reaching from the bottom to the of the A1 to the very top of the complex, a distance of more than 100 Å11. The biophysical characterization of the EH complex provided here is consistent with this structural requirement. First, the complex is highly α helical, including a region of coiled coil (see above). Secondly, the complex elutes at a much higher than expected molecular weight on gel filtration, and thirdly, a frictional ratio of 1.71 was obtained from analytical ultracentrifugation experiments. All these observations are consistent with an elongated shape for the subunit EH complex.
Further evidence that the EH complex plays the role of peripheral stalk in the A-ATPase comes from a comparison of the E and H subunit sequences to those of stator forming subunits of the related F- and V-ATPase. While there is significant amino acid sequence homology between F-, A- and V-ATPase for the catalytic subunits and the proteolipids4, the rotor- and stator forming subunits of the related ATPases show little sequence conservation. The situation becomes clearer, however, when conducting the comparison on the level of (predicted) secondary structure. Fig. 7A shows a schematic comparison of the secondary structure prediction of subunits E and H of the A-ATPase with those of subunits E and G of V-ATPase and δ and b of bacterial F-ATPase.
In the bacterial F-ATPase, it is now well established that the peripheral stalk is formed by the δ and b subunits8. In the E. coli enzyme, the peripheral stalk is anchored to the membrane via the N-terminal transmembrane α helices of the b subunits. The C-terminal domain of one of the b subunits interacts with the C-terminal domain of the δ subunit22, while the N-terminal domain of the δ subunit is bound to the F1 via the N-terminus of one of the three α subunits23. There is evidence that the two b subunits dimerize by forming a right-handed coiled coil for much of their length24. In the V-ATPase, which is structurally more similar to the A-ATPase than to the F-ATPase, the number- and nature of the peripheral stalk(s) is still not fully understood but there is evidence from chemical cross linking that the stator is formed by subunits E and G25,26, that subunits E and G interact to form an elongated, stable heterodimer27,28 and that there are at least two copies of the EG heterodimer in the V1-ATPase complex from yeast28.
The situation in the A-ATPase is probably similar to that in the V-ATPase except that the number of EH heterodimers has yet to be addressed in a rigorous manner, even though electron microscopy had suggested the presence of at least two peripheral stalks9. While the secondary structure analysis shown in Fig. 7A points to a structural relationship between subunits b, G and H of the F-, V- and A-ATPase, the comparison of subunits δ and E reveals a clear difference between the F-ATPase stator subunit on one hand and the related V- and A-ATPase subunits on the other. The situation can be clarified, however, when looking at the structure of the δ subunit. It consists of a compact, N-terminal 6-helix bundle (residues 1-106 in E. coli29; indicated by the * in Fig. 7A) and a C-terminal domain, for which there is no structure available yet. The N-terminal domain of δ has been shown to occupy the dimple formed by the N-terminal domains of the α- and β subunits of the F1-ATPase23, while the C-terminal domain of δ has been shown to interact with the C-terminal domain of the b subunits22. This is illustrated in Fig. 7B. Interestingly, even though there is poor conservation on the level of the primary sequences between the peripheral stalk subunits of the A-, V- and F-ATPase, secondary structure analysis reveals the similarity of the structural elements of the stators in the members of the three ion translocating ATPase families.
Our current working model of the stator composition of the A-ATPase is the following (illustrated in Fig. 7C): each stator in the A-ATPase is formed by a heterodimer of the E and H subunits. The two subunits interact by forming a coiled coil (as evident from CD analysis; see Fig. 4A) involving the α helical N-terminal domain of the E subunit (EN) and an as of yet unspecified region in the H subunit. Evidence supporting the existence of an unusual right-handed coiled coil structure in the b dimer of eubacterial ATP synthase has been presented24. While our studies indicate formation of a heterodimeric coiled coil by the E and H subunits, we have no evidence that would allow us to position the region of the coiled coil or to distinguish between left-handed and right-handed models. The C-terminal domain of the E subunit on the other hand is responsible for interaction with the ATPase domain.
What might have lead to this domain interchange within the stator forming subunits between F- and A/V-ATPase? A possible answer to that question might be found when looking at the number of peripheral stalks present in the two ATPase families. The single N-terminal domain of F-ATPase δ subunit occupies the top of the F1 and therefore leaves room for only one stator. For a reason yet unknown, multiple stators are found in A- and V-ATPase. Consequently, when going from F- to A/V-ATPase, the N-terminal domain of F-ATPase δ had to be eliminated in order to accommodate multiple stalks. At the same time, the interaction between the stator and the ATPase domain had to be moved from the δ subunit N-terminal domain to the E subunit C-terminal domain. The nature of the interaction between peripheral stalk and catalytic domain in the A- and V-ATPase is not known at this point, but might be similar to what is seen in the bacterial flagellar motor and type III secretion systems30,31. For example, in the bacterial flagellum, a protein with weak homology to subunit E has been found named FliH and it has been shown that this protein can bind via its C-terminal domain to FliI, a flagellar component with homology to the F-ATPase catalytic β subunit31. On the other hand, a close proximity of subunits A and H near the top of the A1 domain has been observed based on chemical cross-linking experiments32, suggesting that subunit H might also play a role in the interaction between peripheral stator and catalytic domain. Experiments to identify the interaction of peripheral stator and ATPase domain in the A-ATPase from T. acidophilum are ongoing in our laboratories.
Experimental Procedures
Materials
The cDNA for ORFs Ta_0001 and Ta_0007a (subunits E and H of the A-ATPase from Thermoplasma acidophilum) was kindly provided by Drs. Dennis Revis and Robert Richards, California Lutheran University, Thousand Oaks, CA. The QuikChange kit was from Stratagene. Inc.. 15N ammonium chloride was from Spectra Stable Isotopes. PrecissionProtease was from GE Healthcare. Plasmid pMAL-C2E (New England Biolabs) containing a PrecissionProtease sequence downstream of the C-terminus of maltose binding protein (MBP) was a kind gift from Dr. Gino Cingolani, SUNY Upstate Medical University). All other reagents were of analytical grade.
Protein Expression and –Purification
The open reading frames for the E- and H subunits were PCR amplified using primer pairs GCTCAGGTACCGTCCCTCGAAGAAGTGCTGAAG, CGAGTCAAGCTTTCAATCCTCTATCATTGAATAAAGC and GCTCAGGTACCGGAGCTGATGCGTATGGATGATG, CGAGTCAAGCTTTTACTCCTCTAGATACTTCATTATTA for Ta_E and Ta_H, respectively. 5'-KpnI and 3'-HindIII sites (underlined) were used for insertion into the modified pMal-c2e plasmid. Removal of the MBP fusion from the target protein resulted in a five amino acid N-terminal linker (GPKVP) on the target protein. All biophysical characterization experiments presented here were conducted with E subunit in which the endogenous cysteine at position 60 was changed to alanine via the PCR based QuikChange protocol. Earlier experiments, which were conducted with wild type E subunit indicated essentially identical characteristics except that after prolonged storage, the cysteine containing subunit had the tendency to precipitate due to intermolecular disulfide bond formation. In the following text, E subunit therefore stands for E_C64A. All PCR and site directed mutagenesis was verified by DNA sequencing. Plasmid DNA was introduced into Rosetta pLacI E. coli cells (Novagen) containing the pRare plasmid. A 10 ml overnight culture was used to inoculate one liter of RB medium supplemented with 100 μg/ml ampicillin and 34 μ/ml chloramphenicol to maintain the expression and pRare plasmids, respectively. Cells were grown at 37 °C in RB containing 100 μg/ml ampicillin and 34 μg/ml chloramphenicol to an OD600 of ∼0.8 at which time expression was induced by addition of IPTG to a final concentration of 0.5 mM. After ∼4 hrs at 37 °C, cells were harvested by centrifugation, resuspended in 20 ml of column buffer (CB; 20 mM Tris-HCl, pH 7.4, 200 mM NaCl, 1 mM EDTA) and stored at −20 °C until further use. Cells were incubated with lysozyme and cell lysis was accomplished by sonication in presence of DNAase I and 1 mM PMSF. Cell debris was removed by centrifugation at ∼15,000g for 30' at 4 °C after which time the supernatant was diluted five-fold with CB and passed over a 15ml amylose column (NEB) at ∼1 ml/min. The column was washed with 12 CV of CB at ∼3 ml/min and the fusion protein was eluted with CB + 10 mM maltose in ten 3 ml fractions at ∼1 ml/min. Fusion protein containing fractions were pooled and incubated with PrecissionProtease overnight at 4 °C according to the manufacturers instructions. Most of the MBP was removed by ammonium sulphate precipitation (40-60% cut for E and 55% for H) and the re-dissolved proteins were further purified by size exclusion chromatography (Superdex 75; GE Healthcare; 16/50 column) in 25 mM sodium phosphate, pH 7, 1 mM EDTA, 0.02% sodium azide. Fractions were analyzed by SDS-PAGE and E and H subunit containing fractions were pooled and concentrated or dialyzed against the appropriate buffer. Isotope (15N) labeled E subunit was produced in an analogous fashion, except that bacterial cultures were grown in M9 minimal media containing 15N-ammonium chloride as sole nitrogen source. Complex formation was carried out by combining purified E subunit with a ∼10% excess of subunit H. The mixture was incubated on ice for 20', concentrated by ultra filtration (10k MWCO; VivaSpin) and excess H subunit was removed by gel filtration using Superdex 75 as described above. The gel filtration column was calibrated using blue dextran (MW ∼2 · 106), BSA (67,000), MBP (44,000), chymotrypsin (25,000) and aprotinin (6,500). Initially, EH complex was also prepared by co-expression of subunit H and E (subunit E was expressed with a N-terminal histidine tag) from a bicistronic plasmid. However, the purity of the complex prepared this way was not as good compared to the above-described method (data not shown).
Circular Dichroism Spectroscopy
Concentrated proteins were exchanged into 25 mM sodium phosphate, pH 7, by Sephadex G25 centrifuge columns. CD spectra were recorded on an Aviv 202 spectrometer with a 0.2 cm or 0.1cm path length cuvette. Scans were recorded from 250 to 195 nm with a step size of 1 nm at 25 °C. Buffer scans were subtracted from the raw data, which were then converted to molar ellipticity using concentration values determined from the absorbance at 277 nm of GdHCl denatured samples33. The values were 0.30 mg/ml, 0.36 mg/ml, and 0.37 mg/ml for subunits E, H, and EH complex, respectively. Temperature melts of the proteins were observed at 222 nm over the temperature range of 10 to 70 °C (90 °C for the EH complex) using a 1 °C step size and a rate of temperature change of 5 °C/min. CD data from 240 to 200 nm were used to estimate the secondary structure composition with the program K2d (http://www.embl.de/~andrade/k2d.html)34. Secondary structure prediction was carried out using the PsiPred server (bioinf.cs.ucl.ac.uk/psipred).
Mass Spectrometry
Purified subunits and subunit complex, each diluted to concentrations of ∼5, 10, and 50 μM, were spotted onto a Bruker 384 target with an equal amount of saturated ferulic acid in 30:70 acetonitrile/TFA (0.1%)17. Spectra were collected on an Autoflex TOF (Bruker) spectrometer using a m/z range of 10,000 to 80,000. 450 spectra were summed for each protein and the program Mmass (http://mmass.biographics.cz/) was used for data analysis.
Analytical Ultracentrifugation
Sedimentation velocity and equilibrium experiments were conducted on a Beckman Optima XL-A Analytical Ultracentrifuge (Biomolecular Interactions and Conformations Facility, University of Western Ontario). Two-channel and six-channel cells, with Epon-charcoal centerpieces, were used for the velocity and equilibrium runs, respectively, in an An60Ti rotor. Samples were dialyzed against 25 mM sodium phosphate, pH 7, 100 mM NaCl, 1 mM EDTA, 0.02% sodium azide buffer and diluted to the desired concentration. Dialysis buffers were saved for use in the reference channels. Sedimentation equilibrium and velocity experiments were carried out at 20 °C and at 40 °C. The buffer density and partial specific volumes of the target proteins were calculated as described in ref. (36). For sedimentation velocity, absorbance was monitored at 273 nm, the peak Y absorbance, at rotor speeds of 50,000 rpm (20 °C) and 32,000 rpm (40 °C). Scans were collected at 10-min intervals in 0.003-cm radial steps, averaged over three replicates. Data were fitted to the modified FujitaMacCosham function using the SVEDBERG program35. For sedimentation equilibrium, the initial protein concentration was 0.9 mg/ml. Absorbance was monitored at 273 nm and data were collected in 0.002-cm radial steps, averaged over 10 replicates. Data were collected at 20 °C after equilibration at rotor speeds of 20,000 and 25,000 rpm, then the temperature was increased to 40 °C and data were collected after equilibration at 25,000 rpm. Data were analyzed using a single ideal species model that was built into Prism 4 (Graphpad) as described previously36.
Isothermal Titration and Differential Scanning Calorimetry
DSC- and ITC analysis was carried out on VP-DSC and VP-ITC instruments (MicroCal). For DSC, reconstituted EH complex was prepared as described for the AUC experiments. DSC thermograms were generated for samples of the EH complex as well as individual E and H subunits at concentrations of 48 μM, 33 μM and 65 μM, respectively, over a range of 10 to 115 °C, at a rate of 60 °C/hour. Raw data were processed by non-linear least squares regression analysis in Origin 5.0 (MicroCal), by first subtracting a buffer-buffer reference scan and then fitting to a non-two-state transition model. For isothermal titration, E and H subunits were dialyzed against 10 mM sodium phosphate buffer, pH 7. Protein concentrations were determined by measuring the absorbance at 277 nm in 6 M Gd·HCl. Subunit H at a concentration of 125 μM was injected in one 3-μl and 29 6-μl aliquots into a 1.4 ml cell containing subunit E (10.6 μM). A subunit H only injection experiment was subtracted from the final data used for fitting. ITC data were analyzed in Origin 7.0 (MicroCal).
NMR Spectroscopy
Uniformly 15N labeled E subunit was concentrated in 25mM sodium phosphate buffer, pH7, 1 mM EDTA, 0.02% sodium azide and D2O was added to a final concentration of 7%. 15N-HSQC spectra were recorded at 10 °C, 25 °C, and 37 °C on a Bruker Avance 600 MHz spectrometer equipped with a HCN triple axis gradient probe. NMR data were processed with Felix2004. Proton resonances were referenced to DSS and the 15N zero point frequency was calculated as described37.
Acknowledgements
Dave Kiemle (SUNY College of Environmental Science and Forestry, Syracuse, NY) is gratefully acknowledged for help with the NMR spectroscopy. The Mass Spectrometry and Proteomics Centre (MaSPeC) at SUNY Oswego, Oswego, NY) is acknowledged for assistance with the mass spectrometry experiments. Dr. Stewart Loh is acknowledged for assistance with the CD spectroscopy. We thank Drs. Robert Richards and Dennis Revie (California Lutheran University, Thousand Oaks, CA) for providing the cloned cDNA for the T. acidophilum A-ATPase E and H subunits. This work was supported by NIH grants GM58600 and CA100246 to S.W and Canadian Institutes of Health Research grant MT-10237 to S.D.D.
Abbreviations used
- A1A0
archaeal ATP synthase
- A1
water soluble domain of the archaeal ATP synthase
- A0
membrane bound domain of the archaeal ATP synthase
- F1
water soluble domain of the F1F0 ATP synthase
- F0
membrane bound domain of the F1F0, ATP synthase
- V1V0
proton pumping vacuolar ATPase
- V1
water soluble domain of the vacuolar proton pumping ATPase
- V0
membrane bound domain of the proton pumping vacuolar ATPase
- CD
circular dichroism
- AUC
analytical ultracentrifugation
- DSC
differential scanning calorimetry
- ITC
isothermal titration calorimetry
- NMR
nuclear magnetic resonance spectroscopy
- HSQC
hetero nuclear single quantum coherence
- MALDI-TOF MS
matrix assisted laser desorption ionization time-of-flight mass spectrometry
- MBP
maltose binding protein
Footnotes
Publisher's Disclaimer: This is a PDF file of an unedited manuscript that has been accepted for publication. As a service to our customers we are providing this early version of the manuscript. The manuscript will undergo copyediting, typesetting, and review of the resulting proof before it is published in its final citable form. Please note that during the production process errors may be discovered which could affect the content, and all legal disclaimers that apply to the journal pertain.
In the V-ATPase, subunit H of the A1 is called G and subunits C, I and K of the A0 are called d, a and c, respectively. The V-ATPase subunits C and H have no homologs in the A-ATPase.
References
- 1.Müller V, Grüber G. ATP synthases: structure, function and evolution of unique energy converters. Cell. Mol. Life. Sci. 2003;60:474–94. doi: 10.1007/s000180300040. [DOI] [PMC free article] [PubMed] [Google Scholar]
- 2.Nishi T, Forgac M. The vacuolar (H+)-ATPases — Nature's most versatile proton pumps. Nat. Rev. Mol. Cell. Biol. 2002;3:94–103. doi: 10.1038/nrm729. [DOI] [PubMed] [Google Scholar]
- 3.Boyer PD. The ATP synthase–a splendid molecular machine. Ann. Rev. Biochem. 1997;66:717–49. doi: 10.1146/annurev.biochem.66.1.717. [DOI] [PubMed] [Google Scholar]
- 4.Hilario E, Gogarten JP. The Prokaryote-to-Eukaryote Transition Reflected in the Evolution of the V/F/A-ATPase Catalytic and Proteolipid Subunits. J. Mol. Evol. 1998;46:703–15. doi: 10.1007/pl00006351. [DOI] [PubMed] [Google Scholar]
- 5.Hirata T, Iwamotot-Kihara A, Sun-Wada G-H, Okajima T, Wada Y, Futai M. Subunit rotation of vacuolar-type proton pumping ATPase: relative rotation of the G as to the c subunit. J. Biol. Chem. 2003;277:23714–23719. doi: 10.1074/jbc.M302756200. [DOI] [PubMed] [Google Scholar]
- 6.Imamura H, Nakano M, Noji H, Muneyuki E, Ohkuma S, Yoshida M, Yokoyama K. Evidence for rotation of V-ATPase. Proc. Natl. Acad. Sci. USA. 2003;100:2313–2315. doi: 10.1073/pnas.0436796100. [DOI] [PMC free article] [PubMed] [Google Scholar]
- 7.Wilkens S. Rotary Molecular Motors. Adv. Protein Chem. 2005;71:345–382. doi: 10.1016/S0065-3233(04)71009-8. [DOI] [PubMed] [Google Scholar]
- 8.Dunn SD, McLachlin DT, Revington M. The second stalk of Escherichia coli ATP synthase. Biochim. Biophys. Acta. 2000;1458:356–63. doi: 10.1016/s0005-2728(00)00086-4. [DOI] [PubMed] [Google Scholar]
- 9.Boekema EJ, van Breemen JFL, Brisson A, Ubbink-Kok T, Konings WN, Lolkema JS. Connecting stalks in V-ATPase. Nature. 1999;401:37–38. doi: 10.1038/43369. [DOI] [PubMed] [Google Scholar]
- 10.Wilkens S, Vasilyeva E, Forgac M. Structure of the vacuolar ATPase by electron microscopy. J. Biol. Chem. 1999;274:31804–10. doi: 10.1074/jbc.274.45.31804. [DOI] [PubMed] [Google Scholar]
- 11.Coskun U, Chaban YL, Lingl A, Müller V, Keegstra W, Boekema EJ, Grüber G. Structure and subunit arrangement of the A-type ATP synthase complex from the archaeon Methanococcus jannaschii visualized by electron microscopy. J. Biol. Chem. 2004;279:38644–8. doi: 10.1074/jbc.M406196200. [DOI] [PubMed] [Google Scholar]
- 12.Lokanath NK, Matsuura Y, Kuroishi C, Takahashi N, Kunishima N. Dimeric core structure of modular stator subunit E of archaeal H+-ATPase. J. Mol. Biol. 2007;366:933–44. doi: 10.1016/j.jmb.2006.11.088. [DOI] [PubMed] [Google Scholar]
- 13.Biukovic G, Rössle M, Gayen S, Mu Y, Grüber G. Small-angle X-ray scattering reveals the solution structure of the peripheral stalk subunit H of the A1AO ATP synthase from Methanocaldococcus jannaschii and its binding to the catalytic A subunit. Biochemistry. 2007;46:2070–8. doi: 10.1021/bi062123n. [DOI] [PubMed] [Google Scholar]
- 14.Armbrüster A, Bailer SM, Koch MH, Godovac-Zimmermann J, Grüber G. Dimer formation of subunit G of the yeast V-ATPase. FEBS Lett. 2003;546:395–400. doi: 10.1016/s0014-5793(03)00643-4. [DOI] [PubMed] [Google Scholar]
- 15.Yokoyama K, Nagata K, Imamura H, Ohkuma S, Yoshida M, Tamakoshi M. Subunit arrangement in V-ATPase from Thermus thermophilus. J. Biol. Chem. 2003;278:42686–91. doi: 10.1074/jbc.M305853200. [DOI] [PubMed] [Google Scholar]
- 16.Landolt-Marticorena C, Williams KM, Correa J, Chen W, Manolson MF. Evidence that the NH2-terminus of Vph1p, an integral subunit of the V0 sector of the yeast V-ATPase, interacts directly with the Vma1p and Vma13p subunits of the V1 sector. J. Biol. Chem. 2000;275:15449–15457. doi: 10.1074/jbc.M000207200. [DOI] [PubMed] [Google Scholar]
- 17.Farmer TB, Caprioli RM. Determination of Protein-Protein Interactions by MALDI Mass Spectrometry. J. Mass Spectrom. 1998;33:697–704. doi: 10.1002/(SICI)1096-9888(199808)33:8<697::AID-JMS711>3.0.CO;2-H. [DOI] [PubMed] [Google Scholar]
- 18.Lau SY, Taneja AK, Hodges RS. Synthesis of a model protein of defined secondary and quaternary structure. Effect of chain length on the stabilization and formation of two-stranded α-helical coiled-coils. J. Biol. Chem. 1984;259:13253–61. [PubMed] [Google Scholar]
- 19.Darland G, Brock T, Samsonoff W, Conti S. A thermophilic acidophilic mycoplasma isolated from a coal refuse pile. Science. 1970;170:1416–18. doi: 10.1126/science.170.3965.1416. [DOI] [PubMed] [Google Scholar]
- 20.Dürr E, Jelesarov I, Bosshard HR. Extremely Fast Folding of a Very Stable Leucine Zipper with a Strengthened Hydrophobic Core and Lacking Electrostatic Interactions between Helices. Biochemistry. 1998;38:870–80. doi: 10.1021/bi981891e. [DOI] [PubMed] [Google Scholar]
- 21.Lumb KJ, Carr CM, Kim PS. Subdomain folding of the coiled coil leucine zipper from the bZIP transcriptional activator GCN4. Biochemistry. 1994;33:7361–7. doi: 10.1021/bi00189a042. [DOI] [PubMed] [Google Scholar]
- 22.McLachlin DT, Bestard JA, Dunn SD. The b and δ subunits of the Escherichia coli ATP synthase interact via residues in their C-terminal regions. J. Biol. Chem. 1998;273:15162–8. doi: 10.1074/jbc.273.24.15162. [DOI] [PubMed] [Google Scholar]
- 23.Wilkens S, Borchardt D, Weber J, Senior AE. Structural Characterization of the Interaction of the δ and α subunits of the Escherichia coli F1F0-ATPsynthase by NMR Spectroscopy. Biochemistry. 2005;44:11786–94. doi: 10.1021/bi0510678. [DOI] [PubMed] [Google Scholar]
- 24.Del Rizzo PA, Bi Y, Dunn SD. ATP synthase b subunit dimerization domain: a right-handed coiled coil with offset helices. J. Mol. Biol. 2006;364:735–46. doi: 10.1016/j.jmb.2006.09.028. [DOI] [PubMed] [Google Scholar]
- 25.Arata Y, Baleja JD, Forgac M. Localization of Subunits D, E, and G in the Yeast V-ATPase Complex Using Cysteine Mediated Cross-Linking to Subunit B. Biochemistry. 2002a;41:11301–7. doi: 10.1021/bi0262449. [DOI] [PubMed] [Google Scholar]
- 26.Arata Y, Baleja JD, Forgac M. Cysteine-directed cross-linking to subunit B suggests that subunit E forms part of the peripheral stalk of the vacuolar H+-ATPase. J. Biol. Chem. 2002b;277:3357–63. doi: 10.1074/jbc.M109967200. [DOI] [PubMed] [Google Scholar]
- 27.Fethiere J, Venzke D, Diepholz M, Seybert A, Geerlof A, Gentzel M, Wilm M, Böttcher B. Building the stator of the yeast vacuolar-ATPase: specific interaction between subunits E and G. J. Biol. Chem. 2004;279:40670–6. doi: 10.1074/jbc.M407086200. [DOI] [PubMed] [Google Scholar]
- 28.Ohira M, Smardon AM, Charsky CM, Liu J, Tarsio M, Kane PM. The E and G subunits of the yeast V-ATPase interact tightly and are both present at more than one copy per V1 complex. J. Biol. Chem. 2006;281:22752–60. doi: 10.1074/jbc.M601441200. [DOI] [PubMed] [Google Scholar]
- 29.Wilkens S, Dunn SD, Chandler J, Dahlquist FW, Capaldi RA. Solution structure of the N-terminal domain (residues 1-134) of the δ subunit of the Escherichia coli F1F0 ATPsynthase. Nature Struct. Biol. 1997;4:198–201. doi: 10.1038/nsb0397-198. [DOI] [PubMed] [Google Scholar]
- 30.Pallen MJ, Bailey CM, Bearson SA. Evolutionary links between FliH/YscL-like proteins from bacterial type III secretion systems and second-stalk components of the FoF1 and vacuolar ATPases. Protein Sci. 2006;15:935–41. doi: 10.1110/ps.051958806. [DOI] [PMC free article] [PubMed] [Google Scholar]
- 31.Lane MC, O'Toole PW, Moore SA. Molecular basis of the interaction between the flagellar export proteins FliI and FliH from Helicobacter pylori. J. Biol. Chem. 2006;281:508–17. doi: 10.1074/jbc.M507238200. [DOI] [PubMed] [Google Scholar]
- 32.Schäfer I, Rössle M, Biukovic G, Müller V, Grüber G. Structural and functional analysis of the coupling subunit F in solution and topological arrangement of the stalk domains of the methanogenic A1A0-ATP synthase. J. Bioenerg. Biomembr. 2006;38:83–92. doi: 10.1007/s10863-006-9015-4. [DOI] [PubMed] [Google Scholar]
- 33.Gill SC, von Hippel P. Calculation of protein extinction coefficients from amino acid sequence data. Anal. Biochem. 1989;182:319–326. doi: 10.1016/0003-2697(89)90602-7. [DOI] [PubMed] [Google Scholar]
- 34.Andrade MA, Chacón P, Merelo JJ, Morán F. Evaluation of secondary structure of proteins from UV circular dichroism using an unsupervised learning neural network. Prot. Eng. 1993;6:383–390. doi: 10.1093/protein/6.4.383. [DOI] [PubMed] [Google Scholar]
- 35.Philo J. An Improved Function for Fitting Sedimentation Velocity Data for Low-Molecular-Weight Solutes. Biophysical J. 1997;72:435–444. doi: 10.1016/S0006-3495(97)78684-3. [DOI] [PMC free article] [PubMed] [Google Scholar]
- 36.Briere LK, Dunn SD. The periplasmic domains of Escherichia coli HflKC oligomerize through right handed coiled-coil interactions. Biochemistry. 2006;45:8607–16. doi: 10.1021/bi0606997. [DOI] [PubMed] [Google Scholar]
- 37.Wishart DS, Bigam CG, Yao J, Abildgaard F, Dyson HJ, Oldfield E, Markley JL, Sykes BD. 1H, 13C and 15N chemical shift referencing in biomolecular NMR. J. Biomol. NMR. 1995;6:135–40. doi: 10.1007/BF00211777. [DOI] [PubMed] [Google Scholar]