

Abstract
Background
American Indians experience high rates of type 2 diabetes. The impact of low-intensity interventions on diabetes risk among young American Indian women is unknown.
Design
Randomized controlled trial
Setting/Participants
Community-based; participants were 200 young urban American Indian women who were block-randomized on fasting blood glucose (FBG) into intervention and control groups. Inclusion criteria included self-reported identity, aged 18–40 years, not pregnant, willingness to stay in urban area for 2 years, and not having type 2 diabetes. Measures were taken at baseline, 6, 12, and 18 months. Data were gathered 2002–2006 and analyzed 2006–2007.
Intervention
Five discussion group sessions (one meeting per month for five months) were held focusing on healthful eating, physical activity, goal-setting, and social support..
Main Outcome Measures
Primary outcomes included dietary fat and vegetable consumption and self-reported physical activity. Secondary outcomes included cardiorespiratory fitness, insulin sensitivity, blood pressure, lipid profiles, percent body fat, BMI, intake of fruit, total sugar and sweetened beverages, FBG, and television viewing.
Results
Mean vegetable and fruit intake increased significantly more in the intervention group than in the control group over time (group by visit interaction, p=0.02 and p=0.002, respectively). Both groups had significant increases in percent body fat and decreases in waist circumference, insulin sensitivity, blood cholesterol, LDL, television viewing, and total intakes of energy, saturated fat, sugar, and sweetened beverages.
Conclusions
A culturally influenced, low-intensity lifestyle intervention can improve self-reported intakes of vegetables and fruit over 18 months in young, urban American Indian women.
Rates of type 2 diabetes are increasing at an alarming rate throughout the United States and other developed countries. American Indians are among those at highest risk; the prevalence of type 2 diabetes among American Indians and Alaska Natives across the U.S. aged 18 and older is 13.6%, compared with 7.4% for the overall U.S. population.1 Depending on the tribe, prevalence of type 2 diabetes is two to five times higher than among non-Hispanic whites.2 Type 2 diabetes is now recognized as a major public health problem among young American Indians and Alaska Natives, as prevalence among those aged <35 years has increased by 46% in under a decade.3
Risk factors for type 2 diabetes in both the general population and among American Indians and Alaska Natives include overweight or obesity, physical inactivity, and family history.4 For reasons not yet understood, populations with higher prevalence of type 2 diabetes (including Pima Indians) may have higher glucose-stimulated insulin secretion and lower insulin sensitivity, even among individuals with normal glucose tolerance.5 Regular physical activity and consuming diets lower in fat and added sugars and higher in plant-based foods are associated with reduced prevalence of obesity.6 Studies assessing risk factors among American Indians and Alaska Natives have reported a high prevalence of overweight and obesity among men and women7–9 and a consumption of diets relatively high in fat, fast foods, and sugared beverages.10–14 Many American Indian women report physical activity levels lower than current recommendations.9,15–17
A significant amount of research on type 2 diabetes has been conducted with American Indians living in rural reservation communities.18–21 However, as American Indians migrate to urban centers, there is a pressing need to gather information and develop prevention programs for American Indians living in urban environments since there are few preventive services available for these culturally diverse urban American Indians. A rural program based in a tribal reservation community can be designed to fit the cultural traditions of the specific tribal nation. However, cities attract American Indians from a variety of tribes, who then live and work alongside urban residents of other cultures, indicating a need for programs that address the strengths and challenges of this cultural diversity. Currently, 56% of the 2.5 million people identifying themselves exclusively as American Indian/Alaska Native live in cities, and this number increases to 66% for those identifying themselves as American Indian/Alaska Native or as American Indian/Alaska Native in combination with some other racial category.22 It is critical that information on the risk factors of urban American Indians is assessed and utilized to guide the development and implementation of prevention and treatment programs for this population.
The aim of this paper was to describe the effects of a culturally influenced intervention on behavioral risk factors for type 2 diabetes among asymptomatic American Indian women recruited from the general urban community. The main research hypothesis was that intervention participants would improve one or more of the following primary outcomes in the intervention group compared to the control group over 18 months of follow-up: decreased dietary fat, total energy intake, increased vegetable consumption, self-reported leisure-time physical activity or percentage of participants who meet physical activity recommendations. The secondary hypothesis was that intervention participants would improve on fruit and sweetened beverage intake, body composition, insulin sensitivity, fasting blood glucose (FBG), resting blood pressure or lipid profiles in the intervention group compared to the control group over the 18-month follow-up period.
Research Design and Methods
Two hundred American Indian women aged 18 to 40 years were recruited without regard to weight, FBG, or other risk factors for type 2 diabetes from a southwest U.S. city to participate in this RCT. Inclusion criteria included age 18–40 years on recruitment into the study; self-reported identity as American Indian; not pregnant per self-report during screening, verified with a pregnancy test at baseline, and not planning a pregnancy over the subsequent 2 years; willingness to stay in the urban area for 2 years; and not having type 2 diabetes. Human subject approval was obtained from the University of New Mexico Health Sciences Center Human Research Review Committee June 27, 2001, after prior approval from the Institutional Review Board of the regional Indian Health Service office.
Recruitment and Retention of Participants
Volunteers were recruited through flyers, word-of-mouth, and local print and television media. Interested volunteers were screened via telephone for eligibility. If eligible, an in-person meeting was scheduled for further explanation and formal consent before scheduling baseline clinical measurements to determine eligibility of FBG ≤6.94 mmol/L (126 mg/dL).23
To optimize participant retention, transportation was provided to intervention sessions and clinic visits as needed. Participants were reimbursed for child care and sent clinic visit reminders by mail, e-mail, and telephone. Each intervention session was offered three times per month at times participants indicated as convenient. A 5-month schedule was mailed during the month prior to the start of the intervention, and staff called each participant during the week of each session to determine potential attendance. Intervention-group women received educational materials and incentives at each session (e.g., cutting boards to support increased vegetable intake), and all participants received $50 cash after each completed clinic visit.
Intervention
A team of Native and non-Native professionals from diverse health professional and research training backgrounds adapted a curriculum previously used with rural Pueblo Indian adults with type 2 diabetes.24 The intervention targeted specific dietary and activity behaviors (Table 1). All strategies were based on achieving behavior change via social cognitive theory (SCT).25 A theory matrix was developed listing specific facilitator and participant actions related to each SCT construct within the intervention.26 Revisions of cultural content were based on feedback from pilot testing with urban Native women.26,27 Cultural content in the final intervention included didactic and discussion support of American Indian physical activities and dietary cultural strengths, examples of diabetes prevention approaches by tribal nations across the country, and graphics of Native women in the target age group.
Table 1.
Lifestyle intervention objectives for monthly group discussion-format educational sessions facilitated by American Indian health educators
| Session | Objectives |
|---|---|
| All sessions |
|
| One: Be Strong in Body and Spirit |
|
| Two: Veggie Tales |
|
| Three: Sugar and Spice Aren’t Necessarily Nice |
|
| Four: Planting Seeds of Wisdom |
|
| Five: Growing Your Garden of the Future |
|
The final intervention consisted of five discussion-format group sessions (one per month for five months) facilitated by two trained female American Indian health educators. Both facilitators helped design the intervention. Facilitator training included review of SCT constructs, objectives, and didactic materials for each behavioral strategy and session. Sessions lasted 2 to 2.5 hours and included learning to read food labels, strategies for choosing healthier foods when eating out or snacking, taste-testing of healthy meals, and dissemination of inexpensive recipes for at-home preparation of foods to increase vegetable and fruit intake and decrease saturated fats (see Table 1). Weather permitting, the facilitator led a 15-minute outdoor walk at the beginning of each session. Goal-setting was emphasized in all sessions to provide practice in self-selecting behavior-change goals, taking feasible action steps, developing strategies to address barriers, and enhancing facilitators of behavior change with emphasis on nonfood rewards. Each session included discussion of how strategy implementation proceeded during the previous month. An independent evaluation team member observed each session and coded the extent to which each session objective was met. For missed sessions, intervention-group participants received didactic materials and a brief review of content prior to the subsequent session. Additional information about intervention development and evaluation is described elsewhere.26
Measurements
Primary outcome measures included dietary fat and energy intake, vegetable consumption, self-reported leisure-time physical activity, and percentage of participants who met the current recommendations for physical activity (150 minutes/week of moderate/vigorous physical activity).28 Secondary outcome measures included: cardiorespiratory fitness; percent body fat; BMI; dietary intake of fruit, total sugar (g/day), and sweetened beverages (oz/day); FBG; time spent viewing television; insulin sensitivity; and resting blood pressure and fasting lipid profiles.
All data were collected from 2002 to 2006 at the university-based National Institutes of Health (NIH)–funded General Clinical Research Center (GCRC). Measurements were conducted at baseline and post-intervention at 6, 12, and 18 months. Participants arrived at the outpatient GCRC in the morning following an overnight fast. GCRC research staff was blinded to the group status of participants. Fasting blood samples were taken via venipuncture using standard procedures and analyzed for serum glucose, insulin, and blood lipids. Serum glucose was assessed using an enzymatic assay. Serum free insulin was determined using a chemiluminescent immunometric assay. Blood lipids (total cholesterol, triglycerides, HDL [measured], and LDL [calculated]) were analyzed. Total cholesterol and triglycerides were analyzed using spectrophotometry. Direct HDL-cholesterol was determined using an elimination enzymatic assay. The LDL value was calculated from total cholesterol, triglycerides, and HDL (LDL = CHOL−[(TRIG/5) + HDL]). Insulin sensitivity was estimated using the log-transformed equation QUICKI.29 Based on FBG values, participants were classified as having normal FBG (<5.55 mmol/L or <99 mg/dL) or impaired FBG (5.55 to 6.94 mmol/L or 100 to 125 mg/dL).23 FBG status was used to randomize participants so that participants with impaired fasting glucose were spread equally among intervention and control groups.
Height was measured using a stadiometer, a beam scale was used to measure body weight, and a tape measure was used to assess waist circumference.30 BMI was calculated (kg/m2) and participants classified as normal weight (BMI <25 kg/m2); overweight (BMI 25–29.9 kg/m2); or obese (BMI≥30 kg/m2). Body composition was measured using bioelectric impedance analysis, applying a prediction equation validated with American Indian women.31 Digital monitors with automated cuffs were used to measure resting blood pressure.
Self-reported physical activity and hours per day of television viewing were assessed using the Modifiable Activity Questionnaire, which has been validated with Pima Indian women and men.32 Cardiorespiratory fitness (VO2 peak) was estimated using the YMCA submaximal bicycle ergometer test.33 Women who were unable to complete the bicycle test were retained in analyses for all other outcome variables. Past-year (at baseline) and previous 6-month (at the three follow-up measurements) average total energy intake (kcal/day); total fat intake (g/day); saturated fat intake (g/day); and fruit and vegetable intake (servings/day) were assessed using the Block 98 quantitative food frequency questionnaire (FFQ) with the addition of regional foods (Block Dietary Data Systems).34 The composite Southwestern foods have been validated in New Mexico with Hispanic and non-Hispanic white women,35 and they contain foods that are commonly available in New Mexico and are reported to be consumed by American Indian youth and adults.36–38 FFQ data were reviewed for completeness, and study staff obtained and recorded participants’ missing responses. Research dietitians administered a standard 24-hr dietary recall at each visit using Nutrition Pro, version 1.0 software for nutrient computations. Values reported here for total sugar and sweetened beverage intake are from the 24-hour recall, as these data are not available from FFQ analysis.
Statistical Analyses
All data were analyzed in 2006 and 2007. Because of concerns about potential bias from missing data due to dropout, participants’ last values for each measure were carried forward from the point of dropout for an intent-to-treat analysis.39 Reasons for dropout included pregnancy, moving out of the geographic area, or reporting being too busy to continue. The remaining missing values were interpolated by averaging the adjacent values. Missing values were due to skipped clinic visits, skipped fitness tests, or invalid data. Invalid data consisted of failure to complete at least two stages of the YMCA protocol for the bicycle fitness test, or an invalid FFQ per the Block 98 computerized internal validity checks. All analyses were performed using SAS, version 9.1.
Descriptive statistics were generated for all outcome variables. A 2 × 4 (group by visit) repeated measures ANOVA (RM ANOVA) using PROC MIXED was used to determine effects of the intervention over follow-up. For nonsignificant group by visit interactions, higher order interactions were excluded and results were reported for the reduced models. For categoric variables, Fisher’s exact test was used to determine between-group differences.
Results
Between January 2002 and February 2006, 473 potential volunteers contacted the research office about the study, 333 expressed interest and met telephone screening eligibility criteria, 257 scheduled a consent appointment, 228 completed the consent process, and 211 participants attended the baseline clinic measures appointment (Figure 1). On baseline screening, four participants were ineligible due to a positive pregnancy test and all measures were halted. Seven women completed baseline measures but were ineligible due to FBG levels indicative of type 2 diabetes. Ineligible participants were informed of their status and referred to their healthcare provider for appropriate follow-up. The seven ineligible participants with baseline information differed from the 200 eligible participants only in FBG. The sample of 200 volunteers who entered this study is an estimated 6.6% (200 of 3050) of American Indian and Alaska Native women aged 20–39 years residing in the catchment area as of 2005 census figures.40
Figure 1.
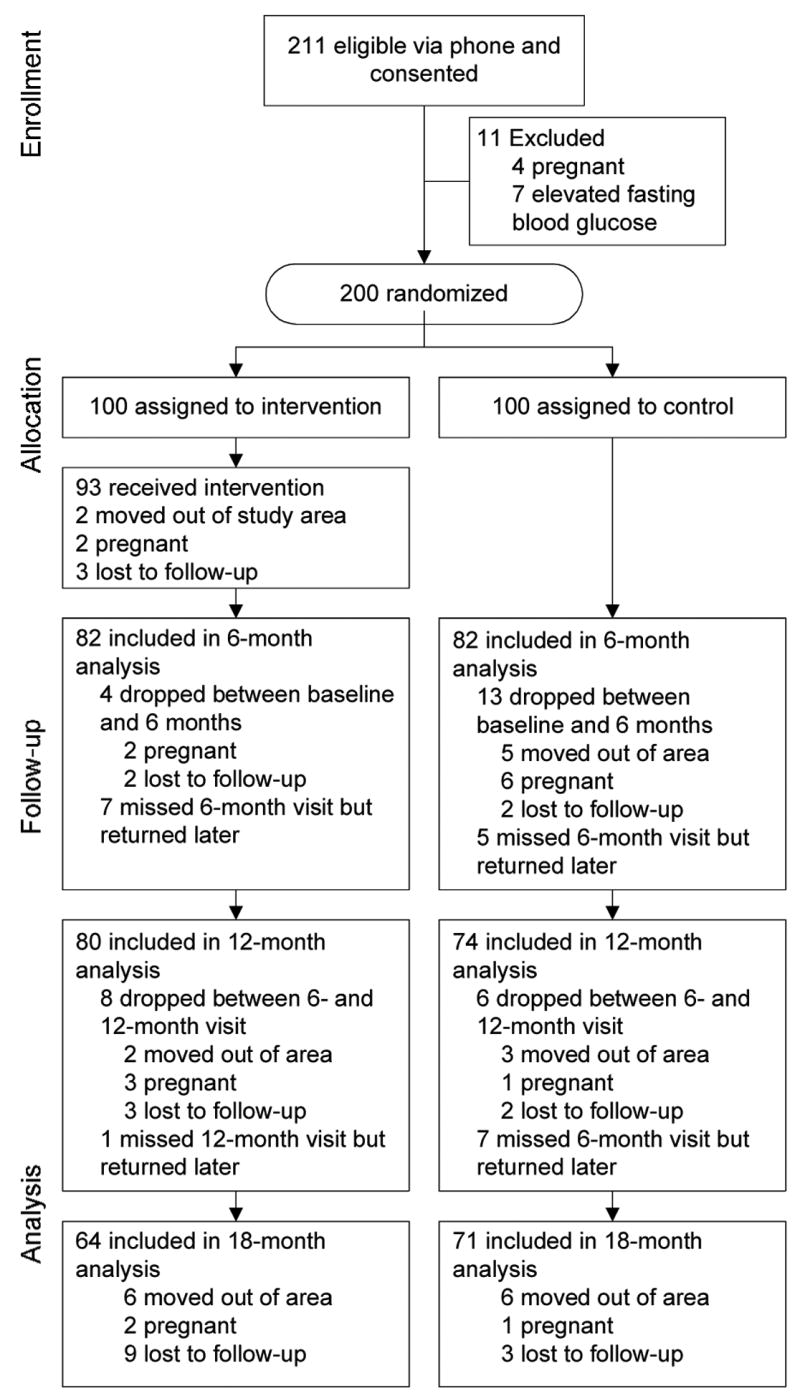
Flow of study participants showing new dropouts at each follow-up
Eligible participants were block-randomized according to fasting glucose status (normal versus impaired) into the intervention group (n=100) or the control group (n=100) by two computer-generated lists to ensure equivalent numbers of participants with impaired fasting glucose in each group. The study was designed to offer a delayed intervention to women in the control group, as informal discussions held with young urban American Indian women during study development indicated this would improve recruitment and retention in the study, and would indicate a commitment to the community beyond the life of the research study. During the 18-month study period, control-group participants received mailings of a Native health magazine, address change postcards, clinic visit reminders, and phone calls to schedule clinic visits.
As shown in Table 2, there were no significant differences at baseline between intervention and control participants in regards to age, BMI, family history of type 2 diabetes, personal history of gestational diabetes, education level, number of children, number of women working outside of the home, and stage of change for lifestyle behaviors. Additional baseline data describing participants are published elsewhere.41
Table 2.
Baseline characteristics among 200 urban American Indian women by intervention versus control group
| Intervention groupa (n=100) | Control groupa (n=100) | |
|---|---|---|
| Age in years, Mean (SD) | 29.6 (6.6) | 28.9 (6.7) |
| BMI (%) | ||
| Obese (BMI 30.0 kg/m2) | 41.0 | 39.0 |
| Overweight (BMI=25.0–29.9 kg/m2) | 36.0 | 29.0 |
| Average (BMI < 25.0 kg/m2) | 23.0 | 32.0 |
| Impaired fasting glucose (5.55–6.94 mmol/L) (%) | 19.0% | 23.0% |
| Family history of type 2 diabetes (%) | 78.3 (n=97) | 73.2 (n=97) |
| Gestational diabetes (%) | 5.0 | 11.3 |
| Education (%) (n=170) | ||
| College graduate | 25.6 | 23.8 |
| 1–3 years of college | 62.2 | 57.5 |
| Graduated high school | 10.0 | 13.8 |
| Not high school graduate | 2.2 (n=90) | 5.0 (n=80) |
| Have children (%) | 53.0 | 60.0 |
| Work outside the home (%) | 65.0 | 62.0 |
| Stage of change for eating three servings of vegetables,b Mean (SD) | 3.11 (0.97) | 3.04 (0.73) |
| Stage of change for choosing lower-fat foods,b Mean (SD) | 3.37 (1.09) | 3.24 (1.17) |
| Stage of change for exercise,b Mean (SD) | 3.31 (1.05) | 3.26 (0.92) |
| Stage of change for choosing foods lower in sugar,b Mean (SD) | 3.27 (1.20) | 3.18 (1.20) |
| Stage of change for choosing healthier snacks,b Mean (SD) | 3.11 (0.99) | 2.99 (1.00) |
| Stage of change for choosing healthier fast foods,b Mean (SD) | 3.17 (1.14) | 3.19 (1.12) |
| Stage of change for asking for support from family and friends,b Mean (SD) | 3.07 (1.27) | 2.97 (1.17) |
| Combined stage of change (%) (n=149)b,c | ||
| Pre-contemplation (1.0–1.5) | 0.0 | 1.4 |
| Contemplation (1.51–2.5) | 16.0 | 16.2 |
| Preparation (2.51–3.5) | 49.3 | 56.8 |
| Action (3.51–4.5) | 29.3 | 20.4 |
| Maintenance (4.51–5.0) | 5.3 | 5.4 |
Percentages and means are statistically similar between the intervention and control groups for each variable per Fisher’s exact test or student t-test (all p-values>0.30).
Stages of change baseline data were available for 75 intervention and 74 control group participants. Stage of change response options and scoring: 5, regularly for longer than 6 months (maintenance stage); 4, regularly but have begun doing so only within the past 6 months (action stage); 3, do some but not regularly (preparation stage); 2, do not but have been thinking about starting within the next 6 months (contemplation stage); or 1, do not and have not thought about starting in the next 6 months (pre-contemplation stage).
Combined stage of change scores were calculated by averaging participants’ scores on the seven stage of change variables for exercise, vegetable intake, low-fat food consumption, eating healthier snacks, eating less sugar, choosing healthier fast foods, and seeking social support.
Fifty-three of the 100 women (53%) in the intervention group attended three or fewer of the five intervention sessions. Retention at the 6-month clinic visit was 164/200 (82.0%), and was 154/200 (77.0%) and 135/200 (67.5%) at 12- and 18-month visits, respectively. Analyses indicated dropout was random between the groups. Reasons for dropout included moving out of the area, pregnancy, or self-reporting being too busy to continue (see Figure 1).
The impact of the intervention on primary outcomes is reported in Table 3. RM ANOVA analyses found a significant group × visit interaction for vegetable intake, indicating that the intervention group reported a significantly higher intake of vegetables as compared to the control group over the course of the study (p=0.02). No other significant group × visit interactions for primary outcomes were found. The RM ANOVA analyses also indicated an effect of visit, in that both groups showed significant decreases over time in intakes of total energy, total fat, and saturated fat. Leisure-time physical activity did not significantly change over time. At baseline, 64.0% of the intervention group and 70.0% of the control group met the current recommendations for at least 150 minutes of moderate or 60 minutes of vigorous activity per week. Among those in the intervention group who did not meet recommended levels at baseline, 38.9% did meet criteria by 18 months, compared to 33.3% in the control group (p=0.80).
Table 3.
Mean values of primary outcomes at baseline and follow-up after a diabetes prevention intervention
| Outcome variable | Group | Baselinea mean (SD) | 6 - monthsb mean (SD) | 12 monthsb mean (SD) | 18 monthsb mean (SD) | RM ANOVA Group × visit Interaction p-valuec | RM ANOVA Effect of visit p-valued |
|---|---|---|---|---|---|---|---|
| Total energy intake (kcal/day) | Intervention | 2201.3 (971.8) | 1921.5 (763.9) | 1846.2 (710.7) | 1883.3 (652.9) | 0.46 | <0.001 |
| Control | 2191.8 (978.2) | 1953.8 (795.5) | 1976.2 (855.9) | 1694.8 (876.4) | |||
| Total fat intake (g/day) | Intervention | 94.9 (44.5) | 82.4 (36.5) | 80.2 (35.4) | 81.0 (33.2) | 0.55 | <0.001 |
| Control | 96.6 (49.6) | 85.4 (41.9) | 87.8 (44.2) | 86.3 (44.6) | |||
| Saturated fat intake (g/day) | Intervention | 29.7 (14.2) | 25.7 (11.5) | 25.0 (10.9) | 24.9 (10.0) | 0.76 | <0.001 |
| Control | 30.0 (15.2) | 26.2 (12.6) | 26.4 (12.5) | 26.4 (13.5) | |||
| Vegetable intake (servings/day) | Intervention | 2.90 (1.71) | 3.21 (2.41) | 2.81 (1.67) | 3.17 (2.05) | 0.02 | — |
| Control | 2.73 (1.69) | 2.86 (1.96) | 2.68 (1.68) | 2.83 (1.96) | |||
| Total leisure- time activity (min/week) | Intervention | 5.06 (4.83) | 5.22 (4.56) | 5.08 (5.14) | 4.94 (4.89) | 0.48 | 0.30 |
| Control | 6.13 (6.40) | 5.67 (6.58) | 5.29 (4.93) | 5.22 (4.93) |
Baseline means statistically equivalent between groups (all p>0.30 per student t-test). n=96 for the Intervention group and n=95 for the Control group for all dietary variables; n=100 per group for total leisure-time activity.
Missing data due to dropping out of the study were addressed by applying intention to treat (last value carried forward). Remaining missing data were interpolated by averaging the adjacent values.
Repeated measures analyses of variance (RM ANOVA) model for each outcome variable with Group (Intervention versus Control) as a grouping variable, visit as a repeated factor and with group by visit interaction term.
If group by visit interaction was not significant, then additive RM ANOVA model with Group (Intervention versus Control) as a grouping variable and visit as the repeated variable.
Table 4 shows the impact of the intervention on secondary outcomes. RM ANOVA analyses showed a significant group × visit interaction for fruit, indicating a significantly greater increase in reported fruit intake for the intervention group as compared to the control group. There were no significant group × visit interactions for any other secondary variables. However the group × visit interactions for BMI and diastolic blood pressure approached significance, indicating a trend toward a decrease in BMI in the intervention group and an increase in BMI for the control group over time (p=0.08), and a trend toward a decrease in diastolic blood pressure for the intervention group and an increase in this variable for the control group at 6 months post-intervention (p=0.06). At 6 months, 49.0% of the intervention group versus 34.0% of the control group had lost weight compared to baseline (p=0.04), with a mean percentage loss of 2.1±3.2% and 1.7±3.9% of baseline body weight, respectively. At 18 months, 59.0% of the intervention group and 52.0% of the control group had lost weight compared to baseline (p=0.39), with a mean percentage loss of 4.7±4.2% and 4.8±4.0% of baseline body weight, respectively (data not shown). There was a significant effect of visit indicating increases in percent body fat and HDL for both groups over time, and decreases for both groups for dietary intake of total sugar and sweetened beverages, television viewing, insulin sensitivity, waist circumference, total cholesterol, and LDL.
Table 4.
Mean values of secondary outcomes at baseline and follow-up after a diabetes prevention intervention
| Outcome variable | Group | Baseline mean (SD)a | 6 months mean (SD)b | 12 months mean (SD)b | 18 months mean (SD)b | RM ANOVA Group visit Interaction p-valuec | RM ANOVA Effect of visit p-valued |
|---|---|---|---|---|---|---|---|
| Fruit intake (servings/day) | Intervention | 1.03 (0.73) | 1.27 (0.86) | 1.23 (0.88) | 1.31 (0.92) | 0.002 | |
| Control | 1.12 (0.85) | 1.17 (0.96) | 1.08 (0.85) | 1.12 (0.95) | |||
| Total sugar intake (g/day) | Intervention | 116.2 (86.8) | 83.0 (60.4) | 89.7 (63.9) | 90.4 (75.5) | 0.18 | <0.001 |
| Control | 109.8 (71.9) | 97.2 (60.5) | 84.9 (63.5) | 93.4 (58.9) | |||
| Sweetened beverages (oz/day) | Intervention | 22.2 (21.5) | 15.9 (16.6) | 16.3 (17.4) | 16.9 (17.7) | 0.26 | <0.001 |
| Control | 20.5 (18.1) | 19.3 (18.9) | 15.7 (15.8) | 17.5 (18.6) | |||
| Television viewing (hrs/day) | Intervention | 2.42 (1.80) | 2.02 (1.46) | 1.96 (1.54) | 2.03 (1.55) | 0.89 | <0.001 |
| Control | 2.54 (1.99) | 2.08 (1.56) | 1.98 (1.48) | 2.00 (1.76) | |||
| Control | 92.84 (8.95) | 93.78 (9.62) | 92.74 (9.25) | 92.86 (8.78) | |||
| Fasting blood glucose (mmol/l) | Intervention | 5.20 (0.46) | 5.14 (0.43) | 5.17 (0.49) | 5.12 (0.54) | 0.21 | 0.47 |
| Control | 5.16 (0.50) | 5.21 (0.53) | 5.15 (0.51) | 5.16 (0.49) | |||
| Insulin sensitivity (QUICKI) | Intervention | 0.33 (0.03) | 0.33 (0.03) | 0.33 (0.03) | 0.33 (0.03) | 0.76 | 0.001 |
| Control | 0.33 (0.03) | 0.33 (0.03) | 0.33 (0.03) | 0.32 (0.03) | |||
| BMI (kg/m2) d | Intervention | 29.5 (5.9) | 29.4 (5.8) | 29.4 (6.0) | 29.4 (6.0) | 0.08 | 0.58 |
| Control | 29.2 (6.7) | 29.3 (6.3) | 29.5 (6.4) | 29.6 (6.5) | |||
| Body fat (%) | Intervention | 41.6 (6.3) | 41.8 (6.4) | 42.1 (6.3) | 42.3 (6.4) | 0.66 | <0.001 |
| Control | 40.8 (6.6) | 41.2 (6.3) | 41.5 (6.2) | 41.6 (6.2) | |||
| Waist circumference (cm) | Intervention | 93.3 (14.7) | 92.1 (14.3) | 91.7 (14.6) | 91.9 (14.7) | 0.77 | <0.001 |
| Control | 91.8 (15.6) | 90.8 (14.4) | 90.9 (15.0) | 90.5 (15.5) | |||
| Systolic blood pressure (mmHg) | Intervention | 115.8 (13.2) | 115.3 (13.7) | 114.4 (13.1) | 114.9 (12.2) | 0.72 | 0.81 |
| Control | 116.6 (11.2) | 116.9 (14.3) | 116.7 (14.1) | 117.0 (14.0) | |||
| Diastolic blood pressure (mmHg) | Intervention | 67.6 (10.8) | 66.1 (10.0) | 68.0 (10.4) | 67.9 (9.3) | 0.06 | 0.82 |
| Control | 68.7 (9.4) | 69.9 (10.6) | 69.1 (10.4) | 68.8 (9.7) | |||
| Peak VO2 (L/min) | Intervention | 2.08 (0.45) | 2.05 (0.43) | 2.06 (0.41) | 2.05 (0.40) | 0.93 | 0.13 |
| Control | 1.20 (0.41) | 1.94 (0.36) | 1.98 (0.39) | 1.94 (0.38) | |||
| Total cholesterol (mmol/l) | Intervention | 4.34 (0.81) | 4.20 (0.78) | 4.20 (0.79) | 4.18 (0.78) | 0.60 | <0.001 |
| Control | 4.36 (0.65) | 4.28 (0.62) | 4.22 (0.69) | 4.27 (0.64) | |||
| LDL (mmol/l) e | Intervention | 2.42 (0.65) | 2.28 (0.66) | 2.26 (0.63) | 2.28 (0.61) | 0.88 | <0.001 |
| Control | 2.38 (0.52) | 2.28 (0.51) | 2.23 (0.56) | 2.27 (0.57) | |||
| HDL (mmol/l) e | Intervention | 1.26 (0.31) | 1.26 (0.30) | 1.29 (0.33) | 1.26 (0.29) | 0.94 | 0.03 |
| Control | 1.31 (0.31) | 1.30 (0.27) | 1.34 (0.32) | 1.30 (0.29) | |||
| Triglycerides (mmol) | Intervention | 1.46 (0.64) | 1.44 (0.68) | 1.41 (0.60) | 1.40 (0.68) | 0.24 | 0.18 |
| Control | 1.46 (3.15) | 1.52 (0.68) | 1.40 (0.57) | 1.52 (0.72) |
Baseline means statistically equivalent between groups (all p>0.10 per student t-test). n=96 for the Intervention group and n=95 for the Control group for fruit intake; for peak VO2 n=98 at baseline and 6 months for Intervention group, and n=99 for 12 months and 18 months for Intervention group and for all time points for Control group; n=100 per group for all other variables.
Missing data due to dropping out of the study were addressed by applying intention to treat (last value carried forward). Remaining missing data were interpolated by averaging the adjacent values.
Repeated measures analyses of variance (RM ANOVA) model for each outcome variable with Group (intervention versus control) as a grouping variable, visit as a repeated factor and with group by visit interaction term.
If group by visit interaction was not significant, then additive RM ANOVA model with Group (Intervention versus Control) as a grouping variable and visit as the repeated variable.
BMI=body mass index; LDL=low-density lipoprotein cholesterol; HDL=high-density lipoprotein cholesterol.
Conclusion
Results of this trial demonstrated that the culturally influenced intervention resulted in significant increases in self-reported intake of vegetables and fruit. These changes were maintained for 1 year following the intervention. Immediately following the intervention, significantly more women in the intervention group lost weight compared to the control group, but by the end of the follow-up period there was no difference in the percentage of women who lost weight or the mean percentage of baseline body weight lost by treatment group.
Enrollment in the trial resulted in improvements in select diabetes factors for both treatment groups. However, both groups showed a small but significant increase in percent body fat (≤1%) and a small but significant decrease in insulin sensitivity (0.006–0.008). The increase in percent body fat appears contradictory to the significant decrease in waist circumference experienced by both groups. These small changes in percent body fat and insulin sensitivity are within the margins of error and normal variability ranges for these methods and are not considered clinically significant.30,42,43 In addition, no significant changes in fasting blood glucose occurred in either treatment group. The decrease in waist circumference experienced in both groups was accompanied by decreases in blood cholesterol; LDL; hours spent viewing television per day; and self-reported intakes of total energy, total fat, saturated fat, total sugar, and sweetened beverages. The decrease observed in saturated fat intake for both groups is particularly relevant, as there is increasing evidence that higher saturated fat intakes may be more important in the development of insulin resistance and resulting type 2 diabetes than total fat intake.44,45 Sweetened beverage intake also has been linked to weight gain and development of type 2 diabetes.44,46,47 Thus it appears that these study participants, regardless of group assignment, had reduced the time they spent doing a sedentary behavior and made changes in food intake that resulted in decreasing their waist circumference and improving their lipid profile.
It is recognized that people who are willing to enroll and participate in interventions may be more ready to make lifestyle changes, and many will do so despite being assigned to a control group and being asked to maintain their current dietary and physical activity behaviors.48–50 Stage of change was assessed in the current trial and data related to stage of change and intervention attendance are published elsewhere51. As reported in Table 1, almost all of the participants in the current trial were either thinking about making, were preparing to make, or had already made dietary or activity lifestyle changes on entry into the study, which was likely an important contributor to both groups experiencing improved health benefits as a result of participation.
Despite the substantial research that has been conducted concerning the effects of diabetes in American Indian communities,5,18–20,24 there are few community-based lifestyle prevention interventions available.21 The Diabetes Prevention Program (DPP) demonstrated that an intensive lifestyle intervention successfully stimulated lifestyle modifications that reduced risk factors for type 2 diabetes and cardiovascular disease, specifically in overweight adults with impaired glucose tolerance.52–55
In contrast to the DPP, the current trial was designed as a low-intensity intervention so that it might reduce costs and meet the needs of diverse urban American Indian women. Thus, we intervened much earlier in life with women who are considered higher risk due to their genetic background, family history, and general tendencies toward higher rates of obesity and physical inactivity. It is not surprising that the intervention implemented in the current trial had less of an impact on diabetes risk than trials like the DPP, as it was less intensive and also because the women in the current trial were younger and at lower average risk for type 2 diabetes than the DPP participants. To our knowledge there are no published studies indicating the intensity level necessary to intervene effectively in individuals who are at genetically higher risk but do not have impaired glucose tolerance.
Determining the best time to intervene to reduce chronic disease risks is an important challenge facing researchers and healthcare professionals, with recent calls to combine high-risk and community-based approaches.21,56 When attempting to implement diabetes prevention interventions in communities, it is difficult to justify excluding people because they may not yet be obese or have impaired glucose tolerance. They are given the message from healthcare professionals that they are at high risk due to family history and less-healthful lifestyle behaviors, but then they do not qualify for interventions because their risk is not considered high enough according to predefined clinical or research standards. It is recognized that the chances of finding significant changes due to an intervention are substantially increased when intervening with high-risk individuals. The results of this current trial indicate that having trial participants who attend clinic visits every 6 months and get feedback about their body weight and general health can lower diabetes risk without receiving a formal intervention. These results are encouraging as they suggest that intense interventions may not be necessary for change among these young women, and receiving regular feedback on their health status may be enough of an intervention to effect sustained changes. Recent research has indicated that high-normal levels of FBG are predictive of increased risk for type 2 diabetes and cardiovascular disease,57,58 thus it appears important to intervene as early as possible. As resources are limited in both healthcare and community settings, this could indicate that more intense (and costly) interventions be prioritized for those at highest risk, while less intensive options made available for those who do not yet exhibit obesity or impaired glucose tolerance.
The generalizability of these results is limited due to the fact that participants were a convenience sample of volunteers; it is possible that women who perceived themselves at higher risk for type 2 diabetes and who were more motivated to change behaviors were willing to participate. The tribal affiliation of this sample was primarily Navajo and Pueblo tribes of the southwest, which could limit applicability to other tribal groups. In addition, self-reported measures of nutrient intake and physical activity are subject to recall bias,48,59 and the bicycle test may have been unable to detect any changes in cardiorespiratory fitness as the most common activity performed by the participants was walking. High variability in women’s responses at follow-up, especially among those with normal clinical values, and dropout reduced statistical power and made it difficult to detect significant differences between groups. Lower intervention attendance than anticipated also may have diminished possible effects of the intervention.
In conclusion, the results of this randomized controlled trial indicate that a culturally influenced, less-intensive lifestyle intervention can result in improvements in mean self-reported intakes of vegetables and fruit over an 18-month period in young, urban American Indian women. Both intervention and control groups experienced beneficial changes—in waist circumference; blood cholesterol and LDL; television viewing; and total intakes of energy, total fat, saturated fat, total sugar, and sweetened beverages—suggesting that less-intensive interventions may be effective in reducing risk for type 2 diabetes in this group.
Acknowledgments
This study and paper are dedicated to Janette Carter, MD (1952–2001), who passionately devoted her life’s work to the prevention and management of diabetes among Native Americans. All aspects of this work were funded by a grant from the National Institute of Diabetes, Digestive and Kidney Diseases (NIDDK), National Institutes of Health (grant # R01 DK 047096); this agency had no influence on the design of the study or evaluation and reporting of the study data. Statistical analyses and interpretation support were funded by a DHHS/NIH/NCRR-GCRC Grant #M01 RR00977.
All authors report no other conflicts of interest relevant to the subject matter discussed in this manuscript. We heartily thank the women who participated in this study. We also would like to acknowledge the GCRC nursing and dietetic outpatient staff for assistance with data collection, and Novaline Wilson, MPH, Georgia Perez, and Brenda Broussard, MPH, RD, for their contributions to intervention design and implementation and participant recruitment and retention in this study. All of these individuals were financially compensated for their time and contributions to this study.
Footnotes
Publisher's Disclaimer: This is a PDF file of an unedited manuscript that has been accepted for publication. As a service to our customers we are providing this early version of the manuscript. The manuscript will undergo copyediting, typesetting, and review of the resulting proof before it is published in its final citable form. Please note that during the production process errors may be discovered which could affect the content, and all legal disclaimers that apply to the journal pertain.
References
- 1.Pleis JR, Lethbridge-Cejku M. Summary health statistics for U.S. adults: National health interview survey, 2005. National Center for Health Statistics Vital Health Stat. 2006;10:1–153. [PubMed] [Google Scholar]
- 2.NIDDK, National Diabetes Information Clearinghouse. Diabetes in American Indians and Alaska Natives. Washington DC: National Institutes of Health (NIH), NIDDK. NIH Pub. No. 02-4567; May, 2002. [Google Scholar]
- 3.Acton KJ, Rios Burrows N, Moore K, Querec L, Geiss LS, Engelgau MM. Trends in diabetes prevalence among American Indian and Alaska Native children, adolescents, and young adults. Am J Public Health. 2002;92:1485–90. doi: 10.2105/ajph.92.9.1485. [DOI] [PMC free article] [PubMed] [Google Scholar]
- 4.Harding A-H, Griffin SJ, Wareham NJ. Population impact of strategies for identifying groups at high risk of type 2 diabetes. Prev Med. 2006;42:364–8. doi: 10.1016/j.ypmed.2006.01.013. [DOI] [PubMed] [Google Scholar]
- 5.Stefan N, Stumvoll M, Weyer C, et al. Exaggerated insulin secretion in Pima Indians and African-Americans but higher insulin resistance in Pima Indians compared to African-Americans and Caucasians. Diabet Med. 2004;21:1090–5. doi: 10.1111/j.1464-5491.2004.01290.x. [DOI] [PubMed] [Google Scholar]
- 6.Maskarinec G, Takata Y, Pagano I, et al. Trends and dietary determinants of overweight and obesity in a multiethnic population. Obesity. 2006;14:717–26. doi: 10.1038/oby.2006.82. [DOI] [PubMed] [Google Scholar]
- 7.Denny CH, Holtzman D, Cobb N. Surveillance for health behaviors of American Indians and Alaska Natives. Morbid Mortal Weekly Rep. 2003;52:1–13. [PubMed] [Google Scholar]
- 8.Liao Y, Tucker P, Okoro CA, Giles WH, Mokdad AH, Bales Harris V. REACH 2010 surveillance for health status in minority communities—United States, 2001–2002. Morbid Mortal Weekly Rep. 2004;53:1–28. [PubMed] [Google Scholar]
- 9.Adams PF, Schoenborn CA. Health behaviors of adults: United States, 2002–04. National Center for Health Statistics Vital Health Stat. 2006;10:1–140. [PubMed] [Google Scholar]
- 10.deGonzague B, Receveur O, Wedll D, Kuhnlein HV. Dietary intake and body mass index of adults in 2 Ojibwe communities. J Am Diet Assoc. 1999;99:710–6. doi: 10.1016/S0002-8223(99)00170-4. [DOI] [PubMed] [Google Scholar]
- 11.Harland BF, Smith SA, Ellis R, O’Brien R, Morris ER. Comparison of nutrient intakes of blacks, Siouan Indians, and whites in Columbus County, North Carolina. J Am Diet Assoc. 1992;92:348–50. [PubMed] [Google Scholar]
- 12.Vaughan LA, Benyshek DC, Martin JF. Food acquisition habits, nutrient intakes, and anthropometric data of Havasupai adults. J Am Diet Assoc. 1997;97:1275–82. doi: 10.1016/S0002-8223(97)00305-2. [DOI] [PubMed] [Google Scholar]
- 13.Lytle LA, Dixon LB, Cunningham-Sabo L, et al. Dietary intakes of Native American children: findings from the Pathways feasibility study. J Am Diet Assoc. 2002;102:555–8. doi: 10.1016/s0002-8223(02)90129-x. [DOI] [PubMed] [Google Scholar]
- 14.Cole SM, Teufel-Shone NI, Ritenbaugh CK, Yzenbaard RA, Cockerham DL. Dietary intake and food patterns of Zuni adolescents. J Am Diet Assoc. 2001;101:802–6. doi: 10.1016/S0002-8223(01)00199-7. [DOI] [PubMed] [Google Scholar]
- 15.Harnack L, Story M, Holy Rock B. Diet and physical activity patterns of Lakota Indian adults. J Am Diet Assoc. 1999;99:829–35. doi: 10.1016/S0002-8223(99)00197-2. [DOI] [PubMed] [Google Scholar]
- 16.Thompson JL, Wolfe VK, Wilson N, Pardilla MN, Perez G. Personal, social, and environmental correlates of physical activity in Native American women. Am J Prev Med. 2003;25(3S):53–60. doi: 10.1016/s0749-3797(03)00165-x. [DOI] [PubMed] [Google Scholar]
- 17.Brownson RC, Eyler AA, King AC, Brown DR, Shyu YL, Sallis JF. Patterns and correlates of physical activity among U.S. women 40 years and older. Am J Public Health. 2000;90:264–70. doi: 10.2105/ajph.90.2.264. [DOI] [PMC free article] [PubMed] [Google Scholar]
- 18.Lombard KA, Forster-Cox S, Smeal D, et al. Diabetes on the Navajo nation: what role can gardening and agriculture extension play to reduce it? Rural Remote Health. 2006;6:640. [PubMed] [Google Scholar]
- 19.Resnick HE, Jones K, Ruotolo G, et al. Insulin resistance, the metabolic syndrome, and risk of incident cardiovascular disease in nondiabetic American Indians: the Strong Heart Study. Diabetes Care. 2003;26:861–7. doi: 10.2337/diacare.26.3.861. [DOI] [PubMed] [Google Scholar]
- 20.Schulz LO, Bennett PH, Ravussin E, et al. Effects of traditional and western environments on prevalence of type 2 diabetes in Pima Indians in Mexico and the U. S Diabetes Care. 2006;29:1866–71. doi: 10.2337/dc06-0138. [DOI] [PubMed] [Google Scholar]
- 21.Satterfield DW, Volansky M, Caspersen CJ, et al. Community-based lifestyle interventions to prevent type 2 diabetes. Diabetes Care. 2003;26:2643–52. doi: 10.2337/diacare.26.9.2643. [DOI] [PubMed] [Google Scholar]
- 22.U.S. Census Bureau. U.S., inside metropolitan areas, outside metropolitan areas. Table DP1. Washington DC: U.S. Census Bureau, Department of Commerce; 2001. Profile of general demographic characteristics. [Google Scholar]
- 23.American Diabetes Association. Standards of medical care in diabetes: Diabetes Care. 2005;28:S4–S36. [PubMed] [Google Scholar]
- 24.Gilliland SS, Azen SP, Perez GE, Carter JS. Strong in Body and Spirit. Lifestyle intervention for Native American adults with diabetes in New Mexico Diabetes Care. 2002;25:78–83. doi: 10.2337/diacare.25.1.78. [DOI] [PubMed] [Google Scholar]
- 25.Bandura A. Health promotion by social cognitive means. Health Educ Behav. 2004;31:143–64. doi: 10.1177/1090198104263660. [DOI] [PubMed] [Google Scholar]
- 26.Helitzer D, Bobo Peterson A, Thompson J, Fluder S. Development of a planning and evaluation methodology for assessing the contribution of theory to a diabetes prevention lifestyle intervention. Health Promot Pract. 2006 doi: 10.1177/1524839906289076. [DOI] [PubMed] [Google Scholar]
- 27.Willging CE, Helitzer D, Thompson J. “Sharing Wisdom”: Lessons learned during the development of a diabetes prevention intervention for urban American Indian women. Eval Prog Plan. 2006;29:130–40. [Google Scholar]
- 28.U.S. Department of Health and Human Services (USDHHS) Physical activity and health: a report of the Surgeon General. Atlanta GA: USDHHS, Centers for Disease Control and Prevention (CDC), National Centers for Chronic Disease Prevention and Health Promotion; 1996. [Google Scholar]
- 29.Katz A, Nambi SS, Mather K, et al. Quantitative insulin sensitivity check index: a simple, accurate method for assessing insulin sensitivity in humans. J Clin Endocrinol Metab. 2000;85:2402–10. doi: 10.1210/jcem.85.7.6661. [DOI] [PubMed] [Google Scholar]
- 30.Heyward VH, Wagner DR. Applied Body Composition Assessment. 2. Champaign IL: Human Kinetics; 2004. Additional anthropometric methods; pp. 67–75. [Google Scholar]
- 31.Stolarczyk LM, Heyward VH, Hicks VL, Baumgartner RN. Predictive accuracy of bioelectrical impedance in estimating body composition of Native American women. Am J Clin Nutr. 1994;59:964–70. doi: 10.1093/ajcn/59.5.964. [DOI] [PubMed] [Google Scholar]
- 32.Kriska AM, Knowler WC, LaPorte RE, et al. Development of questionnaire to examine relationship of physical activity and diabetes in Pima Indians. Diabetes Care. 1990;13:401–11. doi: 10.2337/diacare.13.4.401. [DOI] [PubMed] [Google Scholar]
- 33.American College of Sports Medicine (ACSM) ACSM guidelines for exercise testing and prescription. 6. Philadelphia PA: Lippincott Williams and Wilkins; 2000. Physical fitness testing and interpretation; pp. 71–5. [Google Scholar]
- 34.Block G, Hartman AM, Dresser CM, Carroll MD, Gannon J, Gardner L. A data-based approach to diet questionnaire design and testing. Am J Epidemiol. 1986;124:453–69. doi: 10.1093/oxfordjournals.aje.a114416. [DOI] [PubMed] [Google Scholar]
- 35.Baumgartner KG, Gilland FD, Nicholson CS, et al. Validity and reproducibility of a food frequency questionnaire among Hispanic and non-Hispanic white women in New Mexico. Ethn Dis. 1998;8:81–92. [PubMed] [Google Scholar]
- 36.Gittelsohn J, Greer Toporoff E, Story M, et al. Food perceptions and dietary behavior of American-Indian children, their caregivers, and educators: formative assessment findings from Pathways. J Nutr Ed. 1999;31:2–13. doi: 10.1016/s0022-3182(00)70504-8. [DOI] [PMC free article] [PubMed] [Google Scholar]
- 37.Cunningham-Sabo LD, Davis SM, Koehler KM, et al. Food preferences, practices, and cancer-related food and nutrition knowledge of Southwestern American Indian youth. Cancer. 1996;78:1617–22. [PubMed] [Google Scholar]
- 38.Ballew C, White LL, Strauss KF, et al. Intake of nutrients and food sources of nutrients among the Navajo: findings from the Navajo Health and Nutrition Survey. J Nutr. 1997;127:2085S–2093S. doi: 10.1093/jn/127.10.2085S. [DOI] [PubMed] [Google Scholar]
- 39.Porta N, Bonet C, Cobo E. Discordance between reported intention-to-treat and per protocol analyses. J Clin Epidemiol. 2007;60:663–9. doi: 10.1016/j.jclinepi.2006.09.013. [DOI] [PubMed] [Google Scholar]
- 40.U.S. Census Bureau. American factfinder. American Community Survey. 2005 Available online at: http://factfinder.census.gov/
- 41.Thompson JL, Herman CJ, Allen P, et al. Associations between body mass index, cardiorespiratory fitness, metabolic syndrome and pre-diabetes in young, urban American Indian women. Metab Syndr Relat Disord. 2007;5:45–54. doi: 10.1089/met.2006.0015. [DOI] [PubMed] [Google Scholar]
- 42.Lee S, Choi S, Kim HJ, et al. Cutoff values of surrogate measures of insulin resistance for metabolic syndrome in Korean non-diabetic adults. J Korean Med Sci. 2006;21:695–700. doi: 10.3346/jkms.2006.21.4.695. [DOI] [PMC free article] [PubMed] [Google Scholar]
- 43.Chen H, Sullivan G, Quon MJ. Assessing the predictive accuracy of QUICKI as a surrogate index for insulin sensitivity using a calibration model. Diabetes. 2005;54:1914–25. doi: 10.2337/diabetes.54.7.1914. [DOI] [PubMed] [Google Scholar]
- 44.Schulze MB, Hu FB. Primary prevention of diabetes: what can be done and how much can be prevented? Annu Rev Public Health. 2005;26:445–67. doi: 10.1146/annurev.publhealth.26.021304.144532. [DOI] [PubMed] [Google Scholar]
- 45.Steyn NP, Mann J, Bennett PH, et al. Diet, nutrition and the prevention of type 2 diabetes. Public Health Nutr. 2004;7:147–65. doi: 10.1079/phn2003586. [DOI] [PubMed] [Google Scholar]
- 46.Schulze MB, Manson JE, Ludwig DS, et al. Sugar-sweetened beverages, weight gain, and incidence of type 2 diabetes in young and middle-aged women. JAMA. 2004;292:927–34. doi: 10.1001/jama.292.8.927. [DOI] [PubMed] [Google Scholar]
- 47.Malik VS, Schulze MB, Hu FB. Intake of sugar-sweetened beverages and weight gain: a systematic review. Am J Clin Nutr. 2006;84:274–88. doi: 10.1093/ajcn/84.1.274. [DOI] [PMC free article] [PubMed] [Google Scholar]
- 48.Kristal AR, Andrilla HA, Koepsell TD, Diehr PH, Cheadle A. Dietary assessment instruments are susceptible to intervention-associated response set bias. J Am Diet Assoc. 1998;98:40–3. doi: 10.1016/S0002-8223(98)00012-1. [DOI] [PubMed] [Google Scholar]
- 49.Hebert JR, Peterson KE, Hurley TG, et al. The effect of social desirability trait on self-reported dietary measures among multi-ethnic female health center employees. Ann Epidemiol. 2001;11:417–27. doi: 10.1016/s1047-2797(01)00212-5. [DOI] [PubMed] [Google Scholar]
- 50.Delgado-Rodriguez M, Llorca J. Bias. J Epidemiol Community Health. 2004;58:635–641. doi: 10.1136/jech.2003.008466. [DOI] [PMC free article] [PubMed] [Google Scholar]
- 51.Helitzer DL, Bobo Peterson A, Sanders M, Thompson J. Relationship of Stages of Change to attendance in a diabetes prevention program. Am J Health Promot. 2007;21:517–20. doi: 10.4278/0890-1171-21.6.517. [DOI] [PubMed] [Google Scholar]
- 52.Diabetes Prevention Program Research Group. Reduction in the incidence of type 2 diabetes with lifestyle intervention or metformin. N Engl J Med. 2002;346:393–403. doi: 10.1056/NEJMoa012512. [DOI] [PMC free article] [PubMed] [Google Scholar]
- 53.Ratner RE. An update on the Diabetes Prevention Program. Endocrine Pract. 2006;12(Suppl 1):20–4. doi: 10.4158/EP.12.S1.20. [DOI] [PMC free article] [PubMed] [Google Scholar]
- 54.Diabetes Prevention Program Research Group. Achieving weight and activity goals among Diabetes Prevention Program lifestyle participants. Obes Res. 2004;12:1426–34. doi: 10.1038/oby.2004.179. [DOI] [PMC free article] [PubMed] [Google Scholar]
- 55.Diabetes Prevention Program Research Group. Impact of intensive lifestyle and metformin therapy on cardiovascular disease risk factors in the Diabetes Prevention Program. Diabetes Care. 2005;28:888–94. doi: 10.2337/diacare.28.4.888. [DOI] [PMC free article] [PubMed] [Google Scholar]
- 56.Colagiuri R, Colagiuri S, Yach D, Pramming S. The answer to diabetes prevention: science, surgery, service delivery, or social policy? Am J Public Health. 2006;95:1562–9. doi: 10.2105/AJPH.2005.067587. [DOI] [PMC free article] [PubMed] [Google Scholar]
- 57.Tirosh A, Sai I, Tekes-Manova D, et al. Normal fasting plasma glucose levels and type 2 diabetes in young men. N Engl J Med. 2005;353:1454–62. doi: 10.1056/NEJMoa050080. [DOI] [PubMed] [Google Scholar]
- 58.Kim D-J, Kim K-W, Cho N-H, Noh J-H, Lee M-S, Lee M-K. The cutoff value of fasting plasma glucose to differentiate frequencies of cardiovascular risk factors in a Korean population. Diabetes Care. 2003;26:3354–6. doi: 10.2337/diacare.26.12.3354. [DOI] [PubMed] [Google Scholar]
- 59.Matthews CE. Use of self-report instruments to assess physical activity. In: Welk GJ, editor. Physical activity assessments for health-related research. Champaign IL: Human Kinetics; 2002. pp. 107–23. [Google Scholar]