

Abstract
Objective
Earlier studies described gaze discrimination impairment in schizophrenia. The purpose of this study was to compare gaze discrimination abilities and associated brain activation in persons with stable schizophrenia and matched controls.
Methods
13 schizophrenia and 12 healthy participants underwent a gaze discrimination task with face stimuli rotated at 0, 4 and 8° deviation. During fMRI with BOLD imaging, subjects were asked to identify whether a face was making eye contact. Subject-level parameter estimates for BOLD signal change were entered into an orientation by group mixed effect repeated measures ANOVA.
Results
Gaze discrimination performance did not differ between groups. Patients showed decreased activation in areas of bilateral inferior frontal and occipital areas, and select temporo-limbic regions, including amygdala. Groups differed by activation patterns according to gaze deviation. In controls, faces with 4° deviation produced higher activation in frontal and temporal regions. In patients, 0° deviation produced increased activation in amygdala and areas of temporal neocortex.
Conclusions
Despite similar gaze discrimination abilities, schizophrenia patients exhibit decreased brain activation in areas associated with executive, emotional and visual processing. Controls exhibited increased activation associated with the more difficult task in select frontal and temporal regions. Patients exhibited increased activation associated with direct gaze in temporal regions, which may relate to common symptoms.
Keywords: schizophrenia, gaze discrimination, faces, fMRI, frontal lobe, amygdala
1. Introduction
Impaired interpersonal engagement and socialization may be apparent long before the onset of schizophrenia (Watt 1978, Walker et al 1993) and these functions represent enduring hallmarks of the illness, independent of psychotic symptoms. Ocular regions and their functions, are instrumental in establishing interpersonal relatedness and conveying emotional information (Kleinke 1986). In schizophrenia, poor eye contact represents a common negative symptom (Andreasen 1984, Pitman et al 1987), which can affect interpersonal engagement and produce misperception of gaze direction, possibly leading to ideas of reference and paranoia.
Baron-Cohen (1995) proposed that gaze detection is governed by a cognitive module involving eye detection, gaze detection and determination of whether gaze makes direct contact. Lesion and functional brain studies in humans and primates support the role of the fusiform gyrus in face processing (Allison et al 1994, Clark et al 1996, Kanwisher et al 1997). Gaze detection consistently involves areas of the superior temporal sulcus (Perrett et al 1992, Campbell et al 1999, Hoffman and Haxby 2000, Pelphrey et al 2004) and prefrontal lobe (Wicker et al 1998), that are already implicated in schizophrenia, based on volumetric and functional studies (McCarley et al 1993, Gur and Pearlson 1993, Zipursky et al 1994).
Rosse et al. (1994) reported that persons with schizophrenia, particularly those with paranoia, misidentified faces with averted gaze as making eye contact. Two subsequent behavioral studies by Franck et al. (1998, 2002) showed unimpaired gaze detection and no clear association between the sense of being looked at and paranoia (2002). Most recently, Hooker and Park (2005) reported that persons with schizophrenia have a tendency to perceive averted gaze as making eye contact and this misperception is not due to perceptual spatial difficulties. The initial study employed faces turned at different degrees, a design supported by findings that frontal eye fields coordinate parallel head and eye shifts (Chen 2006). Subsequent studies employed faces in full frontal view with different degrees of gaze deviation (Franck et al 1998, Franck et al 2002, Hooker and Park 2005), which allows for more specific focus on ocular regions at the expense of appearing less naturalistic. The purpose of this study was to examine gaze discrimination in persons with stable outpatients with schizophrenia and measure blood-oxygen-level-dependent (BOLD) changes during discrimination of direct versus averted gaze in two conditions of varying difficulty. We hypothesized that even when task performance is similar for patients and controls, patients show altered activation in areas of visual processing and limbic system, consistent with alterations in processing of face (Onitsuka et al 2006) and gaze stimuli (Rosse et al 1994, Hooker and Park 2005) in schizophrenia. Such information can help elucidate differences in behavioral and brain based processing of gaze, which is fundamental for interpersonal relatedness and assigning relevance to social information.
2. Method
2.1. Subjects
13 persons with stable schizophrenia (ave. age=35.4yrs., age range=29-47yrs.) and 12 healthy participants (ave. age=30.1yrs, age range=23-52yrs.) were consecutive volunteers for brain-behavior studies at the Schizophrenia Research Center of the University of Pennsylvania. There were 6 men in each group, 11 of 13 patients and all controls were right-handed. Two controls and 2 patients were excluded from further analysis due to excessive motion and the final sample included 11 patients (5 males) and 10 controls (4 males). Participants underwent a medical examination, laboratory tests, and psychiatric assessment (Gur et al 1991, Shtasel et al 1991).
Patient criteria for entry into the center were a diagnosis of schizophrenia based on the Structured Clinical Interview for DSM-IV (SCID), no concomitant axis I or axis II disorder, and no medical or neurological event or disorder that might affect brain function. Patients had a mean duration of illness of 12.01yrs±7.63, all were studied while clinically stable consistent with schizophrenia, residual type (n=8) or in remission (n=3) and none had been hospitalized within 6 months prior. They had the following global ratings for positive (Andreasen 1984a) and negative (Andreasen 1984b) symptoms at the time of testing: Hallucinations=1.38±1.61, delusions=1.08±1.50, behavior=0, thought disorder=.62±1.26; affective flattening=1.62 ±1.45, alogia=.85±1.41, avolition=1.31±1.60, anhedonia=1.77±1.36, attention= .58±1.08. Three patients were treated with first generation antipsychotics (mean dose=357 chlorpromazine equivalents) and 10 with second-generation antipsychotics (mean dose=13.5 olanzapine equivalents), including 2 patients who were on combination treatment. Healthy participants, recruited through newspaper advertisements, underwent the same screening procedures and were assessed with the SCID nonpatient-version. They had no history of illness affecting brain function or a history of major psychiatric illness in first-degree relatives. After complete description of the study, written informed consent was obtained from all participants following consent procedures as mandated by the IRB at Penn.
Gaze Discrimination Task
Images of 3-dimensional neutral facial expressions of 4 persons (2 male, 2 female) underwent rotation of 4° and 8° from 0° head-on using VRMLView (http://www.sim.no) and horizontal transposition yielding 24 stimuli. We anticipated that gaze direction is readily identified in 0° and 8°, but not 4° rotation. Stimuli were presented in pseudorandom order for 1sec., followed by a 16 sec. inter-stimulus interval (baseline condition) during which subjects viewed a complex crosshair (fixation point superimposed on a scrambled face). Subjects were instructed to respond to the statement “This face looks at me (8 trails) or away (16 trails)?” during face presentation. During the inter-stimulus interval (rest condition) subjects were instructed to remain still, focus on the crosshair, and await the appearance of the next face. Examples of stimuli are presented in Figure 1. Patients had no difficulties comprehending task instructions and completed the behavioral task without apparent emotional distress.
Figure 1.

Examples of Faces with Gaze Deviation
fMRI Measurement
Participants were placed in the scanner in a supine position. Earplugs were fitted to muffle noise and head fixation was assured through a foam-rubber device mounted on the head coil. Stimuli were rear-projected to the center of the visual field using a PowerLite 7300 video projector (Epson America, Inc., Long Beach, CA.) and viewed through a head coil-mounted mirror. Stimuli presentation was synchronized with image acquisition using the PowerLaboratory® platform and responses made by button press on a non-ferromagnetic keypad (FORP™; Current Design Inc., Philadelphia, PA). Images were acquired using BOLD imaging (Bandettini et al 1992) on a clinical 3T Siemens Trio Scanner (Iselin, NJ). A 5 min. magnetization-prepared, rapid acquisition gradient echo image (MPRAGE) was acquired for anatomic overlays of functional data and spatial normalization (Talairach 1988). BOLD imaging used a 15-slice, single-shot gradient-echo (GE) echo-planar (EPI) sequence (TR/TE=1000/32 ms, FOV=240 mm, matrix= 64 × 64, slice thickness/gap=3/0mm). This sequence delivered a nominal voxel resolution of 3 × 3 × 3 mm. The slices were acquired from the superior cerebellum up through the frontal lobe. Inferiorly this corresponded to a level just below the inferior aspect of the temporal lobes and superiorly to approximately the level of the hand-motor area in the primary motor cortex.
Gaze Discrimination Task Analysis
Percent correct and median reaction time (RT; in milliseconds) were calculated for each gaze deviation (0°, 4°, 8°) class. Group differences in percent correct and reaction time among the classes were evaluated with separate repeated measures ANOVAs. To satisfy the normality assumptions of ANOVA, the arcsine transformation was applied to the percentages.
Image Processing and Statistical Analysis
The fMRI data were preprocessed and analyzed using FEAT (FMRI Expert Analysis Tool) Version 5.1, part of FSL (FMRIB’s Software Library, www.fmrib.ox.ac.uk/fsl). Images are slice time corrected, motion corrected to the median image using tri-linear interpolation with 6 degrees of freedom, high pass filtered (60 seconds), spatially smoothed (6 mm FWHM, isotropic) and scaled using mean-based intensity normalization. Resulting translational motion parameters were examined to insure that there is not excessive motion (i.e., >6 mm in any plane). BET was used to remove non-brain areas (Smith 2002). The median functional image was coregistered to the T1-weighted structural volume and then transformed into the standard anatomical space (T1 MNI template) using the tri-linear interpolation (Jenkinson and Smith 2001) and transformation parameters were later applied to statistical images.
Subject-level time-series statistical analysis was carried out using FILM (FMRIB’s Improved Linear Model) with local autocorrelation correction (Woolrich 2001). The three condition events were modeled using a canonical hemodynamic response function and its temporal derivative. Linear contrast maps for each condition minus baseline were produced and spatially normalized as described above. The group level analysis was accomplished by entering contrast maps for the three gaze deviations minus baseline into a group (control, patient) by gaze (0°, 4°, 8°) mixed effect ANOVA. To increase power, right and left gaze conditions were collapsed in a single regressor. A voxel level corrected significance threshold of p=0.05 was applied to the group z (Gaussianised F) image using GRF-theory based maximum height thresholding (Worsley, 1992). Follow-up exploratory analyses tested within group effects of gaze on brain activation with separate ANOVAs and the resulting Z (Gaussianised T/F) statistic images were thresholded at P=0.05 (one-tailed, uncorrected). All thresholded images (minimum cluster size >30 voxels) were then divided by anatomical regions using the Talairach Daemon database (Lancaster, 2000). The mean percent signal change for each cluster was extracted and subjected to further offline statistical analysis.
Results
Gaze Discrimination Performance
Recognition rates (percent correct±SEM) were 73.2±13.3 in patients and 74.2±12.5 in controls for faces at 0° gaze deviation, 42.2±12.6 in patients and 26.8±9.5 in controls for faces at 4° gaze deviation, and 55.7±14.1 in patients and 84.2±9.3 in controls for faces at 8° gaze deviation. For percent correct scores, there was a main effect of gaze deviation (0, 4, 8°) [F (2, 34) = 6.33, p = 0.005], but not of diagnosis [F (1, 17) = 0.46, p = 0.505]. There were no effects of diagnosis or gaze deviation on response time [F (1, 17) = 0.21, p = 0.661, F (2, 34) = 2.16, p = 0.147]. As anticipated, post hoc analysis revealed better performance for the 0° than the 4° deviation, and performance for 4° was worse than for 8° deviation. There was no group x deviation interaction. Rates of no response did not differ across groups.
fMRI
A group main effect between patients and controls for activation across all degrees of gaze deviation compared to baseline condition was observed in the following brain regions, ranked by cluster size (Table 1)(Figure2) and location: bilateral inferior frontal, right amygdala, parahippocampal gyrus, putamen and thalamus, left globus pallidus and claustrum, bilateral fusiform, right lingual and bilateral occipital gyri. Inspection of the scaled beta coefficients revealed attenuated - or lesser - activation during gaze discrimination compared to baseline for schizophrenia patients in all regions. No main effect for gaze deviation or interaction was observed across groups. Activation differences between groups are outlined below (Table 1 and Figure 2). Within groups, we performed separate exploratory voxelwise ANOVAs to test the effect of gaze on brain activation. In controls, clusters of voxels exceeded threshold in the superior frontal gyrus (bilateral), right middle frontal gyrus, right hippocampus and left middle temporal gyrus. Overall, the mean percent signal change for these clusters showed a pattern of increased activation for 4° deviation, compared to 0° or 8° deviation, particularly in the middle temporal gyrus (post hoc LSD p = .007, see Figure 3). In patients, clusters of voxels exceeded threshold in the superior temporal gyrus (bilateral), left amygdala, right middle temporal gyrus, left parahippocampal and transverse temporal gyrus. For this group, the mean percent signal showed a pattern of increased activation for 0° deviation (direct gaze) condition (Figure 4). This was significantly greater the 0° compared to 8° condition in the left superior temporal gyrus (post hoc LSD p = .016), right superior temporal gyrus (post hoc LSD p = .001), left amygdala (post hoc LSD p = .019), and left transverse temporal gyrus (post hoc LSD p = .020).
Table 1.
Cluster Location and Local Maxima of BOLD Signal Change for Group Main Effect
| Region (Brodmann Area)a | Size | HEMb | Z-MAXc | X (mm) | Y (mm) | Z (mm) |
|---|---|---|---|---|---|---|
| Inferior Frontal Gyrus (BA 45) | 352 | R | 6.33 | 50 | 18 | 2 |
| Fusiform Gyrus (BA 37) | 263 | R | 6.73 | 36 | -62 | -18 |
| Medial Globus Pallidus | 170 | L | 5.74 | -10 | 0 | 0 |
| Lingual Gyrus (BA 18) | 161 | R | 6.69 | 16 | -84 | -6 |
| Putamen | 117 | R | 5.28 | 16 | 8 | -10 |
| Fusiform Gyrus (BA 20) | 83 | L | 5.73 | -32 | -36 | -18 |
| Inferior Frontal Gyrus (BA 47) | 69 | L | 5.73 | -26 | 10 | -16 |
| Parahippocampal Gyrus (BA 30) | 57 | R | 5.23 | 6 | -36 | -4 |
| Thalamus | 53 | R | 5.34 | 4 | -26 | 0 |
| Amygdala | 44 | R | 5.40 | 20 | -2 | -16 |
| Inferior Occipital Gyrus (BA 18) | 33 | R | 5.26 | 30 | -90 | -6 |
| Inferior Occipital Gyrus (BA 18) | 32 | R | 5.17 | 44 | -84 | -8 |
| Claustrum | 30 | L | 4.85 | -34 | 12 | 0 |
Regions exceeding a probability threshold p≤0.05, corrected and minimum cluster size ≥30 voxels. Estimated Brodmann’s areas and coordinates from Talairach and Tournoux (1988)
HEM = cerebral hemisphere
Z-MAX values represent peak activation for cluster
Figure 2.

Group Main Effect a for Brain Activation during Gaze Discrimination
Figure 3.
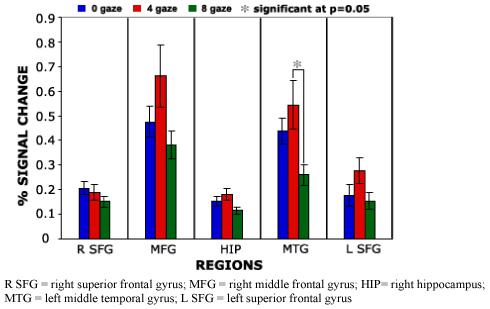
Controls group mean percent signal change for region by gaze condition.
Figure 4.

Patient group mean percent signal change for region by gaze condition.
Conclusions
Despite similar gaze discrimination performance, persons with stable schizophrenia exhibited decreased brain activation during gaze discrimination in frontal, temporal, occipito-parietal and subcortical areas that are associated with executive functioning, emotional and visual processing. The baseline condition representing a cross-hair superimposed on a scrambled face, in conjunction with the task command, was designed to produce activation findings related to certain features of the face, specifically the eyes. Within the context of the gaze discrimination task, activation differences indicate altered integration of socially relevant information, including face processing, and aspects of social cognition and emotion experience, in schizophrenia. Fusiform areas are instrumental in face processing, in particular when faces are presented in forward condition, which is considered socially more relevant. In addition, the right fusiform gyrus may be more responsive to whole faces and the left to face details (Rossion et al 2000). Amygdala activation may relate to aspects of emotional processing during gaze discrimination (Kawashima et al 1999), in particular to isolated eye features (Whalen et al 2004), or to attempts to search for and establish direct eye contact (Hooker et al 2003). Frontal lobe activation may relate to decision-making and aspects of attribution of mental states or theory of mind mechanisms (Frith and Frith 2003, Siegal and Varley 2002) that play a role when faces are analyzed regarding information and meaning. Striatal and thalamic activations are less readily explained, although facial attractiveness can produce ventral striatum activation (Kampe et al 2001). Amongst other brain regions, a large body of research has implicated both function (Onitsuka et al 2006, Gur 2007) and structure (Davatsikos 2005, Onitsuka et al 2006, Crespo Faccoro 2007) of these areas in schizophrenia. Within group comparison regarding the effects of gaze direction revealed different findings in controls and patients. Controls exhibited increased activation associated with 4° deviation in frontal and temporal regions, perhaps mirroring the increased cognitive demand of the more difficult condition. Patients, on the other hand, exhibited increased activation associated with direct gaze in temporal regions, in particular regions instrumental in processing of direct gaze and fear.
Potential limitations of our study involve choice of stimuli, sample size, clinical characteristics, and lack of exploration of possible gaze activation by group interactions and relationships between brain activation, performance and clinical symptoms. The choice of faces with direct gaze that undergo horizontal rotation was similar to the previous study by Rosse et al. (1994). This design is more naturalistic, compared to faces in full frontal orientation with eyes rotated, and supported by findings that frontal eye fields coordinate parallel head and eye shifts (Chen 2006). Nevertheless, head rotation of the stimuli may have affected task performance and we attempted to limit possible attention to extraocular regions by asking probands to pay specific attention to the eyes. Based on the simplistic task design and small sample size, there was insufficient statistical power to find a possible gaze direction by group interaction. Similarly, due to sample size and overall clinical stability of patients, relationships with clinical symptoms were not further pursued in this data set and remain to be explored in a future project aimed at more specific examination of these issues.
The eyes, termed by Immanuel Kant as “windows to the soul”, communicate information about the internal state of the person, commonly involving emotional content, and the environment. More recently, eyes have been described as instrumental (Calder et al 2002) in the concept of Theory of Mind, defined as the ability to ascribe mental states, such as thoughts, emotions and intentions, to self and others (Premack and Woodruff 1978). Isolated eye whites of fearful faces produce amygdala activation (Whalen et al 2004) and in a person with bilateral amygdala damage inability to visually fixate on the eyes produced impaired fear recognition (Adolphs et al 2005), which improved with explicit instructions.
Depending on the emotional expression, direction of gaze can have a specific communicatory effect, e.g. the expression of fear and direct gaze or eye contact will signal fear from the observer, whereas gaze direction aimed away from the observer will signal external danger. Until now, studies on emotion identification have presented the whole face in full frontal view and mostly with direct gaze. For persons with schizophrenia and poor eye contact, this communicatory effect of gaze may differ from the effect in healthy persons and may contribute to misinterpretation of the target emotion or even non-emotional faces, relating to paranoia and ideas of reference. This concept is partly supported by findings in a person with Capgras syndrome, characterized by misidentification of familiar persons as imposters, where failure to identify gaze was associated with failed recognition of the face (Hirstein and Ramachandran 1997). While our study did not examine the possible relationship between gaze discrimination and clinical symptoms, direct eye contact may relate to positive symptoms of schizophrenia, such as ideas of reference and paranoia.
As in the recent studies in Fragile X (Garrett et al 2004) and Williams syndrome (Mobbs et al 2004), we did not find a selective effect of direct gaze on brain activation. Future studies in schizophrenia employing more subtle degrees of gaze deviation, including non-emotional and emotional faces, larger number of stimuli and patient groups with wider range of positive and negative symptoms can better explore issues regarding potential relationship with acute symptoms of psychosis.
Table 2.
Cluster Location and Local Maxima of BOLD Signal Change for Control group voxelwise ANOVA
| Region (Brodmann Area)a | Size | HEMb | Z-MAXc | X (mm) | Y (mm) | Z (mm) |
|---|---|---|---|---|---|---|
| Superior Frontal Gyrus (BA 10) | 92 | R | 2.74 | 12 | 54 | -10 |
| Middle Frontal Gyrus (BA 10) | 46 | R | 2.74 | 46 | 56 | -8 |
| Hippocampus | 40 | R | 2.6 | 32 | -32 | -2 |
| Middle Temporal Gyrus (BA 21) | 32 | L | 2.93 | -64 | 2 | -12 |
| Superior Frontal Gyrus (BA 11) | 31 | L | 2.14 | -12 | 54 | -18 |
Regions exceeding a probability threshold p≤0.05, corrected and minimum cluster size ≥30 voxels. Estimated Brodmann’s areas and coordinates from Talairach and Tournoux (1988)
HEM = cerebral hemisphere
Z-MAX values represent peak activation for cluster
Table 3.
Cluster Location and Local Maxima of BOLD Signal Change for Patient group voxelwise ANOVA
| Region (Brodmann Area)a | Size | HEMb | Z-MAXc | X (mm) | Y (mm) | Z (mm) |
|---|---|---|---|---|---|---|
| Amygdala | 198 | L | 2.64 | -24 | -8 | -12 |
| Superior Temporal Gyrus (BA 22) | 169 | L | 2.91 | -56 | -12 | 4 |
| Middle Temporal Gyrus (BA 21) | 68 | R | 2.32 | 54 | -8 | -12 |
| Superior Temporal Gyrus (BA 22) | 56 | R | 2.32 | 52 | -14 | 4 |
| Parahippocampal Gyrus (BA 36) | 42 | L | 2.25 | -38 | -34 | -8 |
| Transverse Temporal Gyrus (BA 41) | 30 | L | 2.16 | -30 | -30 | 6 |
Regions exceeding a probability threshold p≤0.05, uncorrected and minimum cluster size ≥30 voxels. Estimated Brodmann’s areas and coordinates from Talairach and Tournoux (1988)
HEM = cerebral hemisphere
Z-MAX values represent peak activation for cluster
Acknowledgments
This work was supported by NIMH MH-01839, MH-60722, MH-64045 and MO1RR0040. The funding sources had no role in design of study, interpretation of data, manuscript preparation and submission.
Footnotes
Publisher's Disclaimer: This is a PDF file of an unedited manuscript that has been accepted for publication. As a service to our customers we are providing this early version of the manuscript. The manuscript will undergo copyediting, typesetting, and review of the resulting proof before it is published in its final citable form. Please note that during the production process errors may be discovered which could affect the content, and all legal disclaimers that apply to the journal pertain.
References
- Adolphs R, Gosselin F, Buchanan TW, Tranel D, Schyns P, Damasio AR. A mechanism for impaired fear recognition after amygdala damage. Nature. 2005;433:68–72. doi: 10.1038/nature03086. [DOI] [PubMed] [Google Scholar]
- Allison T, Ginter H, McCarthy G, Nobre AC, Puce A, Luby M, Spencer DD. Face recognition in human extrastriate cortex. J Neurophysiol. 1994;71:821–825. doi: 10.1152/jn.1994.71.2.821. [DOI] [PubMed] [Google Scholar]
- Andreasen NC. The Scale for the Assessment of Positive Symptoms (SAPS) The University of Iowa; Iowa City: 1984a. [Google Scholar]
- Andreasen NC. The Scale for the Assessment of Negative Symptoms (SANS) The University of Iowa; Iowa City: 1984b. [Google Scholar]
- Bandettini PA, Wong EC, Hinks RS, Tikofsky RS, Hyde JS. Time course EPI of human brain function during task activation. Magn Reson Med. 1992;25:390–397. doi: 10.1002/mrm.1910250220. [DOI] [PubMed] [Google Scholar]
- Baron-Cohen S. Mindblindedness. MIT Press; Cambridge MA: 1995. 1995. [Google Scholar]
- Campbell R, Heywood CA, Cowey A, Regard M, Landis T. Sensitivity to eye gaze in prosopagnosic patients and monkeys with superior temporal sulcus ablation. Neuropsychologia. 1999;28:1123–1142. doi: 10.1016/0028-3932(90)90050-x. [DOI] [PubMed] [Google Scholar]
- Calder AJ, Lawrence AD, Keane J, Scott SK, Owen AM, Christoffels I, Young AW. Reading the mind from eye gaze. Neuropsychologia. 2002;40:1129–38. doi: 10.1016/s0028-3932(02)00008-8. [DOI] [PubMed] [Google Scholar]
- Chen LL. Head movements evoked by electrical stimulation in the frontal eye field of the monkey: evidence for independent eye and head control. Journal of Neurophysiology. 2006;95:3528–42. doi: 10.1152/jn.01320.2005. [DOI] [PubMed] [Google Scholar]
- Clark VP, Keil K, Maisog JM, Courtney S, Ungerleider LG, Haxby JV. Functional magnetic resonance imaging of human visual cortex during face matching: a comparison with positron emission tomography. Neuroimage. 1996;4:1–15. doi: 10.1006/nimg.1996.0025. [DOI] [PubMed] [Google Scholar]
- Franck N, Daprati E, Michel F, Saoud M, Dalery J, Marie-Cardine M, Georgieff N. Gaze discrimination is unimpaired in schizophrenia. Psychiatry Res. 1998;81:67–75. doi: 10.1016/s0165-1781(98)00082-1. [DOI] [PubMed] [Google Scholar]
- Franck N, Montoute T, Labruyere N, Tiberghien G, Marie-Cardine M, Dalery J, et al. Gaze direction determination in schizophrenia. Schizophr Res. 2002;56:225–34. doi: 10.1016/s0920-9964(01)00263-8. [DOI] [PubMed] [Google Scholar]
- Frith U, Frith CD. Development and neurophysiology of mentalizing. Philos Trans R Soc Lond B Biol Sci. 2003;358:459–73. doi: 10.1098/rstb.2002.1218. [DOI] [PMC free article] [PubMed] [Google Scholar]
- Garrett AS, Menon V, MacKenzie K, Reiss AL. Here’s looking at you, kid: neural systems underlying face and gaze processing in fragile X syndrome. Arch Gen Psychiatry. 2004;61:281–288. doi: 10.1001/archpsyc.61.3.281. [DOI] [PubMed] [Google Scholar]
- Gur RE, Mozley PD, Resnick SM, Levick S, Erwin R, Saykin AJ, Gur RC. Relations among clinical scales in schizophrenia. Am J Psychiatry. 1991;148:472–8. doi: 10.1176/ajp.148.4.472. [DOI] [PubMed] [Google Scholar]
- Gur RE, Pearlson GD. Neuroimaging in schizophrenia research. Schizophr Bull. 1993;19:337–353. doi: 10.1093/schbul/19.2.337. [DOI] [PubMed] [Google Scholar]
- Hirstein W, Ramachandran VS. Capgras syndrome: a novel probe for understanding the neural representation of the identity and familiarity of persons. Proc Biol Sci. 1997;264:437–44. doi: 10.1098/rspb.1997.0062. [DOI] [PMC free article] [PubMed] [Google Scholar]
- Hoffman EA, Haxby JV. Distinct representations of eye gaze and identity in the distributed human neural system for face perception. Nature Neuroscience. 2000;3:80–84. doi: 10.1038/71152. [DOI] [PubMed] [Google Scholar]
- Hooker CI, Paller KA, Gitelman DR, Parrish TB, Mesulam MM, Reber PJ. Brain networks for analyzing eye gaze. Brain Res Cogn Brain Res. 2003;17:406–18. doi: 10.1016/s0926-6410(03)00143-5. [DOI] [PMC free article] [PubMed] [Google Scholar]
- Hooker C, Park S. You must be looking at me: the nature of gaze perception in schizophrenia. Cognit Neuropsychiatry. 2005;10:327–45. doi: 10.1080/13546800444000083. [DOI] [PubMed] [Google Scholar]
- Jenkinson M, Smith S. A global optimization method for robust affine registration of brain images. Med Image Anal. 2001;5:143–156. doi: 10.1016/s1361-8415(01)00036-6. [DOI] [PubMed] [Google Scholar]
- Kampe KKW, Frith CD, Dolan RJ, Frith U. Reward value of attractiveness and gaze. Nature. 2001;413:589–590. doi: 10.1038/35098149. [DOI] [PubMed] [Google Scholar]
- Kanwisher N, McDermott J, Chun MM. The fusiform face area. J Neurosci. 1997;17:4302–4311. doi: 10.1523/JNEUROSCI.17-11-04302.1997. [DOI] [PMC free article] [PubMed] [Google Scholar]
- Kawashima R, Sugiura M, Kato T, Nakamura A, Hatano K, Ito K, et al. The human amygdala plays an important role in gaze monitoring—a PET study. Brain. 1999;122:779–783. doi: 10.1093/brain/122.4.779. [DOI] [PubMed] [Google Scholar]
- Kleinke CL. Gaze and eye contact: A research review. Psychol Bull. 1986;100:78–100. [PubMed] [Google Scholar]
- Lancaster JL, Woldorff MG, Parsons LM, Liotti M, Freitas CS, Rainey L, et al. Automated Talairach atlas labels for functional brain mapping. Hum Brain Mapp. 2000;10:120–31. doi: 10.1002/1097-0193(200007)10:3<120::AID-HBM30>3.0.CO;2-8. [DOI] [PMC free article] [PubMed] [Google Scholar]
- McCarley RW, Shenton ME, O’Donnell BF, Faux SF, Kikinis R, Nestor PG, Jolesz FA. Auditory P300 abnormalities and left posterior superior temporal gyrus volume reduction in schizophrenia. Arch Gen Psychiatry. 1993;50:190–197. doi: 10.1001/archpsyc.1993.01820150036003. [DOI] [PubMed] [Google Scholar]
- Mobbs D, Garrett AS, Menon V, Rose FE, Bellugi U, Reiss AL. Anomalous brain activation during face and gaze processing in Williams syndrome. Neurology. 2004;62:2070–6. doi: 10.1212/01.wnl.0000129536.95274.dc. [DOI] [PubMed] [Google Scholar]
- Perrett DI, Hietanen JK, Oram MW, Benson PJ. Organization and functions of cells responsive to faces in the temporal cortex. Philos Trans R Soc Lond B Biol Sci. 1992;335:23–30. doi: 10.1098/rstb.1992.0003. [DOI] [PubMed] [Google Scholar]
- Pitman RK, Kolb B, Orr SP, Singh MM. Ethological study of facial behavior in nonparanoid and paranoid schizophrenic patients. Am J Psychiatry. 1987;144:99–102. doi: 10.1176/ajp.144.1.99. [DOI] [PubMed] [Google Scholar]
- Premack D, Woodruff G. Does the chimpanzee have a “theory of mind?”. Behav Brain Sci. 1978;4:515–526. [Google Scholar]
- Rosse RB, Kendrick K, Wyatt RJ, Isaac A, Deutsch SI. Gaze discrimination in patients with schizophrenia: Preliminary report. Am J Psychiatry. 1994;151:919–21. doi: 10.1176/ajp.151.6.919. [DOI] [PubMed] [Google Scholar]
- Rossion B, Dricot L, Devolder A, Bodart JM, Crommelinck M, De Gelder B, Zoontjes R. Hemispheric asymmetries for whole-based and part-based face processing in the human fusiform gyrus. J Cogn Neurosci. 2000;12:793–802. doi: 10.1162/089892900562606. [DOI] [PubMed] [Google Scholar]
- Shtasel DL, Gur RE, Mozley PD, Richards J, Taleff MM, Heimberg C, et al. Volunteers for biomedical research. Recruitment and screening of normal controls. Arch Gen Psychiatry. 1991;48:1022–5. doi: 10.1001/archpsyc.1991.01810350062010. [DOI] [PubMed] [Google Scholar]
- Siegal M, Varley R. Neural systems involved in ‘theory of mind’. Nat Rev Neurosci. 2002;3:463–71. doi: 10.1038/nrn844. [DOI] [PubMed] [Google Scholar]
- Smith SM. Fast robust automated brain extraction. Hum Brain Mapp. 2002;17:143–155. doi: 10.1002/hbm.10062. [DOI] [PMC free article] [PubMed] [Google Scholar]
- Talairach J, Tournoux P. 3-dimensional proportional system: an approach to cerebral imaging. Thieme Medical Publishers; New York: 1988. Co-planar stereotaxic atlas of the human brain. [Google Scholar]
- Walker EF, Grimes KE, Davis DM, Smith AJ. Childhood precursors of schizophrenia: facial expressions of emotion. Am J Psychiatry. 1993;150:1654–1660. doi: 10.1176/ajp.150.11.1654. [DOI] [PubMed] [Google Scholar]
- Watt NF. Patterns of childhood social development in adult schizophrenics. Arch Gen Psychiatry. 1978;36:160–165. doi: 10.1001/archpsyc.1978.01770260038003. [DOI] [PubMed] [Google Scholar]
- Whalen PJ, Kagan J, Cook RG, Davis FC, Kim H, Polis S, et al. Human amygdala responsivity to masked fearful eye whites. Science. 2004;306:2061. doi: 10.1126/science.1103617. [DOI] [PubMed] [Google Scholar]
- Wicker B, Michel F, Henaff MA, Decety J. Brain regions involved in the perception of gaze: a PET study. Neuroimage. 1998;8:221–227. doi: 10.1006/nimg.1998.0357. [DOI] [PubMed] [Google Scholar]
- Woolrich MW, Ripley BD, Brady M, Smith SM. Temporal autocorrelation in univariate linear modeling of FMRI data. Neuroimage. 2001;14:1370–1386. doi: 10.1006/nimg.2001.0931. [DOI] [PubMed] [Google Scholar]
- Zipursky RB, Marsh L, Lim KO, DeMent S, Shear PK, Sullivan EV, et al. Volumetric MRI assessment of temporal lobe structures in schizophrenia. Biol Psychiatry. 1994;35:501–516. doi: 10.1016/0006-3223(94)90097-3. [DOI] [PubMed] [Google Scholar]