

Abstract
Objective:
To investigate the relationship between sleep duration and adiposity measurements in rural Chinese adolescents.
Methods:
This report is based on a cross-sectional analysis of 500 Chinese adolescent twins. Anthropometric measurements and direct adiposity measurements using dual-energy X-ray absorptiometry (DEXA) were taken for all subjects. Standard sleep questionnaires and a 7-day diary were administered to assess sleep duration.
Results:
Sleep duration decreased with increasing age during adolescence, reaching a nadir at approximately 15 years of age. While BMI and body fat increased through the entire range of adolescence for both genders, after the age of 12, females had much higher amounts of total and truncal fat than males. Graphic plots showed that among females, both long and short sleepers tended to have higher adiposity measures than medium duration sleepers. The association of short sleep duration with higher adiposity measures was significant even after adjustment for covariates. This association was stronger for total and truncal fat and waist circumference (P <0.05) than for BMI (P = 0.06). In contrast, consistent relationships between sleep duration and adiposity measures were not seen in males.
Conclusion:
Even in this relatively lean Chinese adolescent cohort, short sleep duration was significantly associated with higher adiposity measures and lower lean body mass in females. The results of this study indicate that the observed association between short sleep duration and higher BMI is most likely mediated by factors associated with total and central adiposity rather than lean body mass.
Citation:
Yu Y; Lu BS; Wang B; Wang H; Yang J. Short sleep duration and adiposity in chinese adolescents. SLEEP 2007;30(12):1688-1697.
Keywords: Sleep duration, adiposity, body fat, adolescent, puberty, physical activity
INTRODUCTION
OBESITY IN THE UNITES STATES AND OTHER INDUSTRIALIZED COUNTRIES HAS REACHED EPIDEMIC PROPORTIONS IN BOTH ADULTS AND CHILDREN. Between 1991 and 2001, the prevalence of obese American adults increased from 12% to 20.9%, and the number continues to rise.1 Of even greater public health concern is the rapid rise in the number of overweight or obese children. Along with smoking and alcohol, obesity is considered a leading cause of preventable death in the United States. Although poor diet and physical inactivity are well established causes of obesity, recent evidence indicates an intriguing but poorly understood relationship between sleep duration and obesity.2,3
Despite the mounting evidence that adequate sleep is important for overall health, sleep curtailment is pervasive in modern society, and the average sleep duration in adults has declined from 8.5 hr/night to <7 hr/night over the last 40 years.4,5 Emerging evidence suggests an important and consistent relationship between short sleep duration and obesity.2,3 However, cause-and-effect relationships and underlying biological mechanisms that link these associations have not been established. Most studies on the association between short sleep duration and obesity have focused on adults and young children,6,7 with much less work being directed at adolescents,8 commonly defined as the age period of 10 to 19 years.9 A compelling rationale to study adolescents is that they represent a population at particular risk for both obesity and sleep deprivation.
The causes of sleep deprivation in adolescents range from biological factors, such as changes in circadian timing to increased social and educational demands.10 The need for sleep, however, does not diminish in adolescence, and is estimated to be on average 8.50 to 9.25 hr of sleep per night.10 Yet, a recent national survey in the U.S. indicates that 45% of adolescents get <8 hr sleep on school nights, while 78% report that they need ≥8 hr sleep to feel their best.11 Adolescence is associated with marked physical growth, functional development, and endocrine changes. It is well recognized that adolescence is a critical period for the development of obesity, and adolescent obesity, in turn, is a strong predictor of obesity in adulthood (OR = 17.5).12 Adolescence is also a period during which gender differences in growth, development, and body composition widen.13 During puberty, males experience rapid increases in lean muscle and decreases in fat mass due to increases in testosterone, growth hormone, and insulinlike growth factor-1 levels. Females, on the other hand, undergo rapid increases in fat mass that are largely due to higher levels of estradiol.14 Therefore, the risk of becoming overweight during adolescence tends to be higher among females than males (although this may vary with ethnicity). Data from the NHANES III indicated that females who matured earlier had higher rates of overweight and obesity, while the opposite was true for males.15 In this study, we assessed the effects of gender and stage of sexual development on the relationship between sleep duration and adiposity in adolescence, a time when early intervention could lead to prevention of disease and long term improvements in health and well-being.
Most studies linking the relationship between sleep duration and weight have used BMI. While BMI is a surrogate measure of adiposity and is correlated with measures of total and central adiposity (i.e., total and percent body fat, waist circumference), it is also influenced by lean mass and bone mass. Since BMI changes significantly with age and gender, it may not be an accurate or comparable measure of adiposity across age groups or gender.16,17 Therefore, more direct measures of adiposity will help us gain a better understanding of the biological mechanisms underlying the sleep-adiposity relationship. This study is the first to investigate the sleep-adiposity relationships in Chinese adolescents using direct adiposity measurements. We were particularly interested in whether the association between sleep duration and adiposity also exists in a relatively lean Chinese population and the influence of gender and physical activity level on this relationship.
METHODS
Study Population
The study population consists of 500 twins aged 10 to 20 years who were first recruited between 1998 and 2000 and are now enrolled as part of an ongoing NIH-funded prospective study on precursors of metabolic syndrome in children. The recruitment of the twins was carried out in the Anqing region of Anhui Province, China. Anqing, spanning 80 km along the north bank of the Yangtze River, has 3 urban areas and 8 rural counties covering 15,000 km2. The climate is mild, with an average year-round temperature of about 15°C. The population size was approximately 6 million in 1992. Anqing has been the site of numerous epidemiologic studies on environmental and genetic etiologies of chronic diseases in China, which have allowed for validation of the methods (e.g., interviewing scheme and anthropometric measurement) used in this study.18
The recruitment of twins was carried out in eight counties of the Anqing region. Medical care in each county of Anqing is administered through a 3-tier (county, township, and village) service network. At the baseline survey, twins were identified through a multistage process. First, investigators from the Anhui Medical University and the Anqing Hospitals/Research Institutes held a 3-day workshop in each township to train local doctors and to collect twin information. The first day was used to explain the purpose, scope, and procedures of the study. Epidemiologists from Anhui Medical University checked all twin lists with the township/village doctors. For the ongoing follow-up study, eligible twins met the following criteria: (1) both twins participated in the baseline survey in 1998–2000; (2) both twins agreed and consented to participate in the current study. Eligible twins were invited to a central office to complete a questionnaire interview and a clinical evaluation on key components of the metabolic syndrome. The study protocol was approved by the Institutional Review Boards of Children's Memorial Hospital and the Institute of Biomedicine, Anhui Medical University in Hefei, China. A detailed description on the data collection of the relevant variables for this report is provided below.
Anthropometric Measurements
Height and weight were measured using standard protocols, without shoes or outerwear. Height was measured to the nearest 0.1 cm on a portable stadiometer. Weight was measured to the nearest 0.1 kg with the subjects standing motionless on a scale. A waist circumference measurement was taken at the level of the umbilicus to the nearest centimeter. Hip circumference measurement was taken at the maximum circumference of the buttocks with the subject in a relaxed standing posture. All anthropometric values consisted of the mean of three measures. BMI was calculated as weight (kg)/height squared (m2). In addition, Tanner stage (I to V) was determined based on visual inspection.19,20
Body Fat Measurements
Dual energy x-ray absorptiometry (DEXA) measures the exponential attenuation of photons emitted at two energy levels that are absorbed by various body tissues. This allows for an accurate measurement of fat, fat-free, and bone substance.21 A standard whole body DEXA scan includes total body and three regional fat measures: trunk (chest, abdomen, and pelvis), arms, and legs. DEXA measures of body fat have been validated against other estimates, including underwater weighing,22 skinfold measures, bioelectrical impedance analysis, and deuterium oxide dilution.23 This study used a Lunar DPXL instrument (Madison, WI, USA) that was set up and calibrated in Anqing by the manufacturer. A standard software calculation was used to calculate total body fat.21 Percent body fat was calculated as total body fat divided by body weight.
Physical Activity
This study adopted the short version of the international physical activity questionnaire (IPAQ-Short) (http://www.ipaq.ki.se). The IPAQ-Short consists of 7 items that ask information about 3 types of physical activity (walking, moderate activity, and vigorous activity) across various physical activity domains (i.e., leisure time, occupational, domestic, and transport), using the “last 7 days” as a reference period. This information provides separate scores on each type of activity as well as a combined total physical activity score that is obtained by summing the frequency (days) and duration (in minutes) of all undertaken activities. In addition, weighting each type of activity by its metabolic equivalent (MET) level (METs are multiples of the basal metabolic rate) produces a score in MET minutes (MET-min), providing another measure of volume of activity (i.e., walking = 3.3 METs; moderate physical activity = 4 METs; vigorous physical activity = 8 METs). Finally, using both the total volume of activity and the number of activity days/sessions per week, the IPAQ generates a categorical indicator (Low, Moderate, and High) of regular physical activity.
To be considered within the “High” physical activity level, one of following criteria must be met:
vigorous-intensity activity on ≥3 days achieving a minimum total physical activity of ≥1500 MET-min/week.
≥7 days of any combination of walking, moderate-intensity or vigorous-intensity activities, achieving a minimum total physical activity of '3000 MET-min/week.
To be considered within the “Moderate” physical activity level, one of the following criteria must be met:
≥3 days of vigorous-intensity activity of ≥20 min/day.
≥5 days of moderate-intensity activity and/or walking of at least ≥30 min/day.
≥5 days of any combination of walking, moderate-intensity, or vigorous intensity activities achieving a minimum total physical activity '600 MET-min/week.
Those individuals who did not meet criteria for High or Moderate physical activity were considered to have a “Low” physical activity level.
Measurement of Sleep Duration
Sleep duration was assessed by questionnaires and a 7-day diary, from which measures of sleep duration, sleep quality, and daytime sleepiness were determined. For children 18 years or younger, the Pediatric Sleep Questionnaire (PSQ) was used. PSQ contains scales to assess the presence and severity of sleep disordered breathing, snoring, excessive daytime sleepiness, and behavioral problems. Its validity and reliability have been demonstrated in children and adolescents ages 2–18 years old.24 To determine usual sleep duration, the question, “How many hours of sleep does this child usually get?” was also asked. The PSQ was first translated into Chinese by an investigator on the study team. It was then back-translated by another investigator not involved in the study, and finally administered to the cohort by the trained research staff. Each study subject completed the questionnaire with parental assistance. For subjects >18 years of age, a Chinese version of the Pittsburgh Sleep Quality Index (PSQI) was used to assess the individuals' sleeping habits and hypnotic use as well as for the presence of insomnia in the last month.25 Sleeping habits measured include bedtime, wake-up time, total sleep time, and sleep latency. The Chinese version of the PSQI has been used previously with proven excellent sensitivity and reliability.25,26 On the sleep diary, all subjects were asked to record bedtime, wake-up time, total sleep time, sleep latency, wake time after sleep onset (WASO), naps, any notable events that may affect their sleep, and rating of overall sleep quality. The key sleep variable of interest was total sleep duration which was determined by a single recalled number from sleep questionnaires or calculated based on the sleep diary (defined as the period from sleep onset to the final awakening minus the time spent awake during the sleep period). Five weekdays recorded in the sleep diary were averaged to obtain the mean sleep duration.
In general, sleep duration from sleep questionnaires was consistent with that obtained from the sleep diary (for PSQ, r = 0.47, P <0.01; for PSQI, r = 0.42, P <0.01). However, complete data from sleep diary were obtained from 490 subjects and some subjects maintained a diary for only 2 weekdays. Because of this limitation and the higher likelihood that the data from the sleep questionnaires are more likely to reflect long-term sleep patterns, analyses are based on sleep duration from the questionnaire data.
Major Covariates
Since this is a homogeneous population in terms of ethnicity, neighborhood environment, lifestyle, and social economic status, covariates considered in the data analyses were age, gender, Tanner stage, and physical activity level.
Statistical Methods
The central focus of the analysis was to examine the relationship between sleep duration and adiposity measurements among male and female adolescents. Sleep duration was divided into 3 categories (<8 hr, 8–8.9 hr, and ≥9 hr) to ensure approximately equal sample size in each category. Previous studies have indicated that most of adolescents sleep about 8 hr/night.11,27 The crude relationships between sleep duration and BMI and adiposity measurements were first explored using graphic plots. The crude relationships were further assessed by multiple linear regression analysis with adjustment for age, Tanner stage, and physical activity. All the analyses were stratified by gender. In addition to analyzing adiposity variables in the original scales, we also converted all the adiposity and lean body mass variables into standardized z-scores (calculated as [observed value-age and gender specific mean]/age and gender specific standard deviation). Age- and gender-specific normative values were based on an independent dataset of adolescents (1175 males and 1837 females) from the same region as the study population. Z-scores permit direct comparison of the magnitude of associations between sleep duration and various adiposity and lean body mass variables. In this report, the twins were treated as individual observations rather than as twin pairs. Because within twin-pair measures tend to be correlated, standard errors obtained from unmatched analysis may be artificially deflated. To account for this effect, we calculated robust estimates of the variances using the generalized estimating equation (GEE) implemented in the Procedure Genmod in SAS (SAS Institute Inc., Cary, NC, USA).
RESULTS
This report included 500 twins (273 males and 227 females). Table 1 provides summary statistics of the key variables, including sleep duration, age, physical activity, and Tanner stage separated by gender and grouped by sleep duration: short (<8 hr/night), medium (8–8.9 hr/night), and long (≥9 hr/night). The mean BMI for the entire cohort was 18 ± 2.4 kg/m2. Table 2 categorizes the participants by BMI class using cut-offs based on a large population sample from the same area. Most of the study participants are normal weight if classified by their BMI and only a small percentage (11.4% males and 5.7% females) are overweight or obese.
Table 1.
Description of Relevant Variables among Chinese Children Aged 10~20 Years
| Variable | Sleep Duration <8 h |
Sleep Duration 8~8.9 h |
Sleep Duration ≥9 h |
||||
|---|---|---|---|---|---|---|---|
| N | Mean ± SD | N | Mean ± SD | N | Mean ± SD | ||
| Sleep Duration, hr | |||||||
| Males | 92 | 6.7 ± 0.6 | 82 | 8.1 ± 0.2 | 99 | 9.5 ± 0.8 | |
| Females | 80 | 6.8 ± 0.6 | 79 | 8.0 ± 0.1 | 68 | 9.5 ± 0.8 | |
| Age, year | |||||||
| Males | 92 | 15.9 ± 1.6 | 82 | 15.2 ± 1.8 | 99 | 14.0 ± 1.9 | |
| Females | 80 | 15.4 ± 1.6 | 79 | 15.0 ± 1.5 | 68 | 14.5 ± 2.0 | |
| N (%) |
|||||||
| Physical Activity1 | |||||||
| Low | Males | 43(46.7) | 40(48.8) | 61(61.6) | |||
| Females | 53(66.3) | 45(57.0) | 42(61.8) | ||||
| Moderate | Males | 22(23.9) | 18(22.0) | 20(20.2) | |||
| Females | 21(26.3) | 23(29.1) | 15(22.1) | ||||
| High | Males | 27(29.3) | 24(29.3) | 18(18.2) | |||
| Females | 6(7.5) | 11(13.9) | 11(16.2) | ||||
| Tanner Stages | |||||||
| I + II | Males | 26(28.3) | 41(50.0) | 60(60.6) | |||
| Females | 18(22.5) | 25(31.6) | 33(48.5) | ||||
| III | Males | 24(26.1) | 20(24.4) | 22(22.2) | |||
| Females | 28(35.0) | 34(43.0) | 23(33.8) | ||||
| IV + V | Males | 42(45.7) | 21(25.6) | 17(17.2) | |||
| Females | 34(42.5) | 20(25.3) | 12(17.6) | ||||
Physical Activity was derived from the short version of the International Physical Activity Questionnaire.
# % lean body mass = 100*(lean body mass)/weight;
Table 2.
The Obesity or Overweight Distribution in the Study Population
| BMI class* | Males | Females |
|---|---|---|
| Underweight | 33(12.1) | 15(6.6) |
| Normal weight | 209(76.6) | 199(87.7) |
| Overweight | 22(8.1) | 6(2.6) |
| Obesity | 9(3.3) | 7(3.1) |
BMI class, generated gender- and age-specific 5%, 85%, and 95% BMI cut-point value in general population (1175 males and 1837 females) that came from the same region as the study population, Underweight: BMI < 5% BMI cut-point value; Normal weight: BMI ≥5% and ≤85% BMI cut-point value; Overweight: BMI >85% and <95% BMI cut-point value; Obesity: BMI ≥95% BMI cut-point value.
The association between sleep duration and age for each gender is displayed in Figure 1. For both males and females, a precipitous decline in sleep duration from ages 10 to 15 years was seen. Given the different distribution of Tanner stage by sleep duration (Table 1) and the association between Tanner stage and age, we examined the age-independent relationship between sleep duration and Tanner stage by a linear regression model that adjusted for age and age squared. No significant correlations were seen between any Tanner stage category and sleep duration in either gender (data not shown). While physical activity levels varied slightly by sleep duration, there were no statistically significant associations between physical activity and sleep duration.
Figure 1.
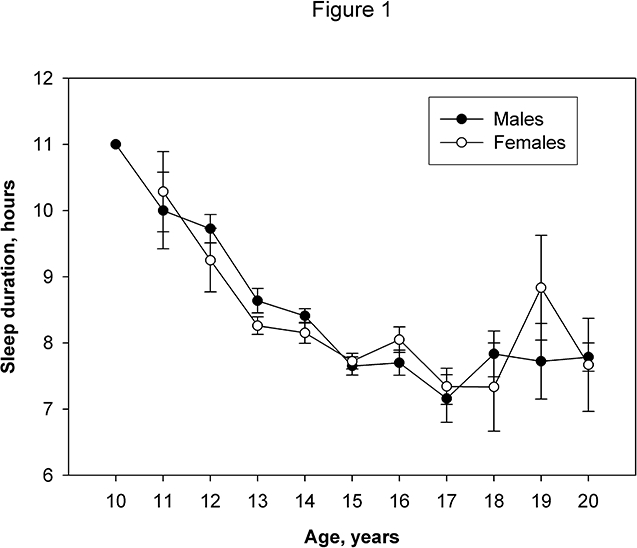
The association between sleep duration and age for each gender.
The relationship between various adiposity measures and age are illustrated in Figure 2 for males and females. For both genders, an increase in all adiposity measures was seen with increasing age. Females tended to have higher adiposity than males by all measures. However, the most striking gender differences were noted for total body fat, truncal body fat, and percent body fat, especially from age 12 onward, which corresponds to the onset of puberty in females. Interestingly, gender differences were most evident in the direct measurements of adiposity (total and truncal body fat), rather than for BMI.
Figure 2.

The relationship between adiposity measurements and age by gender.
Because age is an important determinant of sleep duration and adiposity measures, the relationship between sleep duration and adiposity measures were plotted by age and stratified by gender. Figure 3 displays the plots for females. In general, short sleep duration (<8 hr/night) was associated with higher adiposity measures than medium sleep duration (8–8.9 hr/night). Interestingly, long sleep duration (≥9 hr/night) also tended to have higher adiposity measures than medium sleep duration. That is, the medium sleep group in general had the lowest adiposity measures. The associations were most notable at age 14 years and older. Furthermore, compared to BMI, total and truncal body fat and waist circumference displayed greater differences between the groups. Short and long sleep durations were associated with lower percent lean body mass than medium sleep duration. No consistent association between sleep duration and adiposity was observed in males (data not shown).
Figure 3.

The relationship between adiposity measurements and age in females by sleep duration subgroups.
The observed association between sleep duration and adiposity in Figure 3 was further assessed by regression analysis with adjustment for age, age squared, Tanner stage, and physical activity (Table 3). Consistent with the graphic plots, in general, both short sleep duration and long sleep duration were associated with higher adiposity measures than medium sleep. Notably, the associations between short sleep duration and adiposity measures in females (e.g., β = 1.94, se (standard error) = 0.60, P = 0.0012 for total body fat) and % lean body mass (β = −2.3, se = 0.83, P = 0.0055) were statistically significant as demonstrated by multiple regression analysis even after adjustment for age, Tanner stage, and physical activity.
Table 3.
Association between Self-Reported Sleep Duration and Adiposity Variables among Chinese Adolescents Aged 10–20 Years, Stratified by Gender
| Sleep*Duration (hr) | Male* |
Female* |
||||||
|---|---|---|---|---|---|---|---|---|
| N | Mean ± SD | β (se#) | P | N | Mean ± SD | β (se) | P | |
| BMI (kg/m2) | ||||||||
| <8 | 92 | 17.98 ± 2.39 | 0.15(0.25) | 0.5468 | 80 | 19.32 ± 2.57 | 0.75(0.33) | 0.0247 |
| 8~8.9 | 82 | 17.23 ± 2.16 | Ref | — | 79 | 18.27 ± 2.00 | Ref | — |
| ≥9 | 99 | 17.34 ± 2.30 | 0.68(0.34) | 0.0455 | 68 | 18.29 ± 2.30 | 0.60(0.33) | 0.0724 |
| Total Body Fat (kg) | ||||||||
| <8 | 92 | 5.66 ± 3.93 | −0.02(0.41) | 0.9666 | 80 | 13.09 ± 4.38 | 1.94(0.60) | 0.0012 |
| 8~8.9 | 82 | 5.07 ± 2.87 | Ref | — | 79 | 10.69 ± 3.65 | Ref | — |
| ≥9 | 99 | 5.58 ± 3.95 | 1.05(0.60) | 0.0783 | 67 | 10.77 ± 4.11 | 1.14(0.63) | 0.0677 |
| % Lean Body Mass | ||||||||
| <8 | 92 | 86.97 ± 6.24 | −0.12(0.90) | 0.8969 | 80 | 69.71 ± 5.65 | −2.30(0.83) | 0.0055 |
| 8~8.9 | 82 | 87.16 ± 5.85 | Ref | — | 79 | 72.57 ± 5.61 | Ref | — |
| ≥9 | 99 | 85.78 ± 6.48 | −1.23(1.11) | 0.2677 | 67 | 72.53 ± 6.55 | −1.57(0.99) | 0.1132 |
| Truncal Fat (kg) | ||||||||
| <8 | 92 | 2.58 ± 2.35 | −0.05(0.23) | 0.8389 | 80 | 6.38 ± 2.45 | 1.00(0.33) | 0.0025 |
| 8~8.9 | 82 | 2.21 ± 1.60 | Ref | — | 79 | 5.11 ± 2.02 | Ref | — |
| ≥9 | 99 | 2.45 ± 2.31 | 0.59(0.34) | 0.0766 | 67 | 5.13 ± 2.25 | 0.62(0.34) | 0.0734 |
| Waist Circumference (cm) | ||||||||
| <8 | 92 | 64.26 ± 5.90 | −0.06(0.61) | 0.9232 | 80 | 67.61 ± 6.21 | 2.73(0.89) | 0.0021 |
| 8~8.9 | 82 | 62.37 ± 5.73 | Ref | — | 79 | 64.40 ± 5.36 | Ref | — |
| ≥9 | 99 | 62.61 ± 7.04 | 2.09(0.96) | 0.0295 | 68 | 64.61 ± 6.13 | 1.55(0.84) | 0.0641 |
| Hip Circumference (cm) | ||||||||
| 8 | 92 | 81.72 ± 6.27 | 0.78(0.64) | 0.2222 | 80 | 85.49 ± 6.01 | 2.37(0.83) | 0.0042 |
| ~8.9 | 82 | 78.34 ± 6.06 | Ref | — | 79 | 82.26 ± 5.66 | Ref | — |
| 9 | 99 | 77.32 ± 7.06 | 1.87(0.78) | 0.0163 | 68 | 81.50 ± 6.73 | 1.17(0.87) | 0.1792 |
Regression model adjusted for age, age squared, physical activity and Tanner stage. General estimation equation (GEE) was used to account for intra-twin pair correlations.
Mean ± SD among <8-hr, 8~8.9-hr, and ≥9-hr groups were 6.67 ± 0.64 hr, 8.06 ± 0.16 hr, and 9.50 ± 0.75 hr for males; 6.76 ± 0.57 hr, 8.04 ± 0.13 hr, and 9.49 ± 0.78 hr for females, respectively.
se, standard error of β.
By converting all of the adiposity measures into standardized z-scores, we then compared the magnitude of the associations between sleep duration and various adiposity measures. As shown in Table 4, the association between short sleep duration and adiposity was stronger for total body fat (β = 0.43, se = 0.16), truncal fat (β = 0.39, se = 0.16), and waist circumference (β = 0.43, se = 0.16) than BMI (β = 0.30, se = 0.16). Again, no significant associations were observed between short sleep duration and adiposity in males, which is consistent with the smaller magnitude of difference between the z-scores of adiposity measures seen in males compared to females.
Table 4.
The Relationship between Self-Reported Sleep Duration and Gender- and Age-Specific Z-Score of Adiposity Variables among Chinese Adolescents Aged 10–20 Years, Stratified by Gender
| Sleep* Duration (hr) | Male* |
Female* |
||||||
|---|---|---|---|---|---|---|---|---|
| N | Mean ± SD | β (se#) | P | N | Mean ± SD | β (se) | P | |
| Z-score of BMI | ||||||||
| <8 | 92 | 0.05 ± 0.94 | 0.02(0.14) | 0.8863 | 80 | 0.16 ± 1.10 | 0.30(0.16) | 0.0664 |
| 8~8.9 | 82 | −0.15 ± 0.97 | Ref | — | 79 | −0.16 ± 0.92 | Ref | — |
| ≥9 | 99 | 0.08 ± 1.04 | 0.34(0.15) | 0.0276 | 68 | −0.01 ± 0.93 | 0.21(0.16) | 0.1891 |
| Z-score of Total Body Fat | ||||||||
| <8 | 92 | −0.04 ± 0.88 | −0.04(0.14) | 0.7526 | 80 | 0.24 ± 1.08 | 0.43(0.16) | 0.0077 |
| 8~8.9 | 82 | −0.08 ± 0.93 | Ref | — | 79 | −0.20 ± 0.91 | Ref | — |
| ≥9 | 99 | 0.11 ± 1.12 | 0.24(0.16) | 0.1441 | 67 | −0.05 ± 0.93 | 0.24(0.17) | 0.1558 |
| Z-score of % Lean Body Mass | ||||||||
| <8 | 92 | 0.02 ± 1.02 | −0.01(0.15) | 0.9450 | 80 | −0.19 ± 1.01 | −0.33(0.15) | 0.0297 |
| 8~8.9 | 82 | 0.03 ± 0.91 | Ref | — | 79 | 0.16 ± 0.93 | Ref | — |
| ≥9 | 99 | −0.05 ± 1.03 | −0.06(0.16) | 0.6850 | 67 | 0.03 ± 1.01 | −0.26(0.17) | 0.1200 |
| Z-score of Truncal Fat | ||||||||
| <8 | 92 | −0.04 ± 0.90 | −0.06(0.13) | 0.6686 | 80 | 0.23 ± 1.09 | 0.39(0.16) | 0.0127 |
| 8~8.9 | 82 | −0.09 ± 0.88 | Ref | — | 79 | −0.19 ± 0.91 | Ref | — |
| ≥9 | 99 | 0.12 ± 1.14 | 0.27(0.16) | 0.1021 | 67 | −0.05 ± 0.92 | 0.24(0.17) | 0.1549 |
| Z-score of Waist Circumference | ||||||||
| <8 | 92 | 0.00 ± 0.83 | −0.04(0.12) | 0.7292 | 80 | 0.23 ± 1.08 | 0.43(0.16) | 0.0075 |
| 8~8.9 | 82 | −0.15 ± 0.94 | Ref | — | 79 | −0.20 ± 0.92 | Ref | — |
| ≥9 | 99 | 0.12 ± 1.15 | 0.38(0.16) | 0.0194 | 68 | −0.04 ± 0.92 | 0.26(0.15) | 0.0770 |
| Z-score of Hip Circumference | ||||||||
| <8 | 92 | 0.10 ± 0.93 | 0.08(0.13) | 0.5154 | 80 | 0.25 ± 1.00 | 0.36(0.16) | 0.0224 |
| 8~8.9 | 82 | −0.20 ± 0.95 | Ref | — | 79 | −0.14 ± 0.97 | Ref | — |
| ≥9 | 99 | 0.08 ± 1.05 | 0.41(0.15) | 0.0056 | 68 | −0.13 ± 0.95 | 0.10(0.18) | 0.5847 |
Regression model adjusted for physical activity and Tanner stage. General estimation equation (GEE) was used to account for intra-twin pair correlations.
Mean ± SD among <8-hr, 8~8.9-hr, and ≥9-hr groups were 6.67 ± 0.64 hr, 8.06 ± 0.16 hr and 9.50 ± 0.75 hr for males; 6.76 ± 0.57 hr, 8.04 ± 0.13 hr, and 9.49 ± 0.78 hr for females, respectively.
se, standard error of β.
DISCUSSION
To our knowledge, this is the first study to demonstrate that the observed association between sleep duration and BMI is largely due to adiposity, and that this relationship is influenced by gender in adolescents. As compared to Western populations, this study population is leaner and less likely to be affected by a Western-style diet and physical inactivity, both of which may confound the relationship between sleep and adiposity. In this cohort of Chinese adolescents, sleep duration progressively decreases, reaching a nadir at ages 16–17 years (Figure 1), which corresponds to the time when students prepare for the college entrance examinations in China. For Chinese students, this is a period in which a large proportion of their time is devoted to studying for this college entrance examination. The decreased sleep time seen in Chinese adolescents parallels the findings reported by Carskadon and Acebo for adolescents in the U.S.10
Shortened sleep duration during adolescence has been attributed to delayed bedtimes coupled with fixed early rise times due to school schedules.27 Evidence suggests that at least in part, the delayed sleep pattern in adolescents is due to a delay in the timing of circadian rhythms that regulate sleep and wake times.28 In addition, psychosocial factors such as a growing sense of autonomy, more opportunities for evening social interactions, more hours devoted to homework and after-school employment, etc.10 are likely contributing factors. Although physiological circadian rhythm markers were not collected in this study, it is reasonable to speculate that similar biological changes and psychosocial factors contribute to the decrease in sleep duration in Chinese adolescents. Thus, similar to the U.S., these largely rural Chinese adolescents are a population at increased risk for chronic sleep deprivation and its potentially negative consequences on health and performance.
In this study a significant relationship between sleep duration and adiposity was seen in females but not in males. This sex-related difference may be explained by the gender-specific changes in physiology and body composition that accompany puberty. Puberty is a period characterized by increased muscle mass and reduced fat mass in males, whereas in females, there is an increase in fat mass.14 Higher amounts of adipose tissue in adolescent females could explain the significant relationship between sleep duration and adiposity in females, but not in males within this cohort (Figures 2B and 2D). Our results differ from other studies on adiposity measures and sleep duration in adolescents. For example, a gender difference was not seen in the study by Gupta et al,29 whereas Knutson8 found the association between short sleep duration and BMI to be significant only in male adolescents. Differences in body composition between study populations, as evidenced by mean body fat of 23.2% in the study by Gupta et al versus 18.0% in our study, may in part explain the apparently discordant results. The quantification of body fat by DEXA in our study is also a more accurate measure of adiposity than BMI, which was used in Knutson's study, and bioelectrical impedance that was used in Gupta's study.
The well-known association between obese females and early onset of puberty is intriguing in the context of findings from our current study.30 An earlier study also suggested that short sleep duration is linked to early puberty in school girls.31 Together, these observations suggest that the short sleep duration-adiposity relationship seen in females in this study may be mediated by early onset puberty. However, we are unable to account for the gender-specific finding of our results. While Tanner stage was independently significantly associated with all adiposity measures in females, it was only associated with some adiposity measures in males (data not shown). The interaction between sleep duration and sex hormone secretion deserves further evaluation, especially in adolescents, to determine the precise mechanism in gender-related differences linking short sleep duration to adiposity.
The most important finding in this study is that the total amount of adipose tissue, particularly central adiposity is more strongly associated than BMI with short sleep duration (Figure 3 and Tables 3 and 4). Previous studies on sleep duration and obesity have mostly used BMI as a surrogate for obesity,2,3,6–8 yet studies with white and black adolescents indicate only a fair to modest association between body fat and BMI, with correlation coefficients between DEXA and BMI of 0.50 to 0.83.17 Not only has the use of BMI as an index of adiposity not been well studied in different ethnic populations, but BMI may not accurately reflect adiposity in children in the low or middle range of the BMI percentile curve, such as in our population.16,17 Furthermore, the distribution of fat appears to play a central role in the relationship between sleep duration and obesity. Previous works have demonstrated that visceral fat, commonly measured by waist circumference, is significantly correlated with indices of obstructive sleep apnea, whereas subcutaneous fat in the neck region or parapharyngeal fat is not.32 Individuals with more visceral body fat are also at higher risk for diabetes and heart disease.33 The results of our study suggest that visceral fat may be the chief component of total body fat that interacts with sleep duration.
The biological mechanisms underlying the sleep-adiposity relationship remain to be determined. Physiological studies have indicated that short term sleep loss results in alterations in blood pressure, as well as metabolic and immune function.34,35 Experimental sleep restriction led to an elevation of the orexigenic hormone ghrelin and a depression of the anorexigenic hormone leptin.35,36 Furthermore, sleep loss increases cortisol levels and sympathetic nervous system activation which could lead to a state of insulin resistance.34
Elevation in systemic proinflammatory markers (TNF-α and IL-6) have been reported in association with sleep loss37 and obesity.38 Thus, it is possible that shortened sleep duration triggers alterations in central and peripheral systems involved in the regulation of energy homeostasis which in turn could lead to obesity in susceptible individuals. It is also well known that adipose tissue is an active endocrine organ that secretes several hormones and cytokines, such as leptin, TNF-α and IL-6,38 all of which can negatively affect nocturnal sleep and increase fatigue during the day.
The general applicability of a study on the sleep-adiposity relationship in a cohort of predominantly normal weight adolescents may be called into question. However, longitudinal studies39,40 have indicated that the adiposity and fat distribution of children and adolescents strongly predict obesity and cardiovascular disease (CVD) risk factors into adulthood. Specifically, van Lenthe et al have shown that in a cohort of relatively lean adolescents (19% of males and 15% of females had BMI ≥25 kg/m2) central adiposity independently predicts CVD risk factors in early adulthood. Therefore, despite our adolescent cohort being relatively lean (mean BMI = 18± 2.4 kg/m2), increases in the amount of adiposity may lead to higher risks of developing CVD in adulthood. If short sleep duration persists into adulthood, it is very likely that these individuals will also develop pathological levels of adiposity and increase their BMI into the obese range.
Potential limitations of this study include the self-reported sleep measures and the cross-sectional design. Although two different questionnaires were used to obtain sleep measures, each showed a good correlation with the sleep diary data. While self-reported data may introduce measurement error, neither the study subject nor the field staff were aware of the relationship between sleep duration and adiposity at the time of data collection. Thus, the recall bias should be non-differential and therefore is likely to bias the results toward the null hypothesis. Perhaps the most important limitation is that inherent in the cross-sectional design, we were unable to determine a temporal relation between sleep duration and adiposity. In addition, the sleep duration categories we have created are arbitrary in nature and in a cohort of adolescents, whose sleep requirements vary with age, it is probable that an individual who sleeps the “normal” physiologic amount may have been placed in the long sleep group. This may partially account for the non-significant differences seen between the medium and long sleep duration groups.
In summary, results from this study confirm the previously observed relationship between short sleep duration and BMI in a relatively lean population and demonstrate that such relationships appear to be mediated by total and central body fat. Although the mechanisms linking sleep duration and obesity are unknown, it is possible that sleep loss leads to alterations in metabolic regulatory mechanisms or inflammatory processes which in turn contribute to the development of adiposity. It also has been shown that obesity is associated with poor sleep, creating a vicious cycle. Efforts to reduce adiposity and its health consequences must start during adolescence as adolescent obesity is associated with a high likelihood of adult obesity. Thus, sleep may represent a potentially modifiable risk factor in comprehensive strategies to combat the epidemic of obesity in adolescents and adults.
ACKNOWLEDGMENTS
We gratefully acknowledge the assistance and cooperation of the faculty and staff of Anhui Medical University. We thank all the participants in the study for their time and effort. This study is supported in part by grant 1R01 HD049059 from National Institute of Child Health and Development and 1R01 HL086461 and 5T32HL007909 from National Heart Lung and Blood Institute.
ABBREVIATIONS
- BMI
body mass index
- CVD
cardiovascular disease
- DEXA
dual-energy X-ray absorptiometry
- se
standard error of parameter estimate (β)
- GEE
generalized estimating equation
- GH
growth hormone
- IGF-1
insulinlike growth factor-1
- IPAQ
international physical activity questionnaire
- MET
metabolic equivalent
- TNF-α
tumor necrosis factor-alpha
- IL-6
interleukin 6
- CRP
C-reactive protein
- mRNA
messenger ribonucleic acid
- PSQ
Pediatric Sleep Questionnaire
- PSQI
Pittsburgh Sleep Quality Index
Footnotes
Disclosure Statement
This was not an industry supported study. Dr. Zee has received research support from Boehringer-Ingelheim, Sanofi-Aventis, Kyowa, Schwartz Biosciences, and Takeda; has consulted for Boehringer-Ingelheim, Sanofi-Aventis, Takeda, Neurocrine Biosciences, and Pfizer; and has participated in speaking engagements for Takeda and Sanofi-Avents. The other authors have indicated no financial conflicts of interest.
REFERENCES
- 1.Mokdad AH, Ford ES, Bowman BA, et al. Prevalence of obesity, diabetes, and obesity-related health risk factors, 2001. JAMA. 2003;289:76–9. doi: 10.1001/jama.289.1.76. [DOI] [PubMed] [Google Scholar]
- 2.Gangwisch JE, Malaspina D, Boden-Albala B, Heymsfield SB. Inadequate sleep as a risk factor for obesity: analyses of the NHANES I. Sleep. 2005;28:1289–96. doi: 10.1093/sleep/28.10.1289. [DOI] [PubMed] [Google Scholar]
- 3.Vorona RD, Winn MP, Babineau TW, Eng BP, Feldman HR, Ware JC. Overweight and obese patients in a primary care population report less sleep than patients with a normal body mass index. Arch Intern Med. 2005;165:25–30. doi: 10.1001/archinte.165.1.25. [DOI] [PubMed] [Google Scholar]
- 4.Kripke DF, Simons RN, Garfinkel L, Hammond EC. Short and long sleep and sleeping pills. Is increased mortality associated? Arch Gen Psychiatry. 1979;36:103–16. doi: 10.1001/archpsyc.1979.01780010109014. [DOI] [PubMed] [Google Scholar]
- 5.National Sleep Foundation. 2005 “Sleep in America” Poll. Washington DC: National Sleep Foundation; 2005. [Google Scholar]
- 6.Reilly JJ, Armstrong J, Dorosty AR, et al. Early life risk factors for obesity in childhood: cohort study. BMJ. 2005;330(7504):1357. doi: 10.1136/bmj.38470.670903.E0. [DOI] [PMC free article] [PubMed] [Google Scholar]
- 7.von Kries R, Toschke AM, Wurmser H, Sauerwald T, Koletzko B. Reduced risk for overweight and obesity in 5- and 6-y-old children by duration of sleep—a cross-sectional study. Int J Obes Relat Metab Disord. 2002;26:710–16. doi: 10.1038/sj.ijo.0801980. [DOI] [PubMed] [Google Scholar]
- 8.Knutson KL. Sex differences in the association between sleep and body mass index in adolescents. J Pediatr. 2005;147:830–4. doi: 10.1016/j.jpeds.2005.07.019. [DOI] [PubMed] [Google Scholar]
- 9.World Health Organization. Nutrition in adolescence: issues and challenges for the health sector: issues in adolescent health and development: World Health Organization. 2005 [Google Scholar]
- 10.Carskadon MA, Acebo C. Regulation of sleepiness in adolescents: update, insights, and speculation. Sleep. 2002;25:606–14. doi: 10.1093/sleep/25.6.606. [DOI] [PubMed] [Google Scholar]
- 11.National Sleep Foundation. “Sleep in America” Poll. 2006.
- 12.Whitaker RC, Wright JA, Pepe MS, Seidel KD, Dietz WH. Predicting obesity in young adulthood from childhood and parental obesity. N Engl J Med. 1997;337:869–73. doi: 10.1056/NEJM199709253371301. [DOI] [PubMed] [Google Scholar]
- 13.Tanner JM. Growth at adolescence; with a general consideration of the effects of hereditary and environmental factors upon growth and maturation from birth to maturity. 2d ed. Oxford: Blackwell Scientific Publications; 1962. [Google Scholar]
- 14.Roche AF, Sun SS. Human growth: assessment and interpretation. Cambridge, U.K.; New York: Cambridge University Press; 2003. [Google Scholar]
- 15.Wang Y. Is obesity associated with early sexual maturation? A comparison of the association in American boys versus girls. Pediatrics. 2002;110:903–10. doi: 10.1542/peds.110.5.903. [DOI] [PubMed] [Google Scholar]
- 16.Demerath EW, Schubert CM, Maynard LM, et al. Do changes in body mass index percentile reflect changes in body composition in children? Data from the Fels Longitudinal Study. Pediatrics. 2006;117:e487–95. doi: 10.1542/peds.2005-0572. [DOI] [PubMed] [Google Scholar]
- 17.Dietz WH, Bellizzi MC. Introduction: the use of body mass index to assess obesity in children. Am J Clin Nutr. 1999;70:123S–25S. doi: 10.1093/ajcn/70.1.123s. [DOI] [PubMed] [Google Scholar]
- 18.Wang X, Wang B, Chen C, et al. Familial aggregation of blood pressure in a rural Chinese community. Am J Epidemiol. 1999;149:412–20. doi: 10.1093/oxfordjournals.aje.a009828. [DOI] [PubMed] [Google Scholar]
- 19.Marshall WA, Tanner JM. Variations in pattern of pubertal changes in girls. Arch Dis Child. 1969;44:291–303. doi: 10.1136/adc.44.235.291. [DOI] [PMC free article] [PubMed] [Google Scholar]
- 20.Marshall WA, Tanner JM. Variations in the pattern of pubertal changes in boys. Arch Dis Child. 1970;45:13–23. doi: 10.1136/adc.45.239.13. [DOI] [PMC free article] [PubMed] [Google Scholar]
- 21.Pietrobelli A, Formica C, Wang Z, Heymsfield SB. Dual-energy X-ray absorptiometry body composition model: review of physical concepts. Am J Physiol. 1996;271(6 Pt 1):E941–51. doi: 10.1152/ajpendo.1996.271.6.E941. [DOI] [PubMed] [Google Scholar]
- 22.Johansson AG, Forslund A, Sjodin A, Mallmin H, Hambraeus L, Ljunghall S. Determination of body composition—a comparison of dual-energy x-ray absorptiometry and hydrodensitometry. Am J Clin Nutr. 1993;57:323–6. doi: 10.1093/ajcn/57.3.323. [DOI] [PubMed] [Google Scholar]
- 23.Pritchard JE, Nowson CA, Strauss BJ, Carlson JS, Kaymakci B, Wark JD. Evaluation of dual energy X-ray absorptiometry as a method of measurement of body fat. Eur J Clin Nutr. 1993;47:216–28. [PubMed] [Google Scholar]
- 24.Chervin RD, Hedger K, Dillon JE, Pituch KJ. Pediatric sleep questionnaire (PSQ): validity and reliability of scales for sleep-disordered breathing, snoring, sleepiness, and behavioral problems. Sleep Med. 2000;1:21–32. doi: 10.1016/s1389-9457(99)00009-x. [DOI] [PubMed] [Google Scholar]
- 25.Liu X, Liu L. Sleep habits and insomnia in a sample of elderly persons in China. Sleep. 2005;28:1579–87. [PubMed] [Google Scholar]
- 26.Liu X, Tang M, et al. Reliability and validity of the Pittsburgh Sleep Quality Index. Chin J Psychiatry. 1996;29:103–7. [Google Scholar]
- 27.Hansen M, Janssen I, Schiff A, Zee PC, Dubocovich ML. The impact of school daily schedule on adolescent sleep. Pediatrics. 2005;115:1555–61. doi: 10.1542/peds.2004-1649. [DOI] [PubMed] [Google Scholar]
- 28.Carskadon MA, Wolfson AR, Acebo C, Tzischinsky O, Seifer R. Adolescent sleep patterns, circadian timing, and sleepiness at a transition to early school days. Sleep. 1998;21:871–81. doi: 10.1093/sleep/21.8.871. [DOI] [PubMed] [Google Scholar]
- 29.Gupta NK, Mueller WH, Chan W, Meininger JC. Is obesity associated with poor sleep quality in adolescents? Am J Hum Biol. 2002;14:762–8. doi: 10.1002/ajhb.10093. [DOI] [PubMed] [Google Scholar]
- 30.Slyper AH. Childhood obesity, adipose tissue distribution, and the pediatric practitioner. Pediatrics. 1998;102:e4. doi: 10.1542/peds.102.1.e4. [DOI] [PubMed] [Google Scholar]
- 31.Murata K, Araki S. Menarche and sleep among Japanese schoolgirls: an epidemiological approach to onset of menarche. Tohoku J Exp Med. 1993;171:21–7. doi: 10.1620/tjem.171.21. [DOI] [PubMed] [Google Scholar]
- 32.Schafer H, Pauleit D, Sudhop T, Gouni-Berthold I, Ewig S, Berthold HK. Body fat distribution, serum leptin, and cardiovascular risk factors in men with obstructive sleep apnea. Chest. 2002;122:829–39. doi: 10.1378/chest.122.3.829. [DOI] [PubMed] [Google Scholar]
- 33.Bray GA. Medical consequences of obesity. J Clin Endocrinol Metab. 2004;89:2583–89. doi: 10.1210/jc.2004-0535. [DOI] [PubMed] [Google Scholar]
- 34.Spiegel K, Leproult R, Van Cauter E. Impact of sleep debt on metabolic and endocrine function. Lancet. 1999;354(9188):1435–9. doi: 10.1016/S0140-6736(99)01376-8. [DOI] [PubMed] [Google Scholar]
- 35.Spiegel K, Tasali E, Penev P, Van Cauter E. Brief communication: Sleep curtailment in healthy young men is associated with decreased leptin levels, elevated ghrelin levels, and increased hunger and appetite. Ann Intern Med. 2004;141:846–50. doi: 10.7326/0003-4819-141-11-200412070-00008. [DOI] [PubMed] [Google Scholar]
- 36.Taheri S, Lin L, Austin D, Young T, Mignot E. Short sleep duration is associated with reduced leptin, elevated ghrelin, and increased body mass index. PLoS Med. 2004;1:e62. doi: 10.1371/journal.pmed.0010062. [DOI] [PMC free article] [PubMed] [Google Scholar]
- 37.Shearer WT, Reuben JM, Mullington JM, et al. Soluble TNF-alpha receptor 1 and IL-6 plasma levels in humans subjected to the sleep deprivation model of spaceflight. J Allergy Clin Immunol. 2001;107:165–70. doi: 10.1067/mai.2001.112270. [DOI] [PubMed] [Google Scholar]
- 38.Kern PA, Saghizadeh M, Ong JM, Bosch RJ, Deem R, Simsolo RB. The expression of tumor necrosis factor in human adipose tissue. Regulation by obesity, weight loss, and relationship to lipoprotein lipase. J Clin Invest. 1995;95:2111–9. doi: 10.1172/JCI117899. [DOI] [PMC free article] [PubMed] [Google Scholar]
- 39.Webber LS, Wattigney WA, Srinivasan SR, Berenson GS. Obesity studies in Bogalusa. Am J Med Sci. 1995;310(Suppl 1):S53–61. doi: 10.1097/00000441-199512000-00010. [DOI] [PubMed] [Google Scholar]
- 40.van Lenthe FJ, van Mechelen W, Kemper HC, Twisk JW. Association of a central pattern of body fat with blood pressure and lipoproteins from adolescence into adulthood. The Amsterdam Growth and Health Study. Am J Epidemiol. 1998;147:686–93. doi: 10.1093/oxfordjournals.aje.a009510. [DOI] [PubMed] [Google Scholar]