

Abstract
Study Objectives:
In a previous study, we validated a polysomnographic assessment for REM sleep behavior disorder (RBD). The method proved to be reliable but required slow, labor-intensive visual scoring of surface electromyogram (EMG) activity. We therefore developed a computerized metric to assess EMG variance and compared the results to those previously published for visual scoring, bed partner-rated RBD symptom scores, and clinical assessments by sleep medicine specialists.
Design:
Retrospective validation of new computer algorithm
Setting:
Sleep research laboratory
Participants:
Twenty-three subjects: 17 with neurodegenerative disorders (9 with probable or possible RBD), and 6 controls.
Interventions:
N/A
Methods:
We visually scored 2 consecutive nocturnal polysomnograms for each subject. A computer algorithm calculated the variance of the chin EMG during all 3-second mini-epochs, and compared variances during REM sleep to a threshold defined by variances during quiet NREM sleep. The percentage of all REM mini-epochs with variance above this threshold created a metric, which we refer to as the supra-threshold REM EMG activity metric (STREAM) for each subject.
Results:
The STREAM correlated highly with the visually-derived score for RBD severity (Spearman rho = 0.87, P < 0.0001). A clinical impression of probable or possible RBD was associated to a similar extent with both STREAM (Wilcoxon rank sum test, P = 0.009) and the visually-derived score (P = 0.018). An optimal STREAM cutoff identified probable or possible RBD with 100% sensitivity and 71% specificity. The RBD symptom score correlated with both STREAM (rho = 0.42, P = 0.046) and the visual score (rho = 0.42, P = 0.048).
Conclusions:
These results suggest that a new, automated assessment for RBD may provide as much utility as a more time-consuming manual approach.
Citation:
Burns JW; Consens FB; Little RJ; Angell KJ; Gilman S; Chervin RD. EMG variance during polysomnography as an assessment for REM sleep behavior disorder. SLEEP 2007;30(12):1771-1778.
Keywords: REM sleep behavior disorder; muscle tonus; sleep, REM; polysomnography; electromyography; synuleinopathy; Parkinson disease; multiple system atropy; signal processing, comuter-assisted; algorithms
INTRODUCTION
REM SLEEP BEHAVIOR DISORDER (RBD) AFFECTS ABOUT 0.4% OF ADULTS, 0.5% OF OLDER ADULTS, 33% OF PATIENTS WITH NEWLY DIAGNOSED PARKINSON DISEASE, and 90% of patients with multiple system atrophy.1 Consequences can include injury to the patient, threats to the safety of a bed partner, and inability to share a bed with a partner. Diagnosis is important because the condition responds well to treatment, most often with clonazepam.2 Moreover, RBD may be a harbinger for neurodegenerative conditions such as Parkinson disease, multiple system atrophy, or dementia with Lewy bodies, which together comprise the α-synucleinopathies.3,4 In the absence of RBD, REM sleep without atonia may also signal increased risk for α-synucleinopathies.5
Polysomnography is now considered necessary to diagnose RBD or identify REM sleep without atonia,1 but interpretation of the requisite findings is highly subjective. In most cases, dream enactment is not directly observed in the sleep laboratory. Diagnosis instead depends on the polysomnographer's perception of elevated baseline muscle tone or abnormally frequent bursts of discrete muscle activation recorded from the surface electromyogram (EMG) during REM sleep. Diagnosis based on quantification of these EMG patterns or some objective polysomnographic measure of RBD severity might be less subjective and more reliable.
To quantify polysomnographic evidence of RBD severity for the first time, Lapierre and Montplaisir proposed an EMG scoring method that robustly distinguished 5 initial RBD patients from 5 control subjects.6 Our group recently provided further data to support the diagnostic validity of this polysomnographic score, which was applied to 17 patients with neurodegenerative conditions and 6 control subjects.7 However, the elements that comprise this score remain somewhat subjective, time consuming (typically adding 1–3 hours to total scoring time), expensive, and feasible only after considerable practice by an experienced technologist. We therefore developed a computer algorithm to identify EMG features of RBD automatically, and then tested the performance of the algorithm in the same group of 23 subjects. Our hypotheses were that the computerized algorithm could identify polysomnographic evidence of RBD as accurately as the visual scoring method proposed by Lapierre and Montplaisir, and that the 2 approaches would show similar correspondence to clinical and questionnaire evidence of RBD.
METHODS
Subjects
Subjects (n = 23) were identified and recruited as previously detailed.7 Seventeen were patients and 6 were control subjects. The 17 patients carried diagnoses of multiple system atrophy (MSA, n = 5), Parkinson disease (PD, n = 6), dementia with Lewy bodies (DLB, n = 2), progressive supranuclear palsy (n = 3), and sporadic olivopontocerebellar atrophy (n = 1). Patients with progressive supranuclear palsy were included to have a group of patients with a neurodegenerative disorder causing parkinsonian symptoms unassociated with RBD, for comparison with the MSA, DLB, and PD patients. Diagnoses were established by board-certified neurologists who specialize in neurodegenerative disorders. Subjects were recruited from University of Michigan Department of Neurology subspecialty clinics for patients with ataxia, movement disorders, and cognitive disorders. All subjects signed informed consent for this IRB-approved protocol, or if demented, had a consent form cosigned by the next-of-kin or legal guardian. A consultation with sleep medicine specialists was included as part of the protocol. Normal control subjects, without any specific sleep complaints and with no genetic relationship to the patients, had similar age and sex distributions to those of the patients.
Clinical Data
Histories, physical examinations, and polysomnograms were performed during an admission to the Sleep Research Laboratory of the University of Michigan General Clinical Research Center. Sleep-oriented clinical histories were performed by either of 2 physicians, board-certified in both sleep medicine and neurology, who were masked to any questionnaire and polysomnographic data. Based on widely used clinical criteria,8 which at that time did not require polysomnography to assess for RBD, the likelihood of the diagnosis was rated as probable (2), possible (1), or unlikely (0). Patients with a history of frequent, clear dream enactment were rated as “probable,” those without nocturnal behavioral episodes as “unlikely,” and those with such episodes that were not clearly dream enactment were rated as “possible.” Seven subjects had a clinical impression of probable RBD, and for purposes of analyses these were combined with the 2 subjects who had possible RBD.
Bed partners completed a questionnaire that asked for Likert scale ratings for each of the symptoms that were diagnostic criteria for RBD.8 Results were tallied and averaged, as previously described,7 to determine an overall RBD symptom score that could range from 0 to 1.0.
Polysomnography
All subjects underwent laboratory-based polysomnography (PSG) for 2 consecutive nights. Digital recordings included electroencephalogram (EEG) (C3-A2, C4-A1, O1-A2, O2-A1 by International 10–20 system), chin electromyogram (EMG), electrooculogram (EOG), electrocardiogram, snoring, respiratory effort using piezoelectric belts over the chest and abdomen, airflow at the nose and mouth using thermocouples, and pulse oximetry. Surface EMGs were recorded from the forearm extensor compartments and the anterior tibialis muscles bilaterally. The data were collected using Telefactor digital polysomnography equipment (Conshohocken, PA). The EMG was recorded with a 10 Hz high-pass filter and a 60 Hz notch filter, and sampled at 200 Hz. A digital 10–70 Hz band pass filter was applied to the EMG data before subsequent computer processing. Experienced polysomnographic technologists masked to patient diagnoses applied the electrodes, monitored the studies continuously, and monitored the subjects by continuous video observation.
Polysomnograms were scored according to a standard protocol.9 In addition, one senior registered polysomnographic technologist masked to patients' clinical data scored PSG measures of RBD in accordance with the approach that Lapierre and Montplaisir proposed.6 Many subsequent authors have used this method or some adaptation of it.5,10–16 The approach is based on two measurements: the proportion of 20-second REM sleep epochs that contain a predominance of abnormally elevated background chin muscle tone (tonic component), and the proportion of 2-s mini-epochs (within 20-s REM sleep epochs) that show bursts of EMG activity (phasic component). We used identical measures except that the epochs to assess tonic activity were 30 s in duration (a more widely used standard in polysomnography), and the mini-epochs to assess phasic activity were 3 s in duration. We scored each REM sleep epoch as tonic or atonic depending on whether tonic chin EMG activity was present for more or less than 50% of the epoch.
“Percent phasic” and “percent tonic” scores for each subject were computed as a REM sleep duration-weighted average of the results from the 2 nights, in a manner that essentially considered the data from the 2 recordings as if they had been obtained from one long night.7 The percent phasic and percent tonic scores were then averaged to obtain an overall “PSG score” that reflects results of the visually-assessed Lapierre and Montplaisir method.
A computer algorithm was used to calculate the variance of the chin EMG signal during all 3-s mini-epochs within each PSG. The variance σ was computed as:
where N is the number of samples in the interval, xi is the ith data sample in the interval, and x̄ is the mean of the samples in the interval. Note, if we replaced the variance calculation by simply the sum of the square amplitudes, we obtained similar results. However, the variance calculation was used to generate all the results that will be presented. An upper limit for normal EMG background activity during REM sleep was defined as four times the 5th percentile of the variance observed during all NREM epochs. Normally, EMG tone during REM sleep should not exceed the lowest tone noted during NREM sleep,9 operationalized here as the 5th percentile of the NREM EMG variance. To identify activity likely to be abnormal, with reference to NREM EMG tone, initially we tested a cut-off at 4 times the 5th percentile. Although the data are not reported in detail here, other cut-offs proved to perform similarly (2 to 6 times the 5th percentile, data not shown). The percentage of REM mini-epochs with mean variance above the selected threshold was computed as the new metric, which we will refer to as the supra-threshold REM EMG activity metric (STREAM). Since STREAM is the percentage of REM mini-epochs with mean variance above the selected threshold, it does not have units. A score for each subject was calculated as a REM sleep duration-weighted average of the results from the 2 nights.
Analysis
Associations were tested for significance with the nonparametric Spearman correlation coefficient rho, to avoid the assumption that underlying distributions of variables were normal. Receiver-operator curves were used to assess performance of the new metric in comparison to that of Lapierre and Montplaisir. The level of statistical significance was set at P < 0.05.
RESULTS
The 23 subjects had a mean age of 63 ± 10 (SD) years; 12 were women. Additional data on demographics and medication use in this sample have been published previously.7 Table 1 shows for each subject the RBD PSG score, STREAM on each night, overall RBD symptom score, and ICSD-based clinical impression. The mean STREAM was 22.59 ± 19.42. An example of EMG variance results during one 30-s epoch is shown in Figure 1. The change in EMG variance through the night is illustrated in Figure 2 for 2 representative subjects, one with and one without RBD based on clinical impression. For the patient without RBD (panel A), the EMG variance is generally below the threshold during REM sleep, whereas for the patient with RBD (panel B), the EMG variance often exceeds the threshold.
Table 1.
Summary of RBD Measures for Each Subject*
| Subject | PSG Score | STREAM Night 1 | STREAM Night 2 | STREAM (2-night weighted average) | ICSD-Based Clinical Impression | RBD Symptom Score |
|---|---|---|---|---|---|---|
| 1 | 11.86 | 8.82 | 11.25 | 10.41 | 0 | 0.586 |
| 2 | 59.34 | 5.96 | 63.70 | 38.28 | 2 | 0.623 |
| 3 | 57.45 | 14.67 | 15.27 | 15.22 | 2 | 0.643 |
| 4 | 14.25 | 37.87 | 13.80 | 23.39 | 2 | 0.586 |
| 5 | 43.14 | 45.79 | 54.00 | 49.39 | 2 | 0.671 |
| 6 | 68.20 | 50.28 | 46.67 | 49.55 | 0 | 0.308 |
| 7 | 50.92 | 47.83 | 52.06 | 50.55 | 1 | 0.521 |
| 8 | 37.26 | 26.43 | 12.32 | 20.13 | 0 | 0.29 |
| 9 | 5.88 | 21.65 | 15.97 | 18.85 | 0 | 0.41 |
| 10 | 64.99 | 54.62 | 37.86 | 44.26 | 2 | 0.65 |
| 11 | 59.16 | 82.07 | 59.90 | 72.20 | 0 | 0.21 |
| 12 | 0.72 | 1.98 | 0.99 | 1.43 | 0 | 0.353 |
| 13 | 9.14 | 3.33 | 15.54 | 15.06 | 1 | 0.532 |
| 14 | 9.96 | 7.21 | 4.80 | 5.71 | 0 | 0.35 |
| 15 | 46.30 | 32.10 | 27.34 | 29.67 | 2 | 0.79 |
| 16 | 12.76 | 2.91 | 94.26 | 26.18 | 2 | 0.592 |
| 17 | 1.98 | 2.05 | 2.86 | 2.48 | 0 | 0.275 |
| 18 | 14.79 | 21.26 | 5.39 | 14.99 | 0 | 0.21 |
| 19 | 10.24 | 3.43 | 4.45 | 4.01 | 0 | 0.241 |
| 20 | 2.03 | 5.45 | 1.75 | 3.28 | 0 | 0.208 |
| 21 | 5.19 | 13.18 | 4.76 | 8.64 | 0 | 0.28 |
| 22 | 3.64 | 8.05 | 3.83 | 5.38 | 0 | 0.583 |
| 23 | 6.23 | 9.84 | 11.06 | 10.43 | 0 | 0.208 |
RBD = REM sleep behavior disorder; PSG = polysomnogram; STREAM = supra-threshold REM electromyographic (EMG) activity metric; ICSD = International Classification of Sleep Disorders
Figure 1.

Thirty-s epoch of REM sleep recorded from subject 7 (upper panel), along with corresponding plot of calculated EMG variance for each 3-s mini-epoch (lower panel). LOC-A2 and ROC-A1 are left and right electro-oculograms. Chin1-Chin2 is the submental EMG signal. C3-A2, C4-A1, O1-A2, and O2-A1 are left central, right central, left occipital, and right occipital EEG derivations. The dashed line labeled “Threshold” is placed at 4 times the 5th percentile value of NREM chin electromyographic variance for this particular subject.
Figure 2.
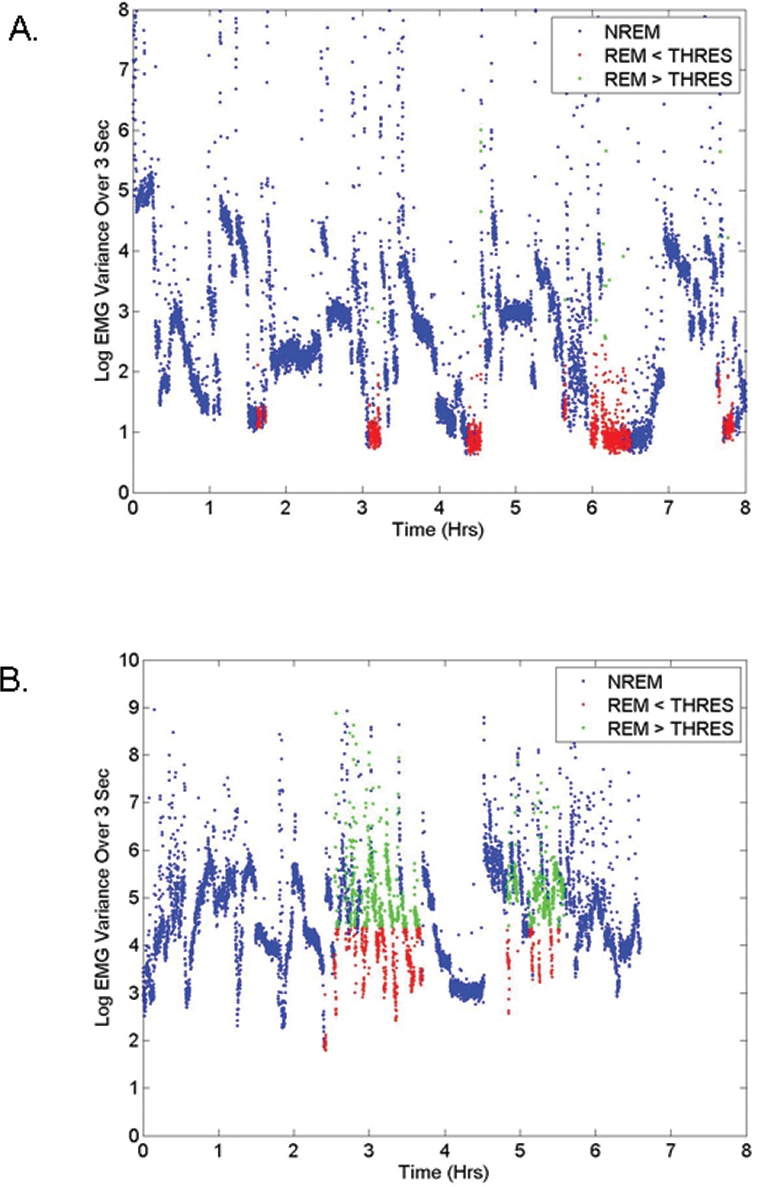
Electromyographic variance computed over 3 s mini-epochs though the night (A) for a subject without a clinical diagnosis of RBD (subject 17), and (B) for a subject with a clinical diagnosis of RBD (subject 2). NREM (blue) signifies values associated with NREM mini-epochs. REM < THRES (red) indicates REM mini-epochs with EMG variance values less than the 4 times the non-REM 5th percentile threshold, and REM > THRES (green) indicates REM epochs with EMG variance greater than the threshold.
As shown in Figure 3, the new variance-based STREAM correlated well with the visually-derived PSG score for RBD severity (Spearman rho = 0.87, P < 0.0001). The result was similar even if the analysis was confined to the 17 subjects with neurodegenerative disorders (rho = 0.82, P < 0.0001). A clinical impression of RBD (probable or possible, n = 9 subjects) was associated to a similar extent with both the computer-generated STREAM (Wilcoxon rank sum test, P = 0.0089) and the visually-derived PSG score (P = 0.0182). Figure 4 shows that both the STREAM and the PSG score effectively separated subjects with and without an ICSD-based clinical impression of probable or possible RBD. Using the optimal threshold levels (12 for the PSG score and 15 for the STREAM) the methods had similar sensitivity (89% for the PSG score and 100% for the STREAM) and specificity of 71%, with 78% (18 of 23) patients classified correctly using the PSG score and 83% (19 of 23) patients classified correctly using the STREAM. As depicted in Figure 5, the RBD symptom score correlated to a similar extent, though not strongly, with the computer-generated STREAM (rho = 0.42, P = 0.046) and the visually-derived PSG score (rho = 0.42, P = 0.048). Two outliers with high STREAM and low RBD symptom scores appear in Figure 6A. Review of these polysomnograms showed that in one case, the EMG channel used by the algorithm showed relatively invariant, high activity throughout Night 1 that may have been in part artifactual. In the second case, REM sleep was particularly difficult to score because it often resembled wakefulness. Such challenges are common in a sample of patients with RBD. Elimination of those 2 outliers from the analysis improved the correlation between the STREAM and RBD symptom score (rho = 0.67, P = 0.0008).
Figure 3.
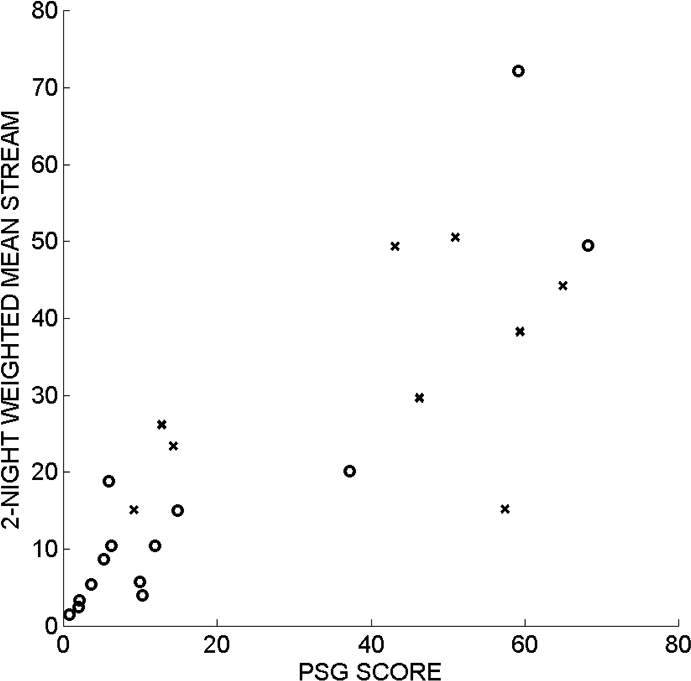
The new, computer-generated STREAM correlated closely with the visually-based polysomnographic score for RBD severity. The subjects without a clinical diagnosis of RBD are indicated by circles (o), and the subjects with a clinical diagnosis of possible or probable RBD are indicated by crosses (x).
Figure 4.

The computer-generated STREAM (A) and visually-generated PSG score (B) showed similar ability to separate subjects for whom RBD was considered probable or possible (1) or unlikely (0) by clinicians who interviewed and examined the subjects. Box plots show median, 25th and 75th percentiles as horizontal lines. The whiskers extend from the box out to 1.5 times the interquartile range of the data. The ‘+’ marks show outliers. Part (B) is adapted from Consens FB et al., Sleep 2005;28:993–7.
Figure 5.

The RBD symptom scores derived from an International Criteria for Sleep Disorders-based questionnaire are plotted against the computer-generated STREAM (A) and the visually-generated PSG score (B). The subjects without a clinical diagnosis of RBD are indicated by circles (o), and the subjects with a clinical diagnosis of possible or probable RBD are indicated by crosses (x).
Figure 6.
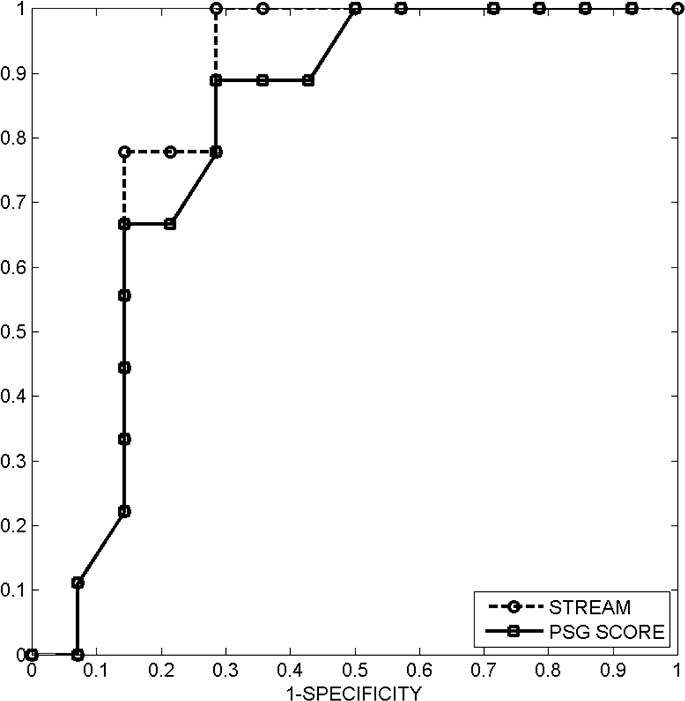
Receiver-operator characteristic (ROC) curves for the STREAM and the visually-generated PSG score suggest similar diagnostic utility for the two approaches. The area under the ROC curves computed using the trapezoidal method is 0.84 for STREAM and 0.73 for the PSG score.
Both the STREAM and the PSG score can be used as metrics for identifying patients with RBD. A graphical method of summarizing the detection performance obtained with these metrics is to plot a receiver operating characteristic (ROC) curve, which summarizes the tradeoff between sensitivity and specificity for various threshold levels of the metric. Sensitivity represents the probability of detecting RBD when it is present, and specificity represents the probability of not detecting RBD when it is actually absent. An ROC curve comparing the empirical detection performance of the STREAM with the PSG score, for a range of possible threshold values on each measure, revealed similar efficacy for the 2 approaches (Figure 6).
Among all subjects, the computed STREAM on Night 1 correlated with the STREAM on Night 2 (rho = 0.53, P = 0.0098; Figure 7A); however, this correlation was not as high as that observed previously for Night 1 and Night 2 visually-derived PSG scores (rho = 0.92 P < 0.0001).7 The score from the second night, in comparison to that of the first night, seemed to show stronger associations with clinical measures. Specifically, the 2nd night STREAM effectively separated subjects with and without an ICSD-based clinical impression of probable or possible RBD (Wilcoxon rank sum test, P = 0.0028), whereas the 1st night STREAM did not (Wilcoxon rank sum test, P = 0.361, Figure 7B). Similarly, the 2nd night STREAM showed a significant correlation with the RBD symptom score (rho = 0.52, P = 0.011), but the1st night STREAM did not (rho = 0.18, P = 0.409, Figure 7C).
Figure 7.
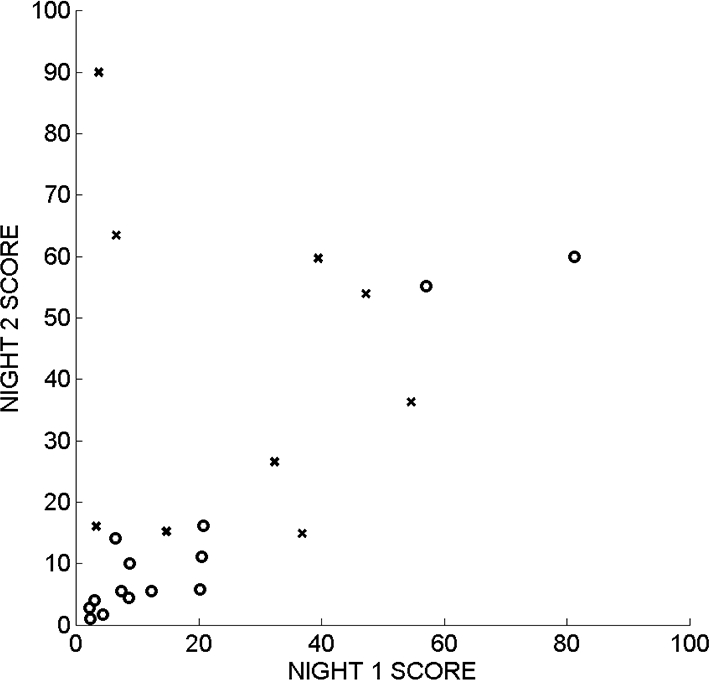
The STREAM during REM sleep on night 1 correlated with STREAM on night 2 (rho = 0.53, P = 0.0098). The subjects without a clinical diagnosis of RBD are indicated by circles (o), and the subjects with a clinical diagnosis of possible or probable RBD are indicated by crosses (x).
The relative utility of the specific EMG frequency content used to compute STREAM was investigated by repeating the analyses using more narrow, digitally filtered EMG frequency bands. The results summarized in Table 2 suggest that the STREAM computed from lower frequency components of the EMG signal provide the best association with clinical measures.
Table 2.
Dependence of STREAM, and its Associations with Clinical Measures, on EMG Frequency
| EMG Frequency Content Hz | STREAM Combined Nights mean ± SD | ICSD-Based Clinical Impression (Rank Sum Test) P – value |
RBD Symptom Score (Spearman Correlation) rho (P – value) |
Spearman Correlation of 1st and 2nd Night STREAM rho (p – value) | ||||
|---|---|---|---|---|---|---|---|---|
| Comb. | 1st Night | 2nd Night | Comb. | 1st Night | 2nd Night | |||
| 10 – 70 | 22.59±19.42 | 0.0089 | 0.3610 | 0.0028 | 0.42 (0.046) | 0.18 (0.4086) | 0.52 (0.0111) | 0.53 (0.0098) |
| 10 – 14.9 | 23.58±20.62 | 0.0128 | 0.2439 | 0.0128 | 0.60 (0.0026) | 0.39 (0.0650) | 0.60 (0.0025) | 0.71 (0.0002) |
| 15 – 19.9 | 22.50±18.24 | 0.0153 | 0.5923 | 0.0061 | 0.48 (0.0194) | 0.24 (0.2704) | 0.45 (0.0296) | 0.42 (0.0461) |
| 20 – 24.9 | 23.38±18.08 | 0.0253 | 0.7290 | 0.0051 | 0.39 (0.0639) | 0.11 (0.6277) | 0.47 (0.0244) | 0.39 (0.0680) |
| 25 – 29.9 | 27.98±20.74 | 0.0215 | 0.5923 | 0.0128 | 0.38 (0.0768) | 0.04 (0.8402) | 0.45 (0.0314) | 0.49 (0.0180) |
| 30 – 34.9 | 30.33±22.99 | 0.0215 | 0.3289 | 0.0128 | 0.38 (0.0755) | 0.12 (0.5804) | 0.43 (0.0405) | 0.58 (0.0045) |
| 35 – 39.9 | 29.90±23.51 | 0.0547 | 0.3289 | 0.0215 | 0.29 (0.1745) | 0.15 (0.4922) | 0.39 (0.0635) | 0.77 (<0.0001) |
| 40 – 44.9 | 29.31±23.11 | 0.0631 | 0.3610 | 0.0253 | 0.28 (0.1951) | 0.08 (0.7013) | 0.37 (0.0842) | 0.78 (<0.0001) |
| 45 – 49.5 | 30.29±23.01 | 0.0726 | 0.3610 | 0.0182 | 0.27 (0.2208) | 0.10 (0.6551) | 0.42 (0.0456) | 0.78 (<0.0001) |
| 50 – 54.9 | 30.15±22.61 | 0.0631 | 0.2439 | 0.0153 | 0.27 (0.2102) | 0.15 (0.4994) | 0.40 (0.0579) | 0.83 (<0.0001) |
| 55 – 59.9 | 29.26±23.15 | 0.0298 | 0.2193 | 0.0182 | 0.32 (0.1393) | 0.15 (0.4808) | 0.39 (0.0635) | 0.81 (<0.0001) |
| 60 – 64.9 | 29.10±23.52 | 0.0298 | 0.1227 | 0.0182 | 0.32 (0.1419) | 0.17 (0.4284) | 0.38 (0.0723) | 0.83 (<0.0001) |
| 65 – 70 | 31.41±23.85 | 0.0406 | 0.2193 | 0.0253 | 0.31 (0.1582) | 0.13 (0.5558) | 0.37 (0.0824) | 0.84 (<0.0001) |
DISCUSSION
In a sample of patients with neurodegenerative disorders and control subjects, a novel, computerized analysis of EMG variance during sleep quantified polysomnographic evidence of RBD about as effectively as did a previously validated and commonly used visual scoring method.6 Both approaches appear to be effective in separating subjects with RBD from subjects without RBD. The major difference, however, is that the computerized analysis of one polysomnogram, in comparison to visual RBD scoring, produces results in seconds rather than 1–3 h; requires no previous experience in specialized RBD scoring; may provide substantial cost savings; and eliminates concerns over test-retest, interscorer, or interlaboratory reliability. We therefore conclude that automatic computation of STREAM may be useful in research settings requiring quantification of polysomnographic evidence for RBD. The algorithm also could prove useful in clinical laboratories, where objective evidence for RBD may improve assessment of patients suspected to have RBD, conditions strongly associated with RBD (such as Parkinson disease, multiple system atrophy, and narcolepsy17), or sleep disorders sometimes associated with RBD (such as restless legs syndrome18 and obstructive sleep apnea19).
A literature search disclosed no previous digital algorithm that has accomplished similar aims. As recently reviewed by Bliwise and colleagues,11 efforts have been directed for many years toward quantification of discrete, phasic EMG events during REM sleep; however, these attempts did not use computerized analysis. They focused on visual scoring of phasic events, which form only one portion of the RBD EMG abnormality as traditionally described. Similarly, Bliwise and colleagues used a phasic electromyographic metric to show that normal subjects have phasic EMG activity in all tested muscle groups. Such activity occurs in about 5% of 2.5-s mini-epochs during REM sleep, and at higher rates (10% to 12%) in Parkinson disease than in normal subjects. Our STREAM often identified higher proportions of REM sleep as having excessive tone, even in most subjects without RBD, and the percent of mini-epochs thus identified on any given night reached a maximum of 81%. These observations suggest that STREAM may assess bursts of activity (Figure 1) somewhat smaller in amplitude than those described in previous studies. An important advantage of STREAM in comparison to previous approaches is that it obviates the need for somewhat arbitrary distinction of tonic and phasic types of motor activity.
Other features of our algorithm that may have facilitated assessment of RBD features include its automatic identification of a scoring threshold specific to each subject, based on his or her lowest NREM muscle activity. A subject's discomfort, restlessness, periodic leg movements, sleep apnea, or immobility (e.g., secondary to Parkinson disease) could well affect average EMG variance. Hence, we based the REM EMG scoring threshold on the 5th percentile (low end) of the NREM variance for the individual to assure that only minimum NREM muscle tone during quiet sleep is used in all cases to determine the threshold for excessive REM sleep muscle tone.
The so-called “first night effect” in polysomnography affects REM sleep prominently and could explain our observation that the second night of polysomnography, in comparison to the first, seems more useful in automatic assessment for RBD. Our original approach was to combine data from the 2 nights because REM sleep can be brief or difficult to score in older patients and especially those with neurodegenerative conditions. Two nights of diagnostic recording are already advocated by some for patients suspected to have parasomnias.20 Our data support this approach, or else a habituation night of unrecorded sleep in a laboratory setting prior to the actual recording. Additional prospective studies to confirm the necessity for this seem warranted.
Several modifications to the STREAM could prove useful and have not yet been tested in a rigorous manner. For example, the decision to use 4 times the NREM 5th percentile for EMG variance as the threshold during REM sleep produced a reasonably wide spread of results, but other thresholds deserve to be evaluated in more detail. We used only one chin EMG derivation for each subject, whereas more selective attention to the derivation with the best signal quality may have improved results (as suggested by review of data from one outlier). Alternative sites for recording the surface EMG also could be explored. The chin was probably a good initial choice because the differences in muscle tone during REM and NREM sleep at this site are greater than those recorded over muscles in any extremity.11 Exploration of other sites in our dataset showed some correlation with clinical measures for a left anterior tibialis recording site but not for a left extensor digitorum site (data not shown). However, the algorithm and threshold used may not have been optimal for use at these sites.
Our study was limited to patients with RBD in the context of neurodegenerative disorders; whether the findings also apply to patients with idiopathic RBD remains unproven. We believe that the findings are likely to apply to subjects with idiopathic RBD, as many such patients are destined to develop one of the neurodegenerative conditions we studied,4 and RBD manifestations in patients with and without neurodegenerative conditions are largely indistinguishable.10 Our algorithm did not exclude EMG bursts at the termination of apneic events, and the possibility remains that its performance might be enhanced if it could be designed to do so. Our sample size was relatively small, subjects were recruited as part of a study with other primary aims,12,21 and our algorithm was developed using data from these subjects. Our results therefore merit prospective confirmation in additional subjects. Additional exploration of the utility of specific EMG frequency band analyses might also prove useful. The lowest frequency band we explored (10 to 15 Hz) appeared to be the most useful, which could suggest that frequencies lower than 10 Hz might reveal even more.
In conclusion, we developed and tested a novel computer algorithm that compares EMG variance during REM and NREM sleep to generate a score predictive of RBD symptoms, ICSD-based diagnoses, and visual polysomnographic findings. The algorithm shows good potential to reduce time and labor, and to increase reliability of efforts to identify or quantify RBD features on polysomnography. Our data do not suggest that the need for a clinical history of dream enactment to establish a diagnosis of RBD will be eliminated by the STREAM, which showed some false negative results if not false positives. However, further testing of our quantitative approach is warranted because initial results suggest clinical utility in assessment for RBD or evaluation of patients who have conditions in which the risk of RBD is increased.
ACKNOWLEDGMENTS
The authors thank the subjects who volunteered to participate in this study, and Cory Martin, RPSGT, who recorded these polysomnograms. This work was supported by NIH grants P01 NS15655 and M01 RR000042.
Footnotes
Disclosure Statement
This was not an industry supported study. Dr. Consens has been on the speakers bureau and advisory board for GlaxoSmithKline. Dr. Gilman has participated in clinical trials supported by Cortex Pharmaceuticals, Johnson – Johnson, Elan, and Wyeth and is on the board of directors of Balboa Biosciences. Dr. Chervin has consulted for Alexza Pharmaceuticals and is on the advisory board and has financial interests in Pavad Medical. The other authors have indicated no financial conflicts of interest.
REFERENCES
- 1.American Academy of Sleep Medicine . Diagnostic and Coding Manual. 2nd ed. Westchester, Illinois: American Academy of Sleep Medicine; 2005. International Classification of Sleep Disorders. [Google Scholar]
- 2.Gagnon JF, Postuma RB, Montplaisir J. Update on the pharmacology of REM sleep behavior disorder. Neurology. 2006;67(5):742–747. doi: 10.1212/01.wnl.0000233926.47469.73. [DOI] [PubMed] [Google Scholar]
- 3.Schenck CH, Bundlie SR, Mahowald MW. Delayed emergence of a parkinsonian disorder in 38% of 29 older men initially diagnosed with idiopathic rapid eye movement sleep behavior disorder. Neurology. 1996;46(2):388–393. doi: 10.1212/wnl.46.2.388. [DOI] [PubMed] [Google Scholar]
- 4.Iranzo A, Molinuevo JL, Santamaria J, et al. Rapid-eye-movement sleep behaviour disorder as an early marker for a neurodegenerative disorder: a descriptive study. Lancet Neurology. 2006;5(7):572–577. doi: 10.1016/S1474-4422(06)70476-8. [DOI] [PubMed] [Google Scholar]
- 5.Gagnon JF, Bedard MA, Fantini ML, et al. REM sleep behavior disorder and REM sleep without atonia in Parkinson's disease. Neurology. 2002;59(4):585–589. doi: 10.1212/wnl.59.4.585. [DOI] [PubMed] [Google Scholar]
- 6.Lapierre O, Montplaisir J. Polysomnographic features of REM sleep behavior disorder. Neurology. 1992;42:1371–1374. doi: 10.1212/wnl.42.7.1371. [DOI] [PubMed] [Google Scholar]
- 7.Consens FB, Chervin RD, Koeppe RA, et al. Validation of a polysomnographic score for REM sleep behavior disorder. Sleep. 2005;28(8):993–997. doi: 10.1093/sleep/28.8.993. [DOI] [PubMed] [Google Scholar]
- 8.American Sleep Disorders Association. Rochester, Minnesota: American Sleep Disorders Association; 1997. International classification of sleep disorders, revised: Diagnostic and coding manual. [Google Scholar]
- 9.Rechtschaffen A, Kales A. Los Angeles: Brain Information Service/ Brain Research Institute, UCLA; 1968. A manual of standardized terminology, techniques and scoring system for sleep stages of human subjects. [Google Scholar]
- 10.Iranzo A, Santamaria J, Rye DB, et al. Characteristics of idiopathic REM sleep behavior disorder and that associated with MSA and PD. Neurology. 2005;65(2):247–252. doi: 10.1212/01.wnl.0000168864.97813.e0. [DOI] [PubMed] [Google Scholar]
- 11.Bliwise DL, He LQ, Ansari FP, Rye DB. Quantification of electromyographic activity during sleep: A phasic electromyographic metric. J Clin Neurophysiol. 2006;23(1):59–67. doi: 10.1097/01.wnp.0000192303.14946.fc. [DOI] [PubMed] [Google Scholar]
- 12.Gilman S, Koeppe RA, Chervin RD, et al. REM sleep behavior disorder is related to striatal monoaminergic deficit in MSA. Neurology. 2003;61(1):29–34. doi: 10.1212/01.wnl.0000073745.68744.94. [DOI] [PubMed] [Google Scholar]
- 13.Fantini ML, Gagnon JF, Filipini D, Montplaisir J. The effects of pramipexole in REM sleep behavior disorder. Neurology. 2003;61(10):1418–1420. doi: 10.1212/wnl.61.10.1418. [DOI] [PubMed] [Google Scholar]
- 14.Stiasny-Kolster K, Doerr Y, Moller JC, et al. Combination of ‘idiopathic’ REM sleep behaviour disorder and olfactory dysfunction as possible indicator for alpha-synucleinopathy demonstrated by dopamine transporter FP-CIT-SPECT. Brain. 2005;128:126–137. doi: 10.1093/brain/awh322. [DOI] [PubMed] [Google Scholar]
- 15.Kumru H, Santamaria J, Tolosa E, et al. Rapid eye movement sleep behavior disorder in parkinsonism with parkin mutations. Annals of Neurology. 2004;56(4):599–603. doi: 10.1002/ana.20272. [DOI] [PubMed] [Google Scholar]
- 16.Winkelman J, James L. Serotonergic antidepressants are associated with REM sleep without atonia. Sleep. 2004;27:46. doi: 10.1093/sleep/27.2.317. [DOI] [PubMed] [Google Scholar]
- 17.Nightingale S, Orgill JC, Ebrahim IO, de Lacy SF, Agrawal S, Williams AJ. The association between narcolepsy and REM Behavior Disorder (RBD) Sleep Med. 2005;6(3):253–258. doi: 10.1016/j.sleep.2004.11.007. [DOI] [PubMed] [Google Scholar]
- 18.Schmidt MH, Koshal VB, Schmidt HS. Use of pramipexole in REM sleep behavior disorder: Results from a case series. Sleep Med. 2006;7(5):418–423. doi: 10.1016/j.sleep.2006.03.018. [DOI] [PubMed] [Google Scholar]
- 19.Iranzo A, Santamaria J. Severe obstructive sleep apnea/hypopnea mimicking REM sleep behavior disorder. Sleep. 2005;28(2):203–206. doi: 10.1093/sleep/28.2.203. [DOI] [PubMed] [Google Scholar]
- 20.Malow B. Paroxysmal events during sleep. J Clin Neurophysiol. 2002;19:522–34. doi: 10.1097/00004691-200212000-00005. [DOI] [PubMed] [Google Scholar]
- 21.Gilman S, Chervin RD, Koeppe RA, et al. Obstructive sleep apnea is related to a thalamic cholinergic deficit in MSA. Neurology. 2003;61(1):35–39. doi: 10.1212/01.wnl.0000073624.13436.32. [DOI] [PubMed] [Google Scholar]