Abstract
The N-methyl-d-aspartate receptor is an important mediator of the behavioral effects of ethanol in the central nervous system. Previous studies have demonstrated sites in the third and fourth membrane-associated (M) domains of the N-methyl-d-aspartate receptor NR2A subunit that influence alcohol sensitivity and ion channel gating. We investigated whether two of these sites, Phe-637 in M3 and Met-823 in M4, interactively regulate the ethanol sensitivity of the receptor by testing dual substitution mutants at these positions. A majority of the mutations decreased steady-state glutamate EC50 values and maximal steady-state to peak current ratios (Iss/Ip), whereas only two mutations altered peak glutamate EC50 values. Steady-state glutamate EC50 values were correlated with maximal glutamate Iss/Ip values, suggesting that changes in glutamate potency were attributable to changes in desensitization. In addition, there was a significant interaction between the substituents at positions 637 and 823 with respect to glutamate potency and desensitization. IC50 values for ethanol among the mutants varied over the approximate range 100–325 mm. The sites in M3 and M4 significantly interacted in regulating ethanol sensitivity, although this was apparently dependent upon the presence of methionine in position 823. Molecular dynamics simulations of the NR2A subunit revealed possible binding sites for ethanol near both positions in the M domains. Consistent with this finding, the sum of the molecular volumes of the substituents at the two positions was not correlated with ethanol IC50 values. Thus, there is a functional interaction between Phe-637 and Met-823 with respect to glutamate potency, desensitization, and ethanol sensitivity, but the two positions do not appear to form a unitary site of alcohol action.
Ethanol is unusual among the major drugs of abuse in that it acts only at high concentrations (in the millimolar range) and that it acts on multiple targets in the central nervous system. For the greater part of the last century, ethanol was generally believed to produce its effects on central nervous system function via nonspecific actions on neuronal lipids, but it is now well accepted that the biologically important actions of ethanol are due to its interactions with proteins (1, 2). Of these proteins, the N-methyl-d-aspartate (NMDA)2 receptor is among the most important target sites of ethanol in the central nervous system. At relevant concentrations, ethanol inhibits ionic current (3), synaptic potentials (4), Ca2+ influx (5, 6), and neurotransmitter release (7) mediated by NMDA receptors. Studies of the mechanism of this inhibition have shown that it does not involve competitive inhibition at the glutamate or glycine binding sites (7–12) or interaction with sites for other allosteric modulators (8, 12) or open channel block (13, 14) but that it involves changes in NMDA receptor gating, notably mean open time and opening frequency (13, 14). Thus, ethanol appears to inhibit NMDA receptors via low affinity interactions with sites that regulate ion channel gating. Although sites in the intracellular C-terminal domain may modulate both ethanol sensitivity of the NMDA receptor (15) and ion channel gating (16–19), this domain does not contain the site of ethanol action, since removal of this region of the protein does not decrease ethanol inhibition of the receptor (20).
In a previous study, Ronald et al. (21) demonstrated that a phenylalanine residue (Phe-639) in the third membrane-associated (M) domain of the NMDA receptor NR1 subunit influences alcohol sensitivity and shows some characteristics of a site of alcohol action. A previous study from this laboratory (22) identified a methionine residue (Met-823) in the M4 domain of the NMDA receptor NR2A subunit that also influences alcohol sensitivity and that fulfills some of the criteria for a site of alcohol action. The methionine in M4, however, also profoundly affects the gating behavior of the ion channel (23). We have recently shown (24) that the cognate position of NR1(Phe-639) in the NR2A subunit, Phe-637, also regulates alcohol sensitivity as well as desensitization and agonist potency. Studies in γ-aminobutyric acidA and glycine receptors have demonstrated residues in transmembrane domains 2 and 3 that form sites of alcohol and anesthetic action (25, 26). These residues appear to line opposite sides of a binding cavity for alcohol and various anesthetics (27), which modulate γ-aminobutyric acidA and glycine receptor ion channel gating (28) by occupying a critical volume (29–33). In the present study, we investigated whether Phe-637 and Met-823 in the NR2A subunit could form a unitary binding site analogous to that found in γ-aminobutyric acidA and glycine receptors. We report here that these sites appear to functionally interact in regulation of NMDA receptor function and ethanol sensitivity, but they do not appear to form a common site of ethanol action.
EXPERIMENTAL PROCEDURES
Materials—Ethanol (95%, prepared from grain) was obtained from Aaper Alcohol & Chemical Co. (Shelbyville, KY), and all other drugs were obtained from Sigma.
Site-directed Mutagenesis and Transfection—Site-directed mutagenesis in plasmids containing NR2A subunit cDNA was performed using the QuikChange kit (Stratagene), and all mutants were verified by double strand DNA sequencing. Human embryonic kidney 293 (HEK293) cells were transfected with NR1–1a, NR2A, and green fluorescent protein at a ratio of 2:2:1 using the calcium phosphate transfection kit (Invitrogen). In electrophysiological experiments, 100 μm ketamine and 200 μm d-l,2-amino-5-phosphonovaleric acid were added to the culture medium. Cells were used in whole cell patch clamp experiments 15–48 h after transfection.
Electrophysiological Recording—Whole cell patch clamp recording was performed at room temperature using an Axopatch 1D or Axopatch 200B (Axon Instruments) amplifier. In ethanol concentration-response experiments, electrodes with open tip resistances of 3–8 megaohms were used. After establishing whole cell mode, series resistances of 5–15 megaohms were obtained. In glutamate concentration-response experiments, thin wall glass capillaries were used to pull electrodes with open tip resistances of 1–5 megaohms and series resistances of 2–7 megaohms. In all experiments, series resistance was compensated by 80%. Cells were voltage-clamped at –50 mV and superfused in an external recording solution containing 150 mm NaCl, 5 mm KCl, 0.2 mm CaCl2, 10 mm HEPES, 10 mm glucose, and 20 mm sucrose. In glutamate concentration-response experiments, the external solution contained EDTA (10 μm) to eliminate the fast component of apparent desensitization due to high affinity Zn2+ inhibition (34). The external solution pH was adjusted to 7.4 with NaOH. The intracellular recording solution contained 140 mm CsCl, 2 mm Mg4ATP, 10 mm 1,2-bis(2-aminophenoxy)ethane-N,N,N′,N′-tetraacetic acid, and 10 mm HEPES. The intracellular solution pH was adjusted to 7.2 with CsOH. Solutions of agonists and ethanol were applied to cells using a stepper motor-driven solution exchange apparatus (Warner Instruments, Inc.) and 600-μm inner diameter square glass tubing. Ethanol concentrations greater than 500 mm tended to disrupt the gigaohm seal; thus, 500 mm was the maximum concentration used in ethanol concentration-response experiments. In glutamate concentration-response experiments, cells were lifted off the surface of the dish to increase the speed of the solution exchange. We have shown previously that under these conditions, 10–90% rise times for solution exchange are ∼1.5 ms (23). Concentration-response data were filtered at 2 kHz (8-pole Bessel) and acquired at 5 kHz on a computer by using a DigiData interface and pClamp software (Axon Instruments).
Molecular Modeling and Molecular Dynamics (MD) Simulations—A model of the transmembrane region of the NR2A subunit of the NMDA receptor was built by homology modeling with InsightII software from Biosym (now Accelrys; San Diego, CA). Aquaporin (Protein Data Bank code 1fqy) served as the template for modeling, since the arrangement of its helices with respect to the M2 segment was the best of several candidates that were considered. The amino-terminal domain and the S2 ligand-binding domain of NR2A were omitted from the model. A segment between the end of M1 and the start of M2 had no counterpart in aquaporin and was created as a helix and loop. The initial model was subjected to energy minimization with a total of 300 iterations of the steepest descent and conjugate gradient algorithms. The AMBER force field was used for all energy calculations. The minimized structure then served as a template for further refinement of the model. The tilt of the M3 helix was adjusted manually to optimize packing with the other transmembrane segments. In addition, residues along M1 and M3 were shifted one or two positions to account for accessibility data (35, 36). Steric clashes were corrected, and the structure was further minimized.
Binding of ethanol to the model NR2A subunit was evaluated by adapting the general Monte Carlo simulation method of Clark et al. (37). For the MD simulation, the NR2A subunit was solvated with a 3.5-Å layer of ethanol, which included 122 solvent molecules. The NR2A subunit was fixed during the calculations (AMBER force field): 2,000 steps (1 fs each) of equilibration and 134,000 steps in the trajectory at 323 K. Snapshots were saved every 1,000 steps. Most of the ethanol solvent (nearly 90%) dispersed from the protein over the course of the simulation; 15 molecules remained bound at the end of the run.
Data Analysis—In concentration-response experiments, IC50 or EC50 and n (slope factor) were calculated using the equation, y = Emax/1 + (IC50 or EC50/x)n, where y represents the measured current amplitude, x is concentration, n is the slope factor, and Emax is the maximal current amplitude. Statistical differences among concentration-response curves were determined by comparing log transformed EC50 or IC50 values from fits to data obtained from individual cells using ANOVA followed by the Dunnett's and Tukey-Kramer tests. Comparisons among mean values of log EC50, IC50, or Iss/Ip for the various mutants were made using correlation analysis, and testing for linear relations of these values to amino acid molecular volume (determined as described previously (23)) was performed using linear regression analysis.
RESULTS
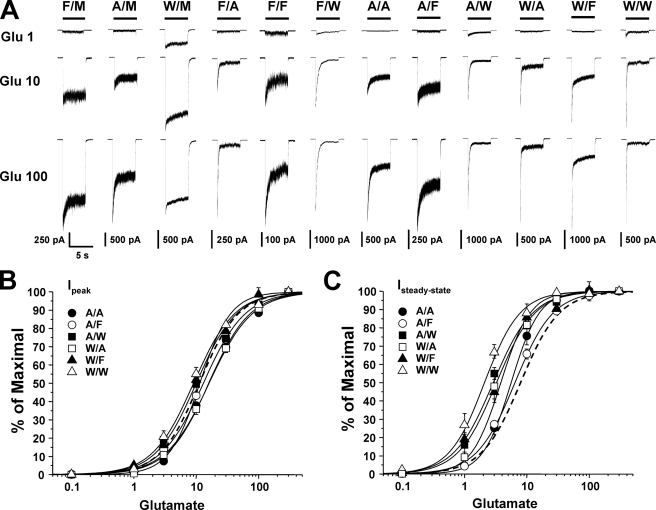
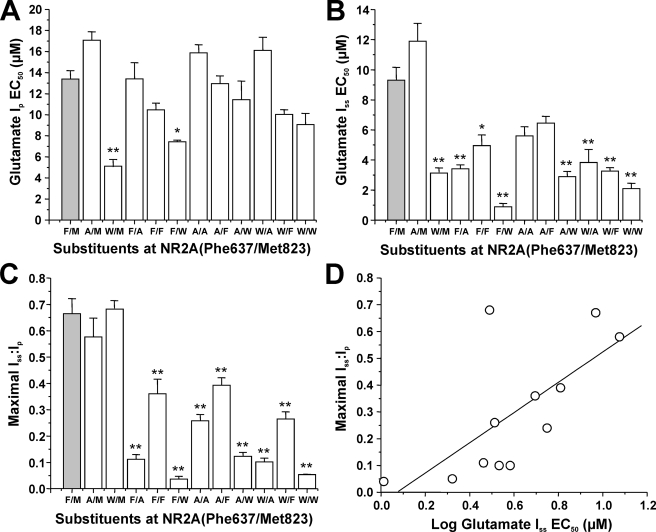
Effects of Dual Mutations at Phe-637 and Met-823 on Glutamate Potency and Desensitization—In order to investigate whether the sites Phe-637 in the M3 domain and Met-823 in the M4 domain of the NR2A subunit might interactively regulate the function of the receptor, we constructed and tested a series of mutants incorporating dual substitutions at these positions. Because only hydrophobic amino acids were tolerated at the Met-823 position, we chose to test combinations of alanine, tryptophan, and the wild type amino acids methionine and phenylalanine at these sites. Fig. 1 shows that all combinations of these amino acids that were tested at Phe-637 and Met-823 yielded functional receptors and that both glutamate potency and desensitization were altered in some of the mutants. Concentration-response curves for glutamate activation of peak and steady-state current in the series of mutants were parallel, indicating that none of the mutations significantly altered the Hill coefficient (p > 0.05; ANOVA). We have previously reported that individual mutations at either Phe-637 or Met-823 can alter glutamate EC50 values (23, 24). Of six mutant subunits containing dual substitutions at Phe-637 and Met-823, none exhibited altered EC50 values for glutamate activation of peak current, whereas four had decreased EC50 values for glutamate activation of steady-state current (Fig. 2; p < 0.0001; ANOVA). In addition, macroscopic desensitization was increased in the majority of these mutants. Values of maximal Iss/Ip for currents activated by 300 μm glutamate in lifted cells were in the range 0.04–0.4 for most of the mutants, compared with a value of 0.66 in the wild type receptor (p < 0.0001; ANOVA). Previous results from our laboratory have demonstrated that for single substitution mutants at NR2A(Met-823), observed changes in steady-state glutamate EC50 were attributable to changes in desensitization (23). In the present study, we found that there was a significant correlation between steady-state glutamate log EC50 and maximal Iss/Ip for the series of mutants (R2 = 0.349, p < 0.05).
FIGURE 1.
Glutamate-activated currents in NR2A(Phe-637/Met-823) mutant subunits. A, records are currents activated by 1, 10, and 100 μm glutamate in the presence of 50 μm glycine in lifted cells expressing NR1 and wild type NR2A subunits (F/M) or NR2A subunits containing various mutations at Phe-637 and Met-823. One-letter amino acid codes are used. B and C, concentration-response curves for glutamate activation of peak (B) and steady-state (C) current in lifted cells expressing various dual site substitution mutations at NR2A(Phe-637/Met-823). Data are means ± S.E.; error bars not visible were smaller than the size of the symbols. Curves shown are the best fits to the equation given under “Experimental Procedures.” The fit for the wild type NR2A subunit is shown as a dashed line. Plots for single-site mutations are not shown. Values for wild type, NR2A(F637A), and NR2A(F637W) are from Ref. 24.
FIGURE 2.
Mutations at NR2A(Phe-637/823) can alter glutamate potency and desensitization. A and B, average EC50 values for glutamate activation of peak (A) and steady-state (B) current in lifted cells expressing NR1 and wild type NR2A subunits (F/M) or NR2A subunits containing various mutations at Phe-637 and Met-823. *, EC50 values that are significantly different from that for wild type NR1/NR2A subunits (*, p < 0.05; **, p < 0.01; ANOVA followed by Dunnett's test). Results are means ± S.E. of 5–8 cells. C, average values of maximal steady-state to peak current ratio (Iss/Ip) in lifted cells coexpressing NR1 and wild type NR2A subunits (F/M) or NR2A subunits containing various mutations at Phe-637 and Met-823. Currents were activated by 300 μm glutamate in the presence of 50 μm glycine and 10 μm EDTA. *, values that differed significantly from that for wild type NR1a/NR2A subunits (**, p < 0.01; ANOVA followed by Dunnett's test). Results are means ± S.E. of 5–8 cells. D, graph plots values of maximal Iss/Ip versus glutamate log EC50 for steady-state current in the series of mutants. Maximal Iss/Ip was significantly correlated with glutamate log EC50 for steady-state (R2 = 0.349, p < 0.05) but not peak (R2 = 0.0515, p > 0.05; results not shown) current. The line shown is the least-squares fit to the data. Values for wild type, NR2A(F637A), and NR2A(F637W) are from Ref. 24.
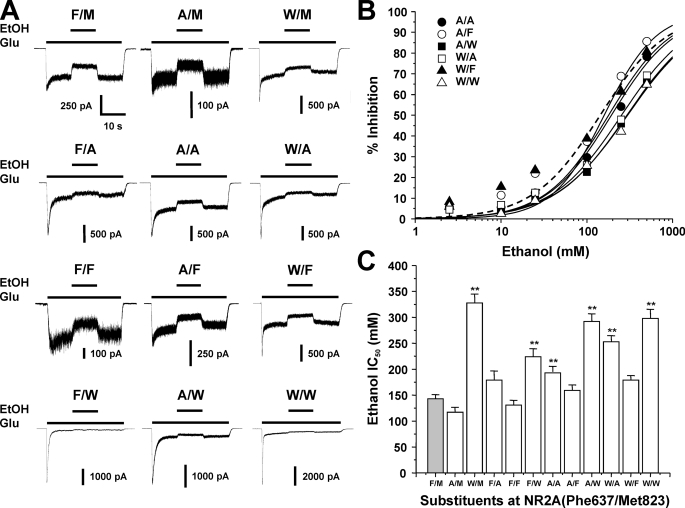
Effects of Dual Mutations at Phe-637 and Met-823 on Ethanol Sensitivity—We next evaluated the ethanol sensitivity of receptors containing various mutations at Phe-637 and Met-823 of the NR2A subunit by performing concentration-response analysis. All of the mutant receptors tested were inhibited by ethanol (Fig. 3). Concentration-response curves for the mutants were essentially parallel to each other, but ethanol IC50 values among the mutants varied considerably (p < 0.0001; ANOVA). The largest change in ethanol sensitivity was observed in the NR2A(F637W) mutant; significant differences from the wild type value were also observed for the M823W mutant and for all mutants involving dual substitution of alanine and tryptophan. It is possible that changes in receptor desensitization could differentially alter ethanol sensitivity of peak and steady-state current. Previous results from our laboratory (22, 24), however, have shown that ethanol inhibition of peak and steady-state current does not differ in single substitution mutants at Phe-637 or Met-823 of the NR2A subunit. In the present study, ethanol inhibition of peak and steady-state current did not differ in F637A/M823W or F637W/M823W subunits, the most highly desensitizing of the dual site mutants (repeated measures ANOVA, p > 0.05; results not shown).
FIGURE 3.
Mutations at NR2A(Phe-637/Met-823) can alter NMDA receptor ethanol sensitivity. A, records are currents activated by 10 μm glutamate and 50 μm glycine and their inhibition by 100 mm ethanol (EtOH) in cells expressing NR1 and wild type NR2A subunits (F/M) or NR2A subunits containing various mutations at Phe-637 and Met-823. B, concentration-response curves for ethanol inhibition of glutamate-activated current in cells expressing various dual site substitution mutations at NR2A(Phe-637/Met-823). Data are means ± S.E. of 5–12 cells; error bars not visible were smaller than the size of the symbols. Curves shown are the best fits to the equation given under “Experimental Procedures.” The fit for the wild type NR2A subunit is shown as a dashed line. Plots for single-site mutations are not shown. C, average IC50 values for ethanol inhibition of glutamate-activated current in cells expressing NR1 and wild type NR2A subunits (F/M) or NR2A subunits containing various mutations at Phe-637 and Met-823. *, EC50 values that are significantly different from that for wild type NR1/NR2A subunits (**, p < 0.01; ANOVA followed by Dunnett's test). Results are means ± S.E. of 5–12 cells. Values for wild type, NR2A(F637A), and NR2A(F637W) are from Ref. 24; values for NR2A(M823A), NR2A(M823F), and NR2A(M823W) are from Ref. 22.
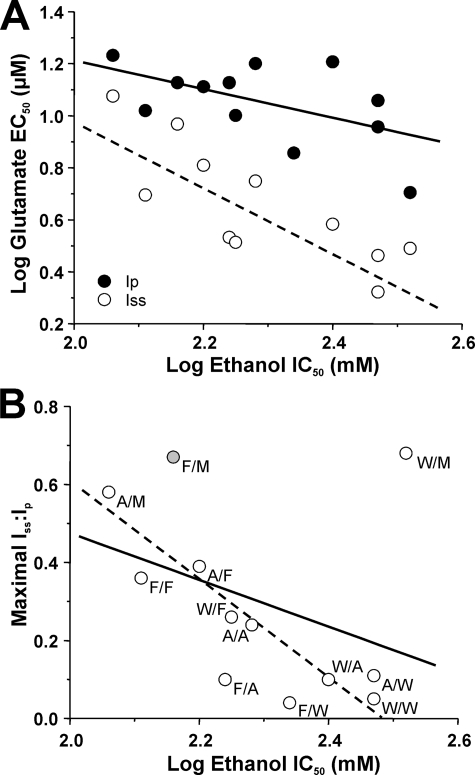
Relation of Ethanol Sensitivity to Receptor Function in Dual Mutations at Phe-637 and Met-823—It is possible that the changes in ethanol sensitivity we observed in the series of mutants tested might be linked to changes in agonist potency and desensitization. Correlation analysis revealed that ethanol IC50 values were significantly negatively correlated with values for glutamate steady-state IC50 (Fig. 4; R2 = 0.501, p < 0.05), but not glutamate peak IC50 (R2 = 0.327; p > 0.05) or maximal steady-state to peak current ratio (R2 = 0.111; p > 0.05). Upon inspection of the graph for the latter, it appeared that the value for the NR2A(F637W) mutant subunit was an outlier due to the dissociation between steady-state glutamate EC50 and maximal Iss/Ip value in this mutant. When the value for the NR2A(F637W) mutant was excluded from the analysis, a highly significant negative correlation was obtained between maximal Iss/Ip and ethanol IC50 (R2 = 0.691, p < 0.001).
FIGURE 4.
Ethanol sensitivity of NMDA receptors containing NR2A(Phe-637/Met-823) mutant subunits is related to glutamate potency and desensitization. A, the graph plots values of log glutamate EC50 for peak (closed circles) and steady-state (open circles) current versus log ethanol IC50. Glutamate EC50 was significantly negatively correlated with log ethanol IC50 for steady-state (R2 = 0.501, p < 0.01; dashed line) but not peak (R2 = 0.327, p > 0.05; solid line) current. The lines shown are the least-squares fits to the data. B, the graph plots values of maximal Iss/Ip versus log ethanol IC50. These variables were not significantly correlated when the value for the NR2A(F637W) mutant was included in the analysis (R2 = 0.111; p > 0.05; solid line) but were significantly negatively correlated when this value was excluded from the analysis (R2 = 0.691; p < 0.001; dashed line). Values for wild type, NR2A(F637A), and NR2A(F637W) are from Ref. 24; values for NR2A(M823A), NR2A(M823F), and NR2A(M823W) are from Ref. 22.
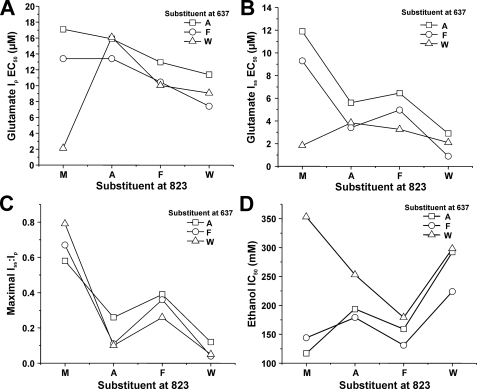
Interactions of Phe-637 and Met-823 in Regulation of Glutamate Potency, Desensitization, and Ethanol Sensitivity—The effects of mutations at Phe-637 and Met-823 on glutamate EC50 and maximal Iss/Ip values we observed could indicate that these sites interact with each other in some manner to regulate receptor function. To investigate this possibility, we constructed interaction plots and analyzed the data using two-way ANOVA (Fig. 5). Although only 2 of the 11 mutations significantly altered the glutamate peak EC50 value, we observed highly significant effects on glutamate peak EC50 of the residues at each position individually (p < 0.0001; ANOVA) as well as a highly significant interactive effect (p < 0.0001; ANOVA). In addition, we observed significant effects on glutamate steady-state EC50 of the residue at each individual position (p < 0.0001; ANOVA), and a significant interaction between the two positions (p < 0.0001; ANOVA). In contrast, maximal Iss/Ip values were altered by mutations at position 823 (p < 0.0001; ANOVA) but not 637 (p > 0.05; ANOVA); nevertheless, mutations at both sites interactively regulated maximal Iss/Ip (p < 0.0001; ANOVA).
FIGURE 5.
Positions 637 and 823 in the NR2A subunit interactively regulate NMDA receptor function and ethanol sensitivity. A and D, the graphs plot EC50 for glutamate activation of peak (A) and steady-state (B) current, maximal Iss/Ip (C), and ethanol IC50 (D) versus the substituent at position 823 for the series of mutants at NR2A(Phe-637/Met-823). Although the substituent at 637 did not by itself affect maximal Iss/Ip values (p > 0.05; ANOVA), there were highly significant effects of the substituents at 637 and 823 individually on all other measures (p < 0.0001; ANOVA), and highly significant interactions between the substituents at 637 and 823 on all measures (p < 0.0001; ANOVA). Note the departure from parallelism due to the values for subunits containing methionine at position 823.
We also tested whether the substituents at Phe-637 and Met-823 could interactively regulate ethanol sensitivity. Ethanol IC50 was highly dependent upon the residue at each position individually (p < 0.0001; ANOVA), and the analysis also revealed a highly significant interaction between the sites in M3 and M4 in regulation of ethanol IC50 (p < 0.0001; ANOVA). This interaction was dependent upon the presence of the wild type residue methionine at position 823 in M4, since it was no longer significant if the values for subunits with methionine at 823 were excluded from the analysis (p > 0.05; ANOVA).
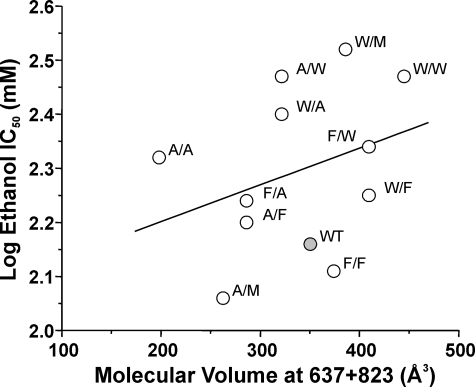
Relation of Molecular Volume of Substituents at Phe-637 and Met-823 to NMDA Receptor Ethanol Sensitivity—In the substitution mutants at sites Phe-637 and Met-823 in the NR2A subunit, the observation that the substituent at one position could alter the effects of substituents at the other position on ethanol sensitivity of the receptor could indicate that these residues physically interact with each other. If these sites lined opposite sides of an ethanol binding cavity and if ethanol acted via volume occupation of this pocket, then one would predict that there should be a significant linear relation between ethanol IC50 and the combined molecular volume of the amino acid side chains at the two sites. However, no such relation was observed (Fig. 6; R2 = 0.0229; p > 0.05).
FIGURE 6.
Combined molecular volume at 637 and 823 in the NR2A subunit is not related to ethanol sensitivity. The graph plots ethanol IC50 versus the sum of the molecular volumes (in Å3) of the substituents at positions 637 and 823 for the series of mutants at NR2A(Phe-637/Met-823). There was not a significant linear relation between ethanol sensitivity and molecular volume at the two sites (R2 = 0.0229, p > 0.05).
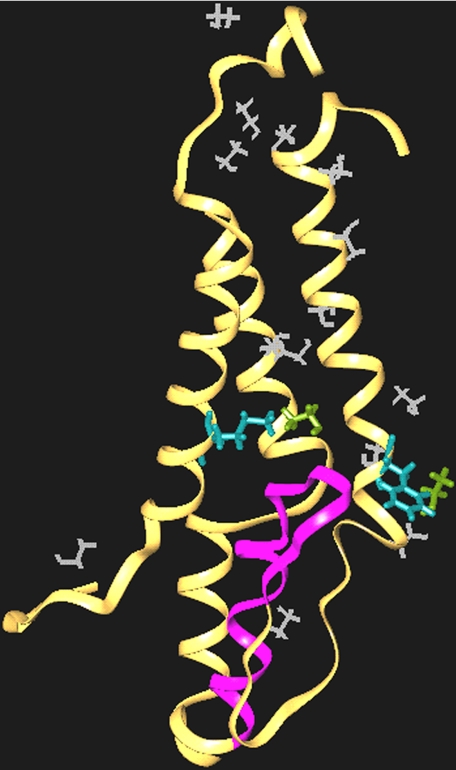
Molecular Dynamics Simulation of Ethanol Binding to the M Domains of the NMDA Receptor NR2A Subunit—To determine whether ethanol is likely to bind at sites near Phe-637 and Met-823, we constructed a model of the M domains of the NMDA receptor NR2A subunit and performed MD simulations. Phe-637 and Met-823 were 13–14 Å apart and appeared to be most closely oriented toward the M2 and M3 domains. The model NR2A subunit was soaked with ethanol solvent to saturate possible alcohol binding sites. MD simulations were then run in which ethanol was allowed to dissociate from these binding sites over the course of the trajectory. Solvent molecules that are the last to leave represent the strongest interactions. In this model (Fig. 7), ethanol bound to a number of sites throughout the M domains, including Phe-637 and Met-823. Although the MD simulation did not permit precise quantitation of binding affinity, the affinity of ethanol for Phe-637 and Met-823 was in the top 10% of all sites.
FIGURE 7.
A molecular model of the NR2A subunit M domains showing putative binding sites for ethanol at positions 637 and 823. A model of the M domains of the NR2A subunit was derived by homology modeling and is depicted as a ribbon structure. Following solvation with ethanol, MD simulations were run in which the ethanol was allowed to diffuse away to identify the most probable binding sites. The M2 segment is highlighted in purple, and Met-825 and Phe-637 are shown in light blue. Molecules of the ethanol solvent are white. Note that two ethanol molecules (light green) remain tightly associated with Phe-637 and Met-823.
DISCUSSION
We have previously shown that Phe-637 in M3 and Met-823 in M4 of the NR2A subunit influence both receptor function and alcohol sensitivity (22–24). In the present study, we observed that the substituent at either of these positions can alter the influence of the substituent at the other position on both receptor function (agonist potency and desensitization) and ethanol sensitivity of the receptor. A direct interaction, such as hydrogen or hydrophobic bonding, between the amino acid side chains at positions 637 and 823, however, appears unlikely. The functional interaction depended upon the inclusion of the mutant containing the wild type residue, methionine, at position 823 and tryptophan at position 637, because when the value for this mutant was removed, the interaction plots were essentially parallel. We have previously reported that this mutant, NR2A(F637W), showed a marked decrease in the glutamate EC50 values for both peak and steady-state current, apparently due to changes in gating (24). Substitution of alanine, phenylalanine, or tryptophan at position 823 reduced, or in some cases eliminated, this effect. This observation is difficult to reconcile with a direct interaction between the side chains at these positions. A more probable explanation is that when the wild type methionine is present at position 823, it may interact with other groups in its environment in a manner that places a conformational constraint on the M4 domain, which in turn restricts the conformation of the other M domains. This conformational restriction could then allow tryptophan substitution at position 637 to produce a substantial change in gating. Substitution of methionine with a hydrophobic amino acid at 823 may release this constraint, diminishing the effect of tryptophan at 637. Recent evidence from a study using cysteine substitution in NR1/NR2C NMDA receptors (41) is also not consistent with an interaction between positions 637 and 823. In this study, the location of the amino acids corresponding to Phe-637 and Met-823 in the NR1 and NR2C subunits differed by 6–10 positions within the plane of the membrane and thus are not likely to be in close proximity to each other. The topology of the M domains derived from homology modeling in the present study is also consistent with the view that Phe-637 and Met-823 do not directly interact. In this model, Phe-637 and Met-823 are ∼14 Å apart with the M2 loop sandwiched in between.
In γ-aminobutyric acidA and glycine receptors, amino acid substitutions at critical positions in transmembrane domains 2 and 3 can alter alcohol and anesthetic potency (25, 26). These residues appear to form opposite sides of a cavity that binds alcohol and various anesthetics (27). The accessibility and dimensions of this cavity change during ion channel gating (38, 39), and occupation of the cavity by an alcohol or anesthetic molecule alters gating of the ion channel (28, 38). The potency of various alcohols and anesthetics for enhancing agonist-activated currents in these receptors is positively correlated with the molecular volume of the alcohol or anesthetic and negatively correlated with the molecular volume of the amino acid side chain (29–33). The occupation of a critical volume in this cavity by the alcohol or anesthetic molecules is thus thought to be responsible for their modulation of receptor function. If there were a similar cavity between the M3 and M4 domains of the NR2A subunit incorporating positions 637 and 823 and if ethanol acted by occupying a critical volume to destabilize a conformational change in this cavity associated with ion channel gating, one would also predict that the molecular volume of the substituents at positions 637 and 823 would be correlated with ethanol potency. Although this is the case for substitutions at position 823 (22), there is a negative correlation with ethanol potency for substitutions at position 637 (24). In the present study, there was no relation between the sum of the molecular volumes of the substituents and ethanol potency, which may indicate that the opposing effects of molecular volume at positions 637 and 823 negated each other. The results obtained in MD simulations were also not consistent with a single site of ethanol action formed by positions 637 and 823. Although both Phe-637 and Met-823 contribute to ethanol binding sites in this model, these residues are separated by an estimated distance of 13–14 Å, which means they are not sufficiently close to form a common binding site for a single ethanol molecule. Thus, it is more likely that Phe-637 and Met-823 form separate sites of alcohol action.
In previous studies from this laboratory, ethanol potency was not related to measures of desensitization for single-site substitution mutants at NR2A(Phe-637) (24) or NR2A(Met-823) (22). Ethanol potency and maximal glutamate Iss/Ip were not correlated in the present study for the entire panel of substitution mutants at both positions but were significantly negatively correlated when the value for the F637W mutant was excluded. Thus, in mutants other than NR2A(F637W), ethanol potency decreased with increases in desensitization. The observation that the correlation was vitiated by the inclusion of the NR2A(F637W) mutant, which exhibited low desensitization and low ethanol potency, argues against modulation of desensitization as the critical factor in the action of ethanol. Nevertheless, in light of the observations of an apparent trend toward a correlation of ethanol sensitivity and desensitization in our previous study (22) and the stabilization of desensitization by ethanol in a non-NMDA glutamate receptor (40), the results of the present study raise the possibility that desensitization may contribute to the action of ethanol on NMDA receptors.
Acknowledgments
We thank Xiang-Qun Hu, David Wagner, and Michelle Mynlieff for helpful discussions.
This work was supported by a grant from the Alcoholic Beverage Medical Research Foundation (R. W. P.) and National Institutes of Health Grant AA015203-01A1 (to R. W. P.). The costs of publication of this article were defrayed in part by the payment of page charges. This article must therefore be hereby marked “advertisement” in accordance with 18 U.S.C. Section 1734 solely to indicate this fact.
Footnotes
The abbreviations used are: NMDA, N-methyl-d-aspartate; MD, molecular dynamics; ANOVA, analysis of variance.
References
- 1.Franks, N. P., and Lieb, W. R. (1994) Nature 367 607–614 [DOI] [PubMed] [Google Scholar]
- 2.Peoples, R. W., Li, C., and Weight, F. F. (1996) Annu. Rev. Pharmacol. Toxicol. 36 185–201 [DOI] [PubMed] [Google Scholar]
- 3.Lovinger, D. M., White, G., and Weight, F. F. (1989) Science 243 1721–1724 [DOI] [PubMed] [Google Scholar]
- 4.Lovinger, D. M., White, G., and Weight, F. F. (1990) J. Neurosci. 10 1372–1379 [DOI] [PMC free article] [PubMed] [Google Scholar]
- 5.Hoffman, P. L., Rabe, C. S., Moses, F., and Tabakoff, B. (1989) J. Neurochem. 52 1937–1940 [DOI] [PubMed] [Google Scholar]
- 6.Dildy, J. E., and Leslie, S. W. (1989) Brain Res. 499 383–387 [DOI] [PubMed] [Google Scholar]
- 7.Göthert, M., and Fink, K. (1989) Naunyn-Schmiedeberg's Arch. Pharmacol. 340 516–521 [DOI] [PubMed] [Google Scholar]
- 8.Peoples, R. W., White, G., Lovinger, D. M., and Weight, F. F. (1997) Br. J. Pharmacol. 122 1035–1042 [DOI] [PMC free article] [PubMed] [Google Scholar]
- 9.Mirshahi, T., and Woodward, J. J. (1995) Neuropharmacol. 34 347–355 [DOI] [PubMed] [Google Scholar]
- 10.Peoples, R. W., and Weight, F. F. (1992) Brain Res. 571 342–344 [DOI] [PubMed] [Google Scholar]
- 11.Gonzales, R. A., and Woodward, J. J. (1990) J. Pharmacol. Exp. Ther. 253 1138–1144 [PubMed] [Google Scholar]
- 12.Chu, B., Anantharam, V., and Treistman, S. N. (1995) J. Neurochem. 65 140–148 [DOI] [PubMed] [Google Scholar]
- 13.Lima-Landman, M. T. R., and Albuquerque, E. X. (1989) FEBS Lett. 247 61–67 [DOI] [PubMed] [Google Scholar]
- 14.Wright, J. M., Peoples, R. W., and Weight, F. F. (1996) Brain Res. 738 249–256 [DOI] [PubMed] [Google Scholar]
- 15.Alvestad, R. M., Grosshans, D. R., Coultrap, S. J., Nakazawa, T., Yamamoto, T., and Browning, M. D. (2003) J. Biol. Chem. 278 11020–11025 [DOI] [PubMed] [Google Scholar]
- 16.Krupp, J. J., Vissel, B., Thomas, C. G., Heinemann, S. F., and Westbrook, G. L. (1999) J. Neurosci. 19 1165–1178 [DOI] [PMC free article] [PubMed] [Google Scholar]
- 17.Lin, Y., Skeberdis, V. A., Francesconi, A., Bennett, M. V., and Zukin, R. S. (2004) J Neurosci. 24 10138–10148 [DOI] [PMC free article] [PubMed] [Google Scholar]
- 18.Mohrmann, R., Köhr, G., Hatt, H., Sprengel, R., and Gottmann, K. (2002) J. Neurosci. Res. 68 265–275 [DOI] [PubMed] [Google Scholar]
- 19.Rutter, A. R., Freeman, F. M., and Stephenson, F. A. (2002) J. Neurochem. 81 1298–1307 [DOI] [PubMed] [Google Scholar]
- 20.Peoples, R. W., and Stewart, R. R. (2000) Neuropharmacology 39 1681–1691 [DOI] [PubMed] [Google Scholar]
- 21.Ronald, K. M., Mirshahi, T., and Woodward, J. J. (2001) J. Biol. Chem. 276 44729–44735 [DOI] [PubMed] [Google Scholar]
- 22.Ren, H., Honse, Y., and Peoples, R. W. (2003) J. Biol. Chem. 278 48815–48820 [DOI] [PubMed] [Google Scholar]
- 23.Ren, H., Honse, Y., Karp, B. J., Lipsky, R. H., and Peoples, R. W. (2003) J. Biol. Chem. 278 276–283 [DOI] [PubMed] [Google Scholar]
- 24.Ren, H., Salous, A. K., Paul, J. M., Lipsky, R. H., and Peoples, R. W. (2007) Br. J. Pharmacol. 151 749–757 [DOI] [PMC free article] [PubMed] [Google Scholar]
- 25.Mihic, S. J., Ye, Q., Wick, M. J., Koltchine, V. V., Krasowski, M. A., Finn, S. E., Mascia, M. P., Valenzuela, C. F., Hanson, K. K., Greenblatt, E. P., Harris, R. A., and Harrison, N. L. (1997) Nature 389 385–389 [DOI] [PubMed] [Google Scholar]
- 26.Krasowski, M. D., and Harrison, N. L. (2000) Br. J. Pharmacol. 129 731–743 [DOI] [PMC free article] [PubMed] [Google Scholar]
- 27.Mascia, M. P., Trudell, J. R., and Harris, R. A. (2000) Proc. Natl. Acad. Sci. U. S. A. 97 9305–9310 [DOI] [PMC free article] [PubMed] [Google Scholar]
- 28.Topf, N., Jenkins, A., Baron, N., and Harrison, N. L. (2003) Anesthesiology 98 306–311 [DOI] [PubMed] [Google Scholar]
- 29.Wick, M. J., Mihic, S. J., Ueno, S., Mascia, M. P., Trudell, J. R., Brozowski, S. J., Ye, Q., Harrison, N. L., and Harris, R. A. (1998) Proc. Natl. Acad. Sci. U. S. A. 95 6504–6509 [DOI] [PMC free article] [PubMed] [Google Scholar]
- 30.Koltchine, V. V., Finn, S. E., Jenkins, A., Nikolaeva, N., Lin, A., and Harrison, N. L. (1999) Mol. Pharmacol. 56 1087–1093 [DOI] [PubMed] [Google Scholar]
- 31.Ueno, S., Wick, M. J., Ye, Q., Harrison, N. L., and Harris, R. A. (1999) Br. J. Pharmacol. 127 377–382 [DOI] [PMC free article] [PubMed] [Google Scholar]
- 32.Yamakura, T., Mihic, S. J., and Harris, R. A. (1999) J. Biol. Chem. 274 23006–23012 [DOI] [PubMed] [Google Scholar]
- 33.Jenkins, A., Greenblatt, E. P., Faulkner, H. J., Bertaccini, E., Light, A., Lin, A., Andreasen, A., Viner, A., Trudell, J. R., and Harrison, N. L. (2001) J. Neurosci. 21 1–4 [DOI] [PMC free article] [PubMed] [Google Scholar]
- 34.Low, C. M., Zheng, F., Lyuboslavsky, P., and Traynelis, S. F. (2000) Proc. Natl. Acad. Sci. U. S. A. 97 11062–11067 [DOI] [PMC free article] [PubMed] [Google Scholar]
- 35.Kuner, T., Wollmuth, L. P., Karlin, A., Seeburg, P. H., and Sakmann, B. (1996) Neuron 17 343–352 [DOI] [PubMed] [Google Scholar]
- 36.Beck, C., Wollmuth, L. P., Seeburg, P. H., Sakmann, B., and Kuner, T. (1999) Neuron 22 559–570 [DOI] [PubMed] [Google Scholar]
- 37.Clark, M., Guarnieri, F., Shkurko, I., and Wiseman, J. (2006) J. Chem. Inf. Model. 46 231–242 [DOI] [PubMed] [Google Scholar]
- 38.Jung, S., Akabas, M. H., and Harris, R. A. (2005) J. Biol. Chem. 280 308–316 [DOI] [PubMed] [Google Scholar]
- 39.Williams, D. B., and Akabas, M. H. (1999) Biophys. J. 77 2563–2574 [DOI] [PMC free article] [PubMed] [Google Scholar]
- 40.Moykkynen, T., Korpi, E. R., and Lovinger, D. M. (2003) J. Pharmacol. Exp. Ther. 306 546–555 [DOI] [PubMed] [Google Scholar]
- 41.Sobolevsky, A. I., Prodromou, M. L., Yelshansky, M. V., and Wollmuth, L. P. (2007) J. Gen. Physiol. 129 509–525 [DOI] [PMC free article] [PubMed] [Google Scholar]


