Abstract
Wallerian degeneration plays a significant role in many central nervous system (CNS) diseases. Tracking the progression of Wallerian degeneration may provide better understanding of the evolution of many CNS diseases. In this study, a 28-day longitudinal in vivo DTI of optic nerve (ON) and optic tract (OT) was conducted to evaluate the temporal and spatial evolution of Wallerian degeneration resulting from the transient retinal ischemia. At 3 − 28 days after ischemia, ipsilateral ON and contralateral OT showed significant reduction in axial diffusivity (32 − 40% and 21 − 29% respectively) suggestive of axonal damage. Both ON and OT showed significant increase in radial diffusivity, 200 − 290% and 58 − 65% in ON and OT respectively, at 9 − 28 days suggestive of myelin damage. Immuohistochmistry of phosphorylated neurofilament (pNF) and myelin basic protein (MBP) was performed to assess axonal and myelin integrities validating the DTI findings. Both DTI and immunohistochemistry detected that transient retinal ischemia caused more severe damage to ON than to OT. The current results suggest that axial and radial diffusivities are capable of reflecting the severity of axonal and myelin damage in mice as assessed using immunohistochemistry.
Introduction
Axonal damage is the primary cause of irreversible neurological disabilities in white matter injuries and diseases of the central nervous system (CNS). Thus, the early detection and accurate diagnosis of axonal damage is imperative for improving patient management. T2-weighted magnetic resonance imaging (MRI) has shown high sensitivity to histological abnormalities in CNS. Unfortunately, these imaging modalities do not differentiate the underlying pathologies, such as axonal injury, demyelination, and inflammation (Meier and others 2004). The single voxel magnetic resonance spectroscopy (MRS) and chemical shift imaging (CSI) measuring signal reduction of N-acetyl aspartate (NAA), an amino acid confined almost exclusively to neurons and axons, suggests axonal loss or degeneration (Bjartmar and others 2002; De Stefano and others 1997; Gonen and others 2000). However, the coarse spatial resolution of these techniques significantly reduces the sensitivity of MRS and CSI in injury detection. The directional diffusivities derived from diffusion tensor imaging (DTI) could quantify water diffusion along (λ∥, axial diffusivity) and across (λ⊥, radial diffusivity) the white matter tract. Increasing evidence suggests that λ∥ and λ⊥ may serve as biomarkers of axonal and myelin damage, respectively (Arfanakis and others 2002; Beaulieu and others 1996; Kim and others 2006a; Song and others 2003; Song and others 2002; Sun and others 2006b; Thomalla and others 2004).
Although the mechanisms leading to the axonal damage in various CNS diseases may be different, Wallerian and dying-back degeneration are common mechanisms of the secondary progression of axonal pathologies (Beirowski and others 2004; Coleman 2005; Kuhn and others 1988; Sawlani and others 1997). Thus, a better understanding of the patterns of Wallerian and dying-back degeneration could benefit patients with CNS diseases by offering an opportunity to design treatments to stop the secondary degeneration. However, the direction of the progression of the secondary degeneration has been controversial. Anterograde, retrograde, or simultaneous bidirectional progression of axonal pathologies have been reported (Beirowski and others 2005; Coleman 2005). The uncertainty over the directionality of the secondary degeneration may be due to the lack of an appropriate method to accurately evaluate the spatiotemporal evolution of the process. A noninvasive technique to quantify and compare the severity of damage between the proximal and distal tracts emanating from the site of primary injury would provide improved insight into the progressive nature of dying-back and Wallerian degeneration.
Because of the high sensitivities of DTI to detect neurological pathologies, its use to characterize the Wallerian or dying-back degeneration has become increasingly common (Gupta and others 2006; Khong and others 2004; Thomalla and others 2004; Thomalla and others 2005). The changes in the mean diffusivities and the diffusion anisotropy in white matter regions have been suggested to reflect the remote damage resulting from the primary insults to the gray matter. However, the damage identification based on statistical observations at a single location in the white matter tract could not differentiate the anterograde or retrograde nature of the injury (Gupta and others 2006; Thomalla and others 2004; Thomalla and others 2005). To decipher the progression of Wallerian or dying-back degeneration, a spatial correlation of damage proximal and distal to the primary injury is necessary.
In the present study, the Wallerian degeneration of optic nerve and tract resulting from the transient retinal ischemia induced retinal ganglion cell death in mice was quantified non-invasively using DTI. Previous studies suggested that damage to optic nerve reached a chronic and stable stage at 7 − 14 days after transient retinal ischemia (Song and others 2003; Sun and others 2006a). Herein, serial in vivo DTI of optic nerve and tract was performed simultaneously at 1, 2, 3, 5, 9, 14, and 28 days after ischemia. Since the same axon originating from retinal ganglion cells projects to the optic nerve and tract, simultaneous examinations of both provide crucial information on the progression pattern of the secondary degeneration after the primary injury. The changes of λ∥ and λ⊥ reflecting axonal and myelin damage were confirmed by immunohistochemical staining of phosphorylated neurofilament (pNF) and myelin basic protein (MBP), respectively.
Materials and Methods
Diffusion Tensor Imaging
Six male Swiss Webster mice, 6 − 8 weeks of age underwent transient retinal ischemia (Song and others 2003; Sun and others 2006a). Briefly, 100 − 120 mmHg intraocular pressure was applied to the right eye of each mouse for one hour. Reperfusion started immediately after removal of the cannula. The left eye, which was not cannulated, served as the control. Longitudinal DTI examination was performed covering the whole visual pathway (Fig. 1) at 1, 2, 3, 5, 9, 14, and 28 days after ischemia. For imaging, mice were anesthetized with a mixture of oxygen and isoflurane (Baxtor Healthcare Corporation, IL, USA) delivered via an isoflurane vaporizer (D. R. C., Inc, KY, USA). Five percent isoflurane/oxygen was used for induction and 2% for maintenance. The core body temperature was maintained using warm water circulating in a pad. After being appropriately anesthetized, mice were placed in a custom-made, magnetic-resonance-compatible head holder to immobilize the head. A 9-cm inner diameter Helmoltz coil served as the RF transmitter. A 1.5-cm outer diameter circular surface coil was placed on top of the head to serve as the RF receiver. The entire device was placed in an Oxford Instruments 200/330 (4.7 T, 33 cm clear bore) magnet equipped with a 15-cm inner diameter, actively shielded Oxford gradient coil (18 G/cm, 200 μs rise time). The magnet, gradient coil, and Techron gradient power supply were interfaced with a Varian UNITY-INOVA console controlled by a Sun Blade 1500 workstation (Sun Microsystems, Santa Clara, CA). A highly reproducible imaging protocol is required for a longitudinal evaluation of optic nerve and tract (Sun and others 2006a; Sun and others 2007). The detailed procedures included (1) acquiring a mid-sagittal image of the brain from a transverse scout (Fig. 1 A) using a low flip angle gradient echo imaging with repetition time (TR) of 0.3s, spin echo time (TE) of 0.008s, and a flip angle of 20°; (2) acquiring a horizontal image defined by connecting the anterior tip of olfactory bulb (a in Fig. 1 B) and the edge between cerebellum and medulla (b in Fig. 1 B), and (3) acquiring 13 contiguous 0.5 mm-thick slices based on the horizontal scout with the first slice selected to contain the rhinal fissure (separating the olfactory bulb and cerebral cortex as indicated by the green arrow in Fig. 1 C) to cover the visual pathway from optic nerves to tracts. A conventional spin-echo imaging sequence, modified by adding a Stejskal-Tanner diffusion sensitizing gradient pair, was employed for acquisition of the required series of diffusion-weighted images. The images were acquired with repetition time (TR) 1.7 s, spin echo time (TE) 50 ms, time between application of gradient pulses (Δ) 25 ms, diffusion gradient duration (δ) 8 ms, 4 scans averaged per k space line, slice thickness 0.5 mm (11 slices total), field of view 3 cm, data matrix 256 × 256 (zero filled to 512 × 512). Six diffusion sensitizing gradients of the icosahedral encoding scheme were applied (Hasan and others 2001). Two diffusion-sensitizing factors, or b values, were used: 0 and 0.838 ms/μm2. DTI data set of each mouse was obtained with an acquisition time of 3 hours. On a pixel-by-pixel basis, quantitative indices including axial diffusivity (λ∥), radial diffusivity (λ⊥), relative anisotropy (RA), and trace of the diffusion tensor (Tr) were derived using software written in Matlab (MathWorks, Natick, MA, USA) defined by the following equations (Basser and Pierpaoli 1996; Sun and others 2003):
| [1] |
| [2] |
| [3] |
| [4] |
The images with no diffusion weighting (b = 0) and derived DTI indices maps (RA, Tr, λ∥, and λ⊥) were displayed to guide the selection of the region of interest (ROI) of left and right optic nerves and tracts referencing to the mouse brain atlas (Franklin and Paxinos 1997). To conduct consistent ROI selections in this study, all maps of the same location were simultaneously displayed using Image Browser (Varian, Inc., Palo Alto, CA). All images were then magnified at the same power for ROI selection and superposition. Using image contrasts provided by different indices, this strategy has proven reproducible in conducting ROI analysis consistently (Song and others 2003; Song and others 2002; Sun and others 2006a; Sun and others 2007; Sun and others 2003). For example, λ⊥ provided significant contrast between the ON and the cerebrospinal fluid (CSF) (Song and others 2003; Sun and others 2006a; Sun and others 2007). Similarly, T2WI (the images with no diffusion weighting) offered superb contrast between OT and surrounding tissues (Sun and others 2007). Our reported data showed that the pathological changes did not reduce the image contrast necessary to delineate ROI.
Figure 1.
The image planning strategy: (1) acquiring a mid-sagittal image of the brain from a transverse scout (Fig. 1 A) using a low flip angle gradient echo imaging; (2) acquiring a horizontal image defined by connecting the anterior tip of olfactory bulb (a in Fig. 1 B) and the edge between cerebellum and medulla (b in Fig. 1 B); and (3) acquiring 13 contiguous 0.5 mm-thick slices based on the horizontal scout with the first slice selected to contain the rhinal fissure (separating the olfactory bulb and cerebral cortex as indicated in the green arrow in Fig. 1 C) to cover the visual pathway from optic nerves to optic tracts.
Data were presented as mean ± standard deviation (n = 6). The analysis of variance (ANOVA) was used to evaluate the statistical significance of the measurements over time. For parameters that exhibited significant differences (p < 0.05), two-sample post hoc t tests were performed to identify days for which left and right visual pathways differ. Statistical significance was accepted at p < 0.05.
Immunohistochemistry Evaluation
Two cohorts of six mice each at 3 and 14 days after ischemia were perfusion fixed through the left cardiac ventricle with phosphate buffered saline (PBS) followed by 4% paraformaldehyde in PBS. The intact brain was excised, placed in 4% paraformaldehyde/PBS for one week before the histological analysis.
A 4-mm-thick coronal section (−1 to +3 mm of bregma) was obtained from each brain and embedded in paraffin. Three-μm-thick slices matching the DTI images were cut and deparaffinized in xylene for immunohistochemical examinations. For each mouse brain, a notch was made on the right hemisphere. Transverse slices were cut starting from the optic chiasm. The slices matching the ON and OT of DTI image located at one mm anterior and two mm posterior to the optic chiasm respectively were collected. The transverse sections including both injured and control visual pathways were mounted on the same slide for the staining. The distribution of normal axons was stained using a primary antibody to phosphorylated neurofilament (pNF, SMI-31, 1:500; Sternberger Monoclonals, Lutherville, Maryland) (Sun and others 2006b) with reactivity revealed by the avidin-biotin-peroxidase method (Zymed Laboratories). The myelin integrity was assessed with the primary antibody for detecting myelin basic protein (MBP, 1:100; Zymed Laboratories Inc., South San Francisco, CA) visualized using avidin–biotin–peroxidase method (Vector Laboratories, Inc. Burlingame, CA 94010). For every immunohistochemical examinations, two adjacent tissue sections were mounted on the same slide. One of the tissue sections went through the complete immunohistochemical staining procedures while the other was stained under the same conditions omitting the primary antibody to serve as a negative control (Aboul-Enein and others 2006). The negative controls were performed on every immunohistochemical staining for each section. Sections were examined with a Nikon Eclipse 80i microscope equipped with a 60× oil objective. For each mouse, two sections acquired from the ON and OT, were captured by a Photometrics CCD digital camera with MetaMorph image acquisition software (Universal Imaging Corporation, Downington, PA). The SMI-31 and MBP positive axons were counted for each white matter tract in a blinded fashion. Specifically, images were magnified 4 times (zoom-in) using MetaMorph, and the positively stained axons were counted through the whole image (150 × 110 μm2).
Results
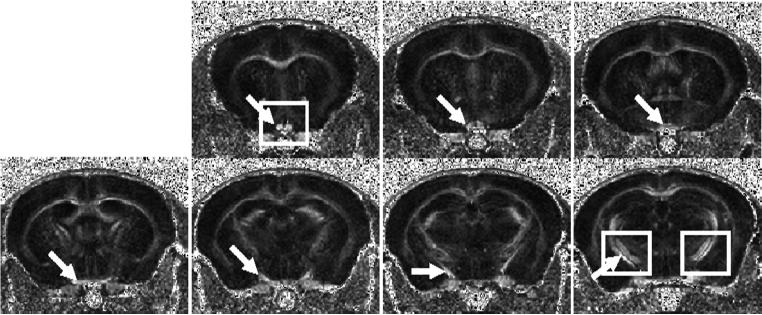
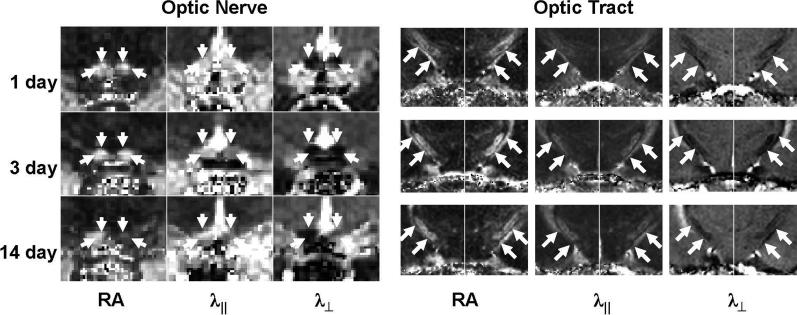
Representative RA maps of contiguous slices acquired from a normal mouse were shown in Figure 2. Optic nerve (the first 2 slices), optic chiasm (the 3rd and 4th slices), and optic tracts (the 5th through 7th slices) were readily recognized in RA maps (indicated by the arrows). The selected rectangles (Fig. 2) were expanded to demonstrate that reduced RA, decreased λ∥, and increased λ⊥ indicate the injury of right optic nerve and left optic tract at 14 days after retinal ischemia (Fig. 3).
Figure 2.
Contiguous slices of RA maps covering the optic nerve, chiasm, and optic tract acquired from a normal mouse. The arrow identifies the optic nerve (the first 2 slices), optic chiasm (the 3rd and 4th slices), and optic tracts (the 5th through 7th slices). The expended views of optic nerve and tract specified by the rectangles are expanded in Fig. 3.
Figure 3.
The expanded view of optic nerve and tract DTI parameter maps from an injured mouse. As indicated by arrows, decreased λ∥ was seen at 3 and 14 days in ipsilateral ON and contralateral OT suggestive of axonal damage. RA and λ⊥ did not change at 3 day but decreased RA and increased λ⊥ were observed at 14 days suggestive myelin damage in these regions.
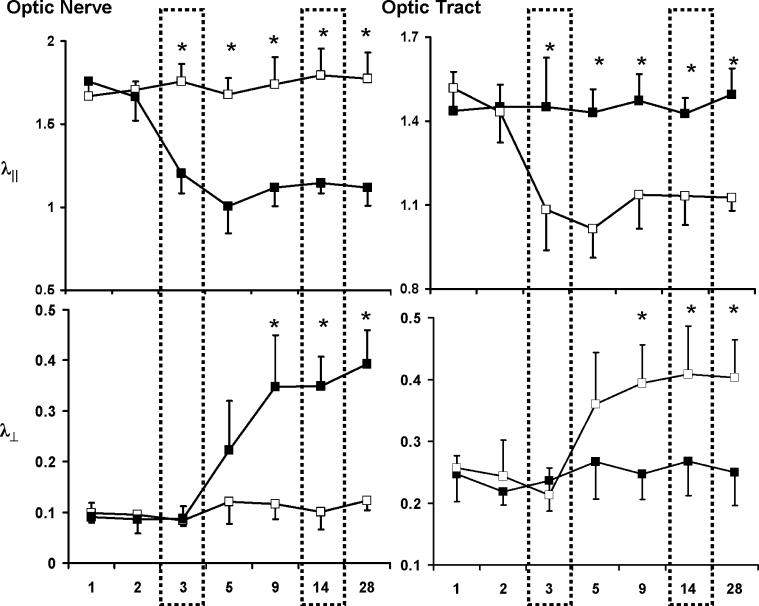
Quantitative analysis of DTI parameters was performed by measuring the selected ROI encompassing the optic nerve (ON) and optic tract (OT) of each hemisphere. The progression of axonal and myelin damage was evaluated using λ∥ and λ⊥ (Fig. 4). In the ON, significant 32 − 40% (p < 0.05) decreases in λ∥ were measured at 3 − 28 days, suggestive of the axonal damage. In contrast, λ⊥ did not change until 5 days after the ischemia. Its value elevated reaching the significant level (200 − 290%, p < 0.05) at 9 − 28 days, suggestive of the myelin damage. In the OT, changes of λ∥ and λ⊥ were measured in the contralateral hemisphere. Significant 21 − 29% decreases of λ∥ were measured at 3 − 28 days after ischemia, suggestive of axonal damage. Significant 58 − 65% increases of λ⊥ were observed at 9 − 28 days after ischemia, suggestive of myelin damage.
Figure 4.
Time courses of λ∥ and λ⊥ of ipsilateral (filled symbols) and contralateral (opened symbols) of ON and OT after the transient retinal ischemia. Decreased λ∥ was measured at 3 − 28 days in both ipsilateral ON and contralateral OT suggestive of the axonal damage. Increased λ⊥ were found at 9 − 28 days suggestive of myelin damage. The unit for λ∥ and λ⊥ is μm2/ms. “*”: p < 0.05.
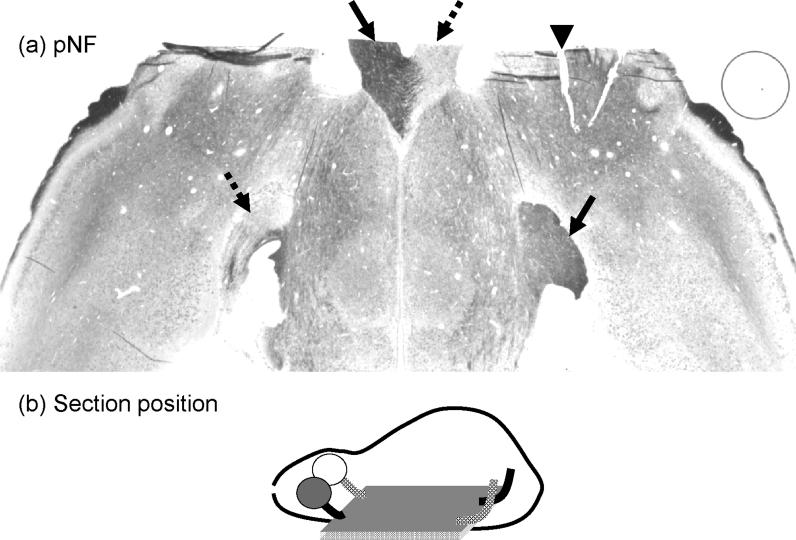
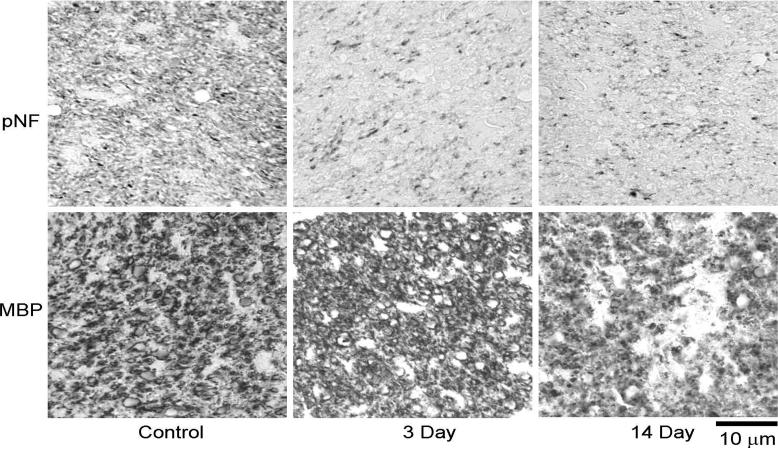
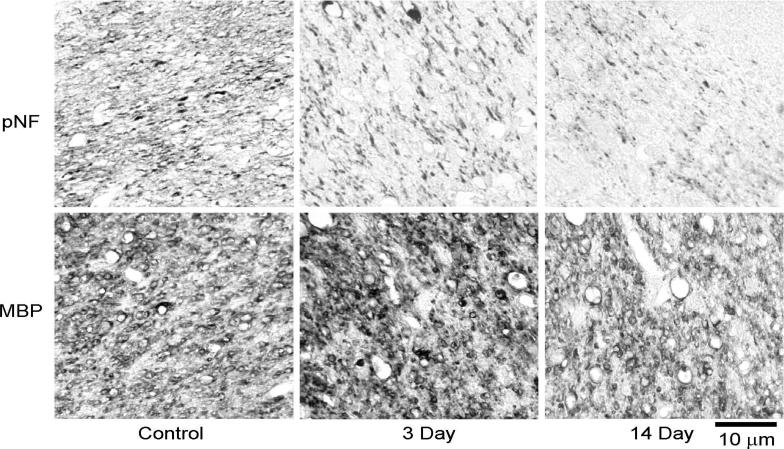
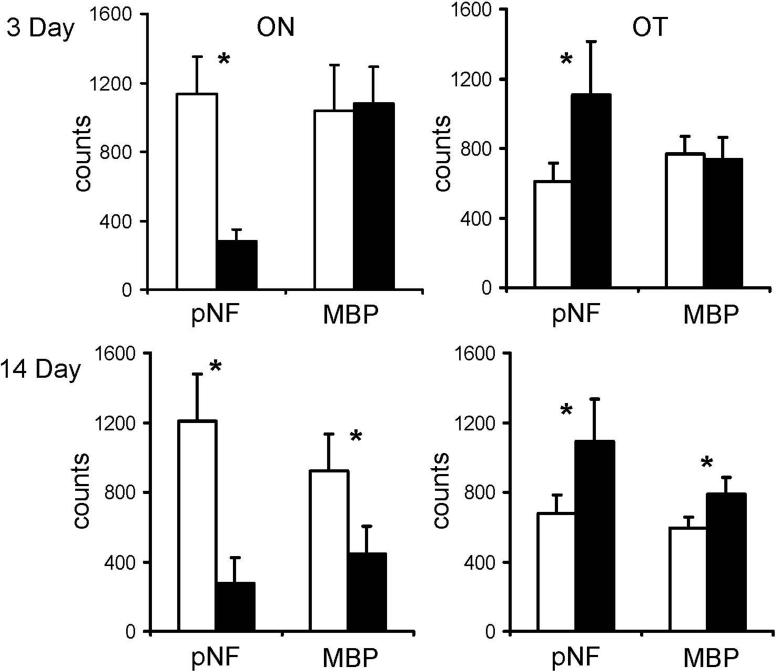
A carefully selected axial tissue section containing both optic nerves and tracts from both hemispheres at 14 days after ischemia underwent pNF staining to examine the axonal pathologies. The loss of pNF staining in the ipsilateral optic nerve and contralateral optic tract is clearly demonstrated (Fig. 5) supporting the monocular nature of the mouse visual pathway and the DTI results. For tissue sections matching the DTI maps, pNF and MBP immunohistochemical staining were performed to examine axonal and myelin integrities respectively. Immunohistochemistry in ipsilateral ON and contralateral OT at different time points showed severe axonal damage at 3 and 14 days and severe myelin damage at 14 days (Figs. 6 and 7) confirming the findings of the time course evaluated by λ∥ and λ⊥. The counts of pNF and MBP positive axons (Fig. 8) showed that at 3 days, pNF positive axon counts reduced by 79 ± 8% (p < 0.05) in the injured ON and reduced 40 ± 20% (p < 0.05) in the injured OT, while MBP positive counts were not changed. At 14 days, however, both axonal and myelin damages in ipsilateral ON were evident by the 78 ± 9% (p < 0.05) and 52 ± 12% (p < 0.05) reductions in counts of pNF and MBP positive axons. Meanwhile, both axonal and myelin damages were also seen in the contralateral OT evidenced by 46 ± 13% (p < 0.05) and 24 ± 10% (p < 0.05) reduction in counts of pNF and MBP positive axons respectively.
Figure 5.
The axial section of a brain from a retinal ischemia mouse stained with pNF showing optic nerves and tracts in both hemispheres. The arrow head indicates the marking notch applied to identify the ipsilateral hemisphere. The significant loss of pNF staining in the ipsilateral optic nerve and the contralateral optic tract (dashed arrows) is clearly seen. In contrast, intense pNF staining is observed in the contralateral optic nerve and the ipsilateral optic tract (solid arrows). The monocular nature of the mouse visual system where most axons projecting from retina ganglion cells to ipsilateral optic nerve and the contralateral optic tract is demonstrated.
Figure 6.
Representative immunohistochemistry, phosphorylated neurofilament (pNF) for axonal integrity and myelin basic protein (MBP) for myelin integrity, of the optic nerve. The significantly decreased pNF staining suggests severe axonal damage at 3 and 14 days. Similarly, the reduced MBP staining at 14 days suggests severe myelin damage at this time point.
Figure 7.
Representative immunohistochemistry results of the optic tract. Simolar to those seen in optic nerve, decreased pNF suggests the severe axonal damage at 3 and 14 days. The decreased MBP staining at 14 days suggests the severe myelin damage this time point.
Figure 8.
The axons positively stained with phosphorylated neurofilament (pNF) and myelin basic protein (MBP) in ipsilateral (black bars) and contralateral (white bars) ON and OT were counted. At 3 days, severe axonal damage was seen by the significant loss of positively stained axons in ipsilateral ON and contralateral OT. At 14 days, both pNF and MBP showed severe axonal and myelin damage in ipsilateral ON and contralateral OT. The “*” indicated p < 0.05.
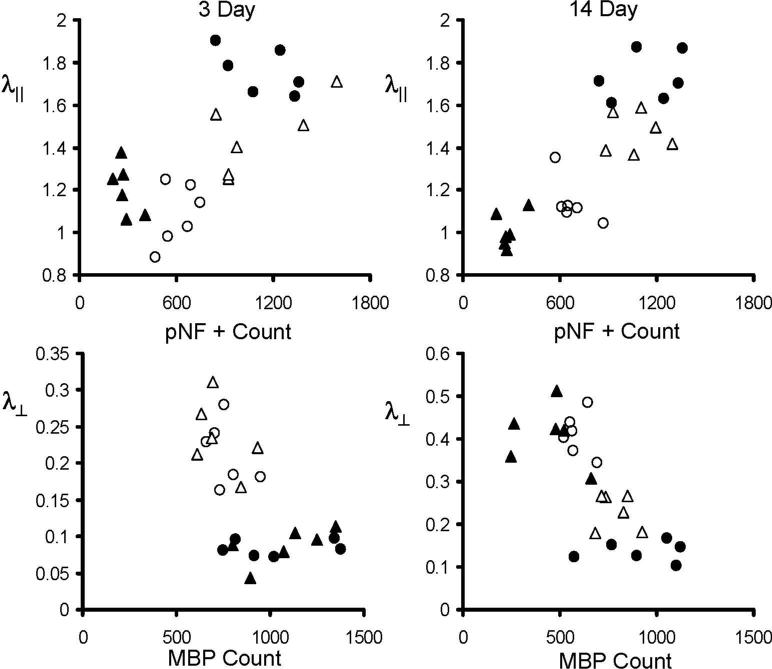
The scatter plots (Fig. 9) of λ∥ vs. pNF positive counts and λ⊥ vs. MBP positive counts from ON (filled symbols) and OT (opened symbols) at 3 and 14 days demonstrate significant correlations between DTI and immunohistochemistry identified injuries with the exception of λ⊥ vs. MBP at 3 days. At 3 days, λ∥ was significantly correlated with pNF positive counts (correlation coefficient γ = 0.83 and 0.84 for ON and OT respectively, p < 0.05). At 14 days, the correlation between λ∥ and pNF positive counts was clearly seen as evident by γ = 0.94 and 0.67 for ON and OT respectively (p < 0.05). Similarly, the correlation between λ⊥ vs. MBP positive counts was shown as γ = −0.78 and −0.77 for ON and OT respectively (p < 0.05).
Figure 9.
The scatter plots of λ∥ vs. pNF positive count and λ⊥ vs. MBP positive counts from left (circles) and right (triangles) ON (filled symbols) and OT (opened symbols) at 3 and 14 days. At 3 days, λ∥ was significantly correlated with pNF positive counts with correlation coefficient (γ) of 0.83 and 0.84 for ON and OT respectively (p < 0.05). At 14 days, the γ between λ∥ and pNF positive counts were 0.94 and 0.67 for ON and OT respecively (p < 0.05), while the γ between λ⊥ vs. MBP positive counts were −0.78 and −0.77 for ON and OT respectively (p < 0.05). The unit for λ∥ and λ⊥ is μm2/ms.
Discussion
In this study, in vivo DTI and post DTI tissue immunohistochemistry were performed to examine the temporal evolution of optic nerve and tract damages resulting from Wallerian degeneration of retinal ganglion cell death. Specifically, decreased λ∥ suggestive of axonal damage was measured in ipsilateral ON and contralateral OT at 3 − 28 days after retinal ischemia, confirmed by pNF immunohistochemistry examinations. Increased λ⊥ indicating myelin damage was seen at 9 − 28 days after retinal ischemia, confirmed by the MBP immunohistochemistry examinations.
Consistent with previously reported DTI findings of white matter Wallerian degeneration resulting from the primary insults to the gray matter (Gupta and others 2006; Khong and others 2004; Thomalla and others 2004; Thomalla and others 2005), the reduced diffusion anisotropy was also seen in the present study. Our study suggested that both the decreased λ∥ and the increased λ⊥ contribute to the observed decrease in diffusion anisotropy. In contrast to the previously reported studies examining focal white matter damage (Gupta and others 2006; Khong and others 2004; Thomalla and others 2004; Thomalla and others 2005), the present study examined a single tract at two locations providing the spatial variation along the tract undergoing Wallerian degeneration. Thus, the injury severity between axons proximal and distal to the primary insults can be analyzed. At two weeks post-ischemia, more severe damage was present in the ipsilateral optic nerve than in the contralateral optic tract. Specifically, injured optic nerve showed a 32 − 40% decrease in λ∥ with only 21 − 29% decrease in injured optic tract. Such spatial variation of axonal damage severity was consistent with the immunohistochemical staining of pNF. The counts of healthy axons (pNF positive axons) reduced by 78% in injured optic nerve, but only 48% reduction was seen in the injured optic tract. Similarly, λ⊥ increased 200 − 290% and 58 − 65% in the optic nerve and tract respectively suggested more severe myelin loss in the optic nerve than that in the optic tract. This was also consistent with the 52% and 24% reduction of MBP positive axon counts in optic nerve and tract respectively. Thus, both λ∥ and λ⊥ are capable of reflecting the severity of axonal and myelin damage, respectively, as determined by immunohistochemistry. Both in vivo DTI and immunohistchemistry suggested more severe damage to the axons closer to the primary injury than to the axons distant to it at two weeks post retinal ischemia in the mouse.
Although the time courses of λ∥ and λ⊥ of the Wallerian degeneration in ON after transient retinal ischemia were presented previously by our group (Song and others 2003; Sun and others 2006a), the change in the distal axons, the optic tract, has not been reported. Since Wallerian degeneration plays a significant role in many CNS diseases, the capability of tracking the temporal and spatial progression of Wallerian degeneration could provide useful information on the CNS disease evolution (Ciccarelli and others 2003; Narayanan and others 2006). This study demonstrated the utility of λ∥ and λ⊥ for evaluating the temporal and spatial evolution of CNS Wallerian degeneration. The degeneration of mouse visual pathway resulting from retinal ischemia exhibited a pattern of axonal damage followed by the myelin damage as demonstrated by the early decrease of λ∥ (at 3 − 28 days) followed by the later increase in λ⊥ (at 9 − 28 days). The agreement between both DTI and immunohistochemistry suggested the high sensitivity of in vivo DTI in reflecting the dynamic changes of the Wallerian degeneration in CNS.
Topographic representation of visual fields from the retina to the brain is a central feature of vision. In human, half of the retinal ganglion cell axons project to the contralateral cortex and half of them project to the ipsilateral cortex. In contrast, about 95% mouse retinal ganglion cell axons project to the contralateral cortex (Lambot and others 2005). Our study demonstrated that after the unilateral retinal damage, contralateral optic nerve and ipsilateral optic tract have diffusion characteristics similar to those from the corresponding regions of healthy mice. On the other hand, significant damage to contralateral optic tract was demonstrated by both DTI and immunohistochemistry. Although the retinal topography has been studied extensively, to the best of our knowledge, detection of MRI diffusion changes in mouse contralateral optic tract after unilateral retinal damage has not been described previously. This novel finding suggests that in vivo DTI evaluation of spatiotemporal axonal degeneration in mammalian visual pathways is feasible.
In this study, the optic nerve showed more severe damage than the optic tract following transient retinal ischemia. Different degrees of injury severity between proximal and distal sections of axons undergoing Wallerian degeneration have been reported to be dependent on the etiology of the primary insults. For example, it was demonstrated that the transection of the sciatic nerve introduced a more severe axonal fragmentation in proximal stump of the nerve than that in the distal stump. In contrast, crushing the nerve introduced more severe axonal fragmentation in distal stumps (Beirowski and others 2005). In human CNS diseases, primary insults to axons may originate from a wide range of pathological mechanisms. Thus, the progression of the secondary degeneration is likely to be different under different circumstances. Diffusion tensor imaging may provide a new means to better understand the evolution of Wallerian degeneration in CNS of humans.
Our group has employed various pathology specific mouse models of white matter injury to test the utility of λ∥ and λ⊥ for detecting and differentiating axonal and myelin damages previously. High correlation between decreased λ∥ and axonal damage, and increased λ⊥ and myelin damage have been demonstrated in mouse optic nerve (Song and others 2003; Song and others 2002; Sun and others 2006a; Sun and others 2007), optic tract (Sun and others 2007), corpus callosum (Song and others 2005; Sun and others 2006b), and spinal cord (Budde and others 2007; Kim and others 2006a; Kim and others 2007; Loy and others 2007). Although using λ∥ and λ⊥ as biomarkers of axonal and myelin damages seems promising, one should keep in mind that these quantities are reliable only if the first eigenvector is still parallel with myelinated axons. This assumption may not be valid in crossing or fanning fiber tracts (Hess and others 2006; Kim and others 2006b; Pierpaoli and others 2001), where λ∥ and λ⊥ may not correctly represent the diffusivities along or perpendicular to a particular axonal fiber tract. Since the white matter structures of human brains, for example, are apparently more complicated than those in mouse brains, the fiber crossing or fanning may introduce additional challenges in applying this technique in the human brain studies.
The slice thickness of 0.5 mm with in-plane resolution of 117×117 μm2 employed in this study is among the highest in vivo DTI of mouse brains in the literature (Ahmad and others 2005; Boretius and others 2007; Guilfoyle and others 2003; Harsan and others 2007; Harsan and others 2006; Nair and others 2005; Sow and others 2006), nonetheless, it still suffered the unavoidable partial volume effect for the mouse white matter tracts. However, consistency between the DTI estimated injury and the histology findings suggests that the partial volume effect may not adversely affect our results. This may be due to the carefully and reproducibly planed image slices using the exact anatomical landmarks on the sagittal and axial scouts of each mouse brain ensuring a consistent slice location of the tract from each mouse (Fig. 1). We suspect that the partial volume effects did not diminish the capability of DTI to detect damage to optic nerve or tract of Wallerian degeneration presented in this study although one has to keep the partial volume effect into account in more detailed mechanistic studies.
In conclusion, our study showed that in vivo DTI, confirmed by immunohistochemistry, detected damages to ipsilateral optic nerve and contralateral tract resulting from unilateral transient retinal ischemia. Results herein accurately reflected the known mouse topographic feature of visual fields from the retina to the brain. Of particular relevance, our study demonstrated that λ∥ and λ⊥ derived from DTI are capable of assessing the relative severities of axonal and myelin damage. Our findings support the potential of using DTI to non-invasively evaluate axonal degeneration in the central nervous system, which will significantly improve the accuracy of diagnosis and prognosis in patients with CNS diseases.
Acknowledgments
This study was supported partly by grants provided by NMSS RG-3864 and CA-1012, and NIH R01-NS-054194.
Footnotes
Publisher's Disclaimer: This is a PDF file of an unedited manuscript that has been accepted for publication. As a service to our customers we are providing this early version of the manuscript. The manuscript will undergo copyediting, typesetting, and review of the resulting proof before it is published in its final citable form. Please note that during the production process errors may be discovered which could affect the content, and all legal disclaimers that apply to the journal pertain.
Reference
- Aboul-Enein F, Weiser P, Hoftberger R, Lassmann H, Bradl M. Transient axonal injury in the absence of demyelination: a correlate of clinical disease in acute experimental autoimmune encephalomyelitis. Acta Neuropathol (Berl) 2006;111(6):539–47. doi: 10.1007/s00401-006-0047-y. [DOI] [PubMed] [Google Scholar]
- Ahmad I, Lope-Piedrafita S, Bi X, Hicks C, Yao Y, Yu C, Chaitkin E, Howison CM, Weberg L, Trouard TP and others Allopregnanolone treatment, both as a single injection or repetitively, delays demyelination and enhances survival of Niemann-Pick C mice. J Neurosci Res. 2005;82(6):811–21. doi: 10.1002/jnr.20685. [DOI] [PubMed] [Google Scholar]
- Arfanakis K, Haughton VM, Carew JD, Rogers BP, Dempsey RJ, Meyerand ME. Diffusion tensor MR imaging in diffuse axonal injury. AJNR Am J Neuroradiol. 2002;23(5):794–802. [PMC free article] [PubMed] [Google Scholar]
- Basser PJ, Pierpaoli C. Microstructural and physiological features of tissues elucidated by quantitative-diffusion-tensor MRI. J Magn Reson B. 1996;111(3):209–19. doi: 10.1006/jmrb.1996.0086. [DOI] [PubMed] [Google Scholar]
- Beaulieu C, Does MD, Snyder RE, Allen PS. Changes in water diffusion due to Wallerian degeneration in peripheral nerve. Magn Reson Med. 1996;36(4):627–31. doi: 10.1002/mrm.1910360419. [DOI] [PubMed] [Google Scholar]
- Beirowski B, Adalbert R, Wagner D, Grumme DS, Addicks K, Ribchester RR, Coleman MP. The progressive nature of Wallerian degeneration in wild-type and slow Wallerian degeneration (WldS) nerves. BMC Neurosci. 2005;6(1):6. doi: 10.1186/1471-2202-6-6. [DOI] [PMC free article] [PubMed] [Google Scholar]
- Beirowski B, Berek L, Adalbert R, Wagner D, Grumme DS, Addicks K, Ribchester RR, Coleman MP. Quantitative and qualitative analysis of Wallerian degeneration using restricted axonal labelling in YFP-H mice. J Neurosci Methods. 2004;134(1):23–35. doi: 10.1016/j.jneumeth.2003.10.016. [DOI] [PubMed] [Google Scholar]
- Bjartmar C, Battistuta J, Terada N, Dupree E, Trapp BD. N-acetylaspartate is an axon-specific marker of mature white matter in vivo: a biochemical and immunohistochemical study on the rat optic nerve. Ann Neurol. 2002;51(1):51–8. doi: 10.1002/ana.10052. [DOI] [PubMed] [Google Scholar]
- Boretius S, Wurfel J, Zipp F, Frahm J, Michaelis T. High-field diffusion tensor imaging of mouse brain in vivo using single-shot STEAM MRI. J Neurosci Methods. 2007;161(1):112–7. doi: 10.1016/j.jneumeth.2006.10.019. [DOI] [PubMed] [Google Scholar]
- Budde MD, Kim JH, Liang HF, Schmidt RE, Russell JH, Cross AH, Song SK. Toward accurate diagnosis of white matter pathology using diffusion tensor imaging. Magn Reson Med. 2007;57(4):688–95. doi: 10.1002/mrm.21200. [DOI] [PubMed] [Google Scholar]
- Ciccarelli O, Werring DJ, Barker GJ, Griffin CM, Wheeler-Kingshott CA, Miller DH, Thompson AJ. A study of the mechanisms of normal-appearing white matter damage in multiple sclerosis using diffusion tensor imaging--evidence of Wallerian degeneration. J Neurol. 2003;250(3):287–92. doi: 10.1007/s00415-003-0992-5. [DOI] [PubMed] [Google Scholar]
- Coleman M. Axon degeneration mechanisms: commonality amid diversity. Nat Rev Neurosci. 2005;6(11):889–98. doi: 10.1038/nrn1788. [DOI] [PubMed] [Google Scholar]
- De Stefano N, Matthews PM, Narayanan S, Francis GS, Antel JP, Arnold DL. Axonal dysfunction and disability in a relapse of multiple sclerosis: longitudinal study of a patient. Neurology. 1997;49(4):1138–41. doi: 10.1212/wnl.49.4.1138. [DOI] [PubMed] [Google Scholar]
- Franklin KB, Paxinos G. The mouse brain in stereotaxic coordinates. Academic Press; San Diego: 1997. [Google Scholar]
- Gonen O, Catalaa I, Babb JS, Ge Y, Mannon LJ, Kolson DL, Grossman RI. Total brain N-acetylaspartate: a new measure of disease load in MS. Neurology. 2000;54(1):15–9. doi: 10.1212/wnl.54.1.15. [DOI] [PubMed] [Google Scholar]
- Guilfoyle DN, Helpern JA, Lim KO. Diffusion tensor imaging in fixed brain tissue at 7.0 T. NMR Biomed. 2003;16(2):77–81. doi: 10.1002/nbm.814. [DOI] [PubMed] [Google Scholar]
- Gupta RK, Saksena S, Hasan KM, Agarwal A, Haris M, Pandey CM, Narayana PA. Focal Wallerian degeneration of the corpus callosum in large middle cerebral artery stroke: serial diffusion tensor imaging. J Magn Reson Imaging. 2006;24(3):549–55. doi: 10.1002/jmri.20677. [DOI] [PubMed] [Google Scholar]
- Harsan LA, Poulet P, Guignard B, Parizel N, Skoff RP, Ghandour MS. Astrocytic hypertrophy in dysmyelination influences the diffusion anisotropy of white matter. J Neurosci Res. 2007;85(5):935–44. doi: 10.1002/jnr.21201. [DOI] [PubMed] [Google Scholar]
- Harsan LA, Poulet P, Guignard B, Steibel J, Parizel N, de Sousa PL, Boehm N, Grucker D, Ghandour MS. Brain dysmyelination and recovery assessment by noninvasive in vivo diffusion tensor magnetic resonance imaging. J Neurosci Res. 2006;83(3):392–402. doi: 10.1002/jnr.20742. [DOI] [PubMed] [Google Scholar]
- Hasan KM, Parker DL, Alexander AL. Comparison of gradient encoding schemes for diffusion-tensor MRI. J Magn Reson Imaging. 2001;13(5):769–80. doi: 10.1002/jmri.1107. [DOI] [PubMed] [Google Scholar]
- Hess CP, Mukherjee P, Han ET, Xu D, Vigneron DB. Q-ball reconstruction of multimodal fiber orientations using the spherical harmonic basis. Magn Reson Med. 2006;56(1):104–17. doi: 10.1002/mrm.20931. [DOI] [PubMed] [Google Scholar]
- Khong PL, Zhou LJ, Ooi GC, Chung BH, Cheung RT, Wong VC. The evaluation of Wallerian degeneration in chronic paediatric middle cerebral artery infarction using diffusion tensor MR imaging. Cerebrovasc Dis. 2004;18(3):240–7. doi: 10.1159/000079961. [DOI] [PubMed] [Google Scholar]
- Kim JH, Budde MD, Liang HF, Klein RS, Russell JH, Cross AH, Song SK. Detecting axon damage in spinal cord from a mouse model of multiple sclerosis. Neurobiol Dis. 2006a;21(3):626–32. doi: 10.1016/j.nbd.2005.09.009. [DOI] [PubMed] [Google Scholar]
- Kim JH, Loy DN, Liang HF, Trinkaus K, Schmidt RE, Song SK. Noninvasive diffusion tensor imaging of evolving white matter pathology in a mouse model of acute spinal cord injury. Magn Reson Med. 2007;58(2):253–60. doi: 10.1002/mrm.21316. [DOI] [PubMed] [Google Scholar]
- Kim M, Ronen I, Ugurbil K, Kim DS. Spatial resolution dependence of DTI tractography in human occipito-callosal region. Neuroimage. 2006b;32(3):1243–9. doi: 10.1016/j.neuroimage.2006.06.006. [DOI] [PubMed] [Google Scholar]
- Kuhn MJ, Johnson KA, Davis KR. Wallerian degeneration: evaluation with MR imaging. Radiology. 1988;168(1):199–202. doi: 10.1148/radiology.168.1.3380957. [DOI] [PubMed] [Google Scholar]
- Lambot MA, Depasse F, Noel JC, Vanderhaeghen P. Mapping labels in the human developing visual system and the evolution of binocular vision. J Neurosci. 2005;25(31):7232–7. doi: 10.1523/JNEUROSCI.0802-05.2005. [DOI] [PMC free article] [PubMed] [Google Scholar]
- Loy DN, Kim JH, Xie M, Schmidt RE, Trinkaus K, Song SK. Diffusion tensor imaging predicts hyperacute spinal cord injury severity. J Neurotrauma. 2007;24(6):979–90. doi: 10.1089/neu.2006.0253. [DOI] [PubMed] [Google Scholar]
- Meier DS, Weiner HL, Khoury SJ, Guttmann CR. Magnetic resonance imaging surrogates of multiple sclerosis pathology and their relationship to central nervous system atrophy. J Neuroimaging. 2004;14(3 Suppl):46S–53S. doi: 10.1177/1051228404266268. [DOI] [PubMed] [Google Scholar]
- Nair G, Tanahashi Y, Low HP, Billings-Gagliardi S, Schwartz WJ, Duong TQ. Myelination and long diffusion times alter diffusion-tensor-imaging contrast in myelin-deficient shiverer mice. Neuroimage. 2005;28(1):165–74. doi: 10.1016/j.neuroimage.2005.05.049. [DOI] [PMC free article] [PubMed] [Google Scholar]
- Narayanan S, Francis SJ, Sled JG, Santos AC, Antel S, Levesque I, Brass S, Lapierre Y, Sappey-Marinier D, Pike GB and others Axonal injury in the cerebral normal-appearing white matter of patients with multiple sclerosis is related to concurrent demyelination in lesions but not to concurrent demyelination in normal-appearing white matter. Neuroimage. 2006;29(2):637–42. doi: 10.1016/j.neuroimage.2005.07.017. [DOI] [PubMed] [Google Scholar]
- Pierpaoli C, Barnett A, Pajevic S, Chen R, Penix LR, Virta A, Basser P. Water diffusion changes in Wallerian degeneration and their dependence on white matter architecture. Neuroimage. 2001;13(6 Pt 1):1174–85. doi: 10.1006/nimg.2001.0765. [DOI] [PubMed] [Google Scholar]
- Sawlani V, Gupta RK, Singh MK, Kohli A. MRI demonstration of Wallerian degeneration in various intracranial lesions and its clinical implications. J Neurol Sci. 1997;146(2):103–8. doi: 10.1016/s0022-510x(96)00299-7. [DOI] [PubMed] [Google Scholar]
- Song SK, Sun SW, Ju WK, Lin SJ, Cross AH, Neufeld AH. Diffusion tensor imaging detects and differentiates axon and myelin degeneration in mouse optic nerve after retinal ischemia. Neuroimage. 2003;20(3):1714–22. doi: 10.1016/j.neuroimage.2003.07.005. [DOI] [PubMed] [Google Scholar]
- Song SK, Sun SW, Ramsbottom MJ, Chang C, Russell J, Cross AH. Dysmyelination revealed through MRI as increased radial (but unchanged axial) diffusion of water. Neuroimage. 2002;17(3):1429–36. doi: 10.1006/nimg.2002.1267. [DOI] [PubMed] [Google Scholar]
- Song SK, Yoshino J, Le TQ, Lin SJ, Sun SW, Cross AH, Armstrong RC. Demyelination increases radial diffusivity in corpus callosum of mouse brain. Neuroimage. 2005;26(1):132–40. doi: 10.1016/j.neuroimage.2005.01.028. [DOI] [PubMed] [Google Scholar]
- Sow A, Lamant M, Bonny JM, Larvaron P, Piaud O, Lecureuil C, Fontaine I, Saleh MC, Garcia Otin AL, Renou JP and others Oligodendrocyte differentiation is increased in transferrin transgenic mice. J Neurosci Res. 2006;83(3):403–14. doi: 10.1002/jnr.20741. [DOI] [PubMed] [Google Scholar]
- Sun SW, Liang HF, Le TQ, Armstrong RC, Cross AH, Song SK. Differential sensitivity of in vivo and ex vivo diffusion tensor imaging to evolving optic nerve injury in mice with retinal ischemia. Neuroimage. 2006a;32(3):1195–204. doi: 10.1016/j.neuroimage.2006.04.212. [DOI] [PubMed] [Google Scholar]
- Sun SW, Liang HF, Schmidt RE, Cross AH, Song SK. Selective vulnerability of cerebral white matter in a murine model of multiple sclerosis detected using diffusion tensor imaging. Neurobiol Dis. 2007;28(1):30–8. doi: 10.1016/j.nbd.2007.06.011. [DOI] [PMC free article] [PubMed] [Google Scholar]
- Sun SW, Liang HF, Trinkaus K, Cross AH, Armstrong RC, Song SK. Noninvasive detection of cuprizone induced axonal damage and demyelination in the mouse corpus callosum. Magn Reson Med. 2006b;55(2):302–8. doi: 10.1002/mrm.20774. [DOI] [PubMed] [Google Scholar]
- Sun SW, Neil JJ, Song SK. Relative indices of water diffusion anisotropy are equivalent in live and formalin-fixed mouse brains. Magn Reson Med. 2003;50(4):743–8. doi: 10.1002/mrm.10605. [DOI] [PubMed] [Google Scholar]
- Thomalla G, Glauche V, Koch MA, Beaulieu C, Weiller C, Rother J. Diffusion tensor imaging detects early Wallerian degeneration of the pyramidal tract after ischemic stroke. Neuroimage. 2004;22(4):1767–74. doi: 10.1016/j.neuroimage.2004.03.041. [DOI] [PubMed] [Google Scholar]
- Thomalla G, Glauche V, Weiller C, Rother J. Time course of wallerian degeneration after ischaemic stroke revealed by diffusion tensor imaging. J Neurol Neurosurg Psychiatry. 2005;76(2):266–8. doi: 10.1136/jnnp.2004.046375. [DOI] [PMC free article] [PubMed] [Google Scholar]


