

Abstract
Results from recent studies suggest that chronic cigarette smoking is associated with increased white matter volume in the brain as determined by in vivo neuroimaging. We used diffusion tensor imaging to examine the microstructural integrity of the white matter in 10 chronic smokers and 10 nonsmokers. All individuals were healthy, without histories of medical or psychiatric illness. Fractional anisotropy (FA) and trace were measured in the genu, body, and splenium of the corpus callosum. FA provides a measure of directional versus nondirectional water diffusion, whereas trace provides a measure of nondirectional water diffusion. Lower FA and higher trace values are considered to reflect less brain integrity. Voxel-based morphometry was used to define volumes in each of these regions of the corpus callosum. Chronic smokers exhibited significantly higher FA in the body and whole corpus callosum and a strong trend for higher FA in the splenium compared with nonsmokers. FA did not differ between groups in the genu, and neither trace nor white matter volumes differed between groups in any of the regions of interest. When subdivided by Fagerström score (low vs. high), the low Fagerström group exhibited significantly higher FA in the body of the corpus callosum compared with the high Fagerström group and the nonsmokers. These results suggest that, among healthy adults, lower exposure to cigarette smoking is associated with increased microstructural integrity of the white matter compared with either no exposure or higher exposure. Additional studies are needed to further explore differences in white matter integrity between smokers and nonsmokers.
Introduction
Cigarette smoking has remarkably diverse effects on the central nervous system (CNS). Nicotine is an agonist within the cholinergic neurotransmitter system, with high affinity for the α4β2 nicotinic receptor subtype present throughout the CNS (for review, see Wonnacott, Sidhpura, & Balfour, 2005). Nicotinic receptors are widely distributed within the CNS, and nicotine plays a neuromodulatory role in the cholinergic system, with nicotinic stimulation resulting in multiple interactions with other neurotransmitter systems and alterations in cellular activities (Dani, 2001; Jones, Sudweeks, & Yakel, 1999). These factors reflect the complexity of nicotinic effects in the CNS and also likely explain the beneficial effects of acute nicotine administration on attention, memory, and other cognitive abilities that are evident in both nonsmokers and experienced smokers (Bell, Taylor, Singleton, Henningfield, & Heishman, 1999; Foulds et al., 1996; Heishman, 1999; Waters & Sutton, 2000).
The impact of chronic cigarette smoking on CNS function differs from the acute effects of smoking. Multiple studies, including work from our own lab, have revealed that chronic cigarette smoking is associated with poorer cognitive outcome. Cognitive deficits have been reported across age groups of chronic smokers, with stronger effects evident among older smokers (Chen et al., 2003; Paul et al., 2006; Reitz, Luchsinger, Tang, & Mayeux, 2005; Stewart Deary, Fowkes, & Price, 2006). These deleterious effects may be the result of cigarette smokers’ inhalation of multiple chemicals, not just nicotine, and these additional factors exhibit neuromodulatory and neurovascular effects that may be directly neurotoxic or lead to secondary CNS damage with chronic exposure. For example, cigarette smoking is a well-known risk factor for the development of cerebrovascular disease (Feldmann et al., 2005; Goldstein et al., 2006; Sacco et al., 2006).
The adverse effects of chronic cigarette smoking on brain structure and function were examined by Brody et al. (2004) using in vivo magnetic resonance imaging (MRI). In that study, regional brain gray matter volumes were determined using manual tracing and voxel-based morphometry (VBM) among a small cohort of individuals meeting DSM-IV criteria for nicotine dependence. Results revealed that smokers exhibited reduced volumes of the dorsolateral prefrontal cortex, ventrolateral prefrontal cortex, and anterior cingulate cortex compared with nonsmokers. Further, prefrontal cortex volumes defined by VBM were significantly inversely correlated with smoking exposure (i.e., pack-year smoking history). The magnitude of difference in brain gray matter volumes (11.9% to 21.2% smaller in smokers) and the relationships between volumes and smoking exposure are noteworthy. These findings provide evidence that cortical gray matter regions of the brain are negatively affected by chronic cigarette smoking. Further, evidence of reduced gray matter volume is consistent with the results of studies demonstrating poorer cognitive outcomes associated with long-term cigarette smoking (Chen et al., 2003; Paul et al., 2006; Reitz et al., 2005; Stewart et al., 2006).
Less is known about the impact of cigarette smoking on the white matter of the brain. In a study aimed at defining the impact of chronic alcohol abuse and comorbid nicotine dependence on regional brain volumes, cigarette smokers (collapsed across alcohol status) exhibited significantly larger temporal and frontal white matter volumes compared with nonsmokers (Gazdzinski et al., 2005). These results were in contrast to the independent effects of alcohol, which were associated with reduced white matter volumes. The findings also contrasted with the effects of smoking status on gray matter volumes, which revealed more significant atrophy among alcohol-dependent individuals, a finding consistent with the results from Brody et al. (2004). The authors hypothesized that the increased white matter volumes among the smokers may reflect cytotoxic swelling or the effects of interstitial leakage of fluid from plasma. Regardless of the mechanism, the impact of chronic smoking on the macrostructure of the white matter appears to differ from the effects of cigarette smoking on the gray matter of the brain parenchyma.
It remains unclear if abnormalities in the white matter of chronic smokers are evident at the microstructural level as visualized using diffusion tensor imaging (DTI). DTI is a relatively novel noninvasive imaging methodology that measures the direction-dependent rate of water diffusion at each point in an image. One scalar measure of diffusion at a given point is the average rate of diffusion taken over all directions, or trace. Other measures derive from the linear orientation of homogeneous white matter tracts resulting in faster diffusion along tracts than across them. A measure of this directional variability is fractional anisotropy (FA). Alterations in the integrity of the white matter are often reflected by changes in FA and trace, and these measures appear to have greater sensitivity to alterations in the integrity of the white matter compared with traditional structural imaging (for review, see Catani, 2006).
To our knowledge, no study has examined DTI metrics in the brain among chronic cigarette smokers, yet the methodology represents an attractive imaging tool because it is highly sensitive to microstructural alterations in the brain, particularly within the white matter. Given the findings by Gazdzinski et al. (2005) that cigarette smokers exhibit significantly larger white matter volumes than nonsmokers, we were interested in determining whether similar effects would be evident within the microstructural integrity of the brain. In the present study, we examined microstructural white matter integrity in a cohort of regular smokers compared with age- and education-matched nonsmokers. White matter integrity was examined using VBM and DTI of the corpus callosum.
Method
Data from 20 individuals archived in the Brain Resource International Database (BRID; Gordon, 2003) were included in the present study. The group included 10 smokers (6 males and 4 females) and 10 nonsmokers (4 males, 6 females). The demographic data are shown in Table 1. The BRID is a comprehensive database of brain function containing data from subjects recruited at six primary sites throughout the world (two sites in the United States, two sites in Australia, one site in the Netherlands, and one site in the United Kingdom). For the purpose of the present study, only individuals recruited from one of the two sites in Australia were included; these were the only individuals among the BRID cohort to complete the DTI imaging protocol.
Table 1.
Demographic results by smoking status
| Group |
||||
|---|---|---|---|---|
| Characteristic | Nonsmokers (6 male, 4 female) | Smokers (4 male, 6 female) | Low Fagerström (3 male, 2 female) | High Fagerström (1 male, 4 female) |
| Age (years) | 38.6 (12.5) | 38.5 (14.2) | 32.4 (17.4) | 44.8 (7.4) |
| Education (years) | 12.3 (1.4) | 12.8 (1.8) | 14.0 (1.5) | 11.6 (1.1) |
| Fagerström Test for Nicotine | NA | 3.6 (2.2) | 1.6 (.89) | 5.6 (.89) |
| Dependence | ||||
| Depression | 2.0 (2.9) | 2.6 (1.9) | 2.4 (2.0) | 2.8 (2.0) |
| Anxiety | 1.1 (1.0) | 1.3 (1.7) | .60 (.54) | 2.0 (2.3) |
| Stress | 2.7 (3.2) | 4.2 (2.0) | 3.4 (2.4) | 5.0 (1.4) |
| Body mass index | 23.8 (8.2) | 23.9 (2.6) | - | - |
Note. All values are means with standard deviations.
All subjects were healthy. Individuals were excluded from the database if they reported any history of a medical (e.g., cardiac disease, thyroid disease) or neurological disorder (e.g., stroke), mental retardation, drug abuse or dependence (aside from nicotine abuse or dependence), or psychiatric illness. In addition, all individuals completed the Somatic and Psychological Health Report (Hickie, Davenport, Naismith, & Scott, 2001) to identify subclinical depression and anxiety. Web-based questionnaires were used to obtain basic demographic data such as subjects’ age, sex, education, and current mood status. Participants signed a written consent form prior to enrollment and received financial compensation for their participation. Initial data collection for the BRID was approved by local institutional review boards.
Smoking status was determined using the Fagerström Test for Nicotine Dependence (FTND; Heatherton, Kozlowski, Frecker, & Fagerström 1991). Individuals reporting a score of 1 of higher were included in the smoking group. To receive at least a score of 1, individuals had to endorse at least one of the items from the FTND. Overall, a score of 1 on this scale represents a minimum degree of nicotine dependence. The distribution of scores on the scale is provided in Table 2. All nonsmokers reported a score of 0 on the scale. The nonsmokers were selected among individuals with data archived in the BRID, who had completed the DTI and volumetric MRI acquisition, and who were individually matched against the smoking sample on age and education. Information on possible past smoking among the nonsmokers was not available from the questionnaire. Self-reported symptoms of depression, anxiety, and stress were quantified using the Depression, Anxiety, and Stress Scale (Lovibond & Lovibond, 1995).
Table 2.
Fagerström Test for Nicotine Dependence: Responses for current smokers
| Item | Responses | |
|---|---|---|
| How soon after you wake up do you smoke a cigarette? | 0-5 min (n=0) 6-30 min (n=5) | 31-60 min (n=4) > 60 min (n=1) |
| Do you find it difficult not to smoke in places where you shouldn’t, such as in church, on the bus, in school, or at the library? | Yes (n=1) | No (n=9) |
| Which cigarette would you find it most difficult to give up? | First of the day (n=3) | Any other (n=7) |
| How many cigarettes per day do you smoke? | 10 or less (n=4) 11-20 (n=3) | 21-30 (n=3) 31 or more (n=0) |
| Do you smoke more frequently during the first hours after waking than during the rest of the day? | Yes (n=4) | No (n=6) |
| Do you still smoke if you are so sick that you are in bed most of the day? | Yes (n=5) | No (n=5) |
None of the participants reported daily consumption of alcohol, and none of the subjects reported experiencing social consequences secondary to alcohol, or any history with difficulty ceasing alcohol intake. The distribution of smokers who considered themselves “regular” consumers of alcohol (7 out of 9) differed slightly compared with nonsmokers (4 out of 9). Alcohol history was not available from one individual in each group.
Image acquisition and analysis (Table 3)
Table 3.
Imaging data by smoking status
| Group |
||||
|---|---|---|---|---|
| Brain region | Nonsmokers | All smokers | Low Fagerström | High Fagerström |
| FA - whole corpus callosum | .56 (.03) | .59 (.02) | .60 (.01) | .59 (.02) |
| FA - genu | .46 (.05) | .49 (.04) | .50 (.04) | .47 (.03) |
| FA - body | .58 (.04) | .64 (.03) | .66 (.01) | .61 (.03) |
| FA - splenium | .61 (.02) | .63 (.02) | .62 (.03) | .64 (.02) |
| Trace - whole corpus callosum | .80 (.02) | .82 (.03) | .83 (.03) | .80 (.02) |
| Trace - genu | .78 (.03) | .77 (.03) | .78 (.02) | .76 (.03) |
| Trace - body | .80 (.04) | .83 (.06) | .87 (.04) | .79 (.04) |
| Trace - splenium | .81 (.02) | .83 (.06) | .84 (.05) | .84 (.04) |
| Volume - whole corpus callosum (ml) | 18.3 (2.2) | 17.9 (2.5) | 18.1 (2.6) | 17.7 (2.6) |
| Volume - genu (ml) | 5.5 (.90) | 5.5 (.71) | 5.7 (.65) | 5.3 (.80) |
| Volume - body (ml) | 4.3 (.60) | 4.1 (.64) | 4.1 (.70) | 4.1 (.66) |
| Volume - splenium (ml) | 8.4 (.90) | 8.2 (1.2) | 8.3 (1.3) | 8.2 (1.2) |
Note. All values are means with standard deviations.
Neuroimaging was conducted using a 1.5 Tesla Siemens (Erlangen, Germany) Sonata at Perrett Imaging, Flinders University, Australia. 3D T1-weighted images were acquired in the sagittal plane using a 3D MPRAGE sequence (TR=9.7 ms; TE=4 ms; Echo train=7; Flip Angle=12°; TI=200 ms; NEX=1). A total of 180 contiguous 1-mm slices were acquired with a 256×256 matrix with an in-plane resolution of 1×1 mm resulting in isotropic voxels. Proton density and spin-echo (SE) images were acquired using a dual echo sequence (TR=7530 ms; TE=15/105 ms; Echo train=7; Flip Angle=180°; NEX=1). A total of 45 contiguous 1-mm slices were acquired in an axial orientation with an in-plane matrix of 256×256 at a resolution of 0.86×0.86 mm. DTI was acquired using a DTI-EPI sequence (TR=160 ms; TE=88 ms; Fat Saturation; NEX=4). A baseline image (b=0) and 12 different diffusion orientations were acquired with a b-value of 1250. A total of 32 contiguous slices of 6.5 mm were acquired with an in-plane matrix of 128×128 at a resolution of 1.72×1.72 mm.
Diffusion tensor analysis
DTI data were processed using a custom written routine (Grieve, Williams, Paul, Clark, & Gordon, 2007) in MATLAB 6.5 (MathWorks, Natick, Massachusetts). Trace apparent diffusion coefficient (TrADC) and FA images were calculated in native space from the b=0 image and 12 diffusion-weighted images (b=1250 s cm-2). FA was defined as follows:
where λn=the eigenvalues describing the diffusion tensor, and λav is the mean diffusivity ([λ1+λ2+λ3]/3).
Corpus callosum parcellation
A hand-drawn region of interest was drawn using a normalized, averaged, and high-resolution (1 mm3)-smoothed white matter segmented image created from 223 individuals from the BRID dataset in a previous work (Grieve, Clark, Williams, Peduto, & Gordon, 2005). The position of the division between the anterior portion of the genu and the frontal pericallosal tissue, and between the posterolateral extent of the splenium and the parietal pericallosal tissue was defined by a plane-positioned bordering the medial 30% of the brain diameter (Pfefferbaum et al., 2000). The genu was defined as the portion of the corpus callosum region of interest anterior to a plane through the body of the corpus callosum at the MNI (Montreal Neurological Institute) coordinate y=17 mm. The splenium was defined as the portion of the corpus callosum posterior to a plane at the MNI coordinate y=-18 mm (Figure 1k-l).
Figure 1.
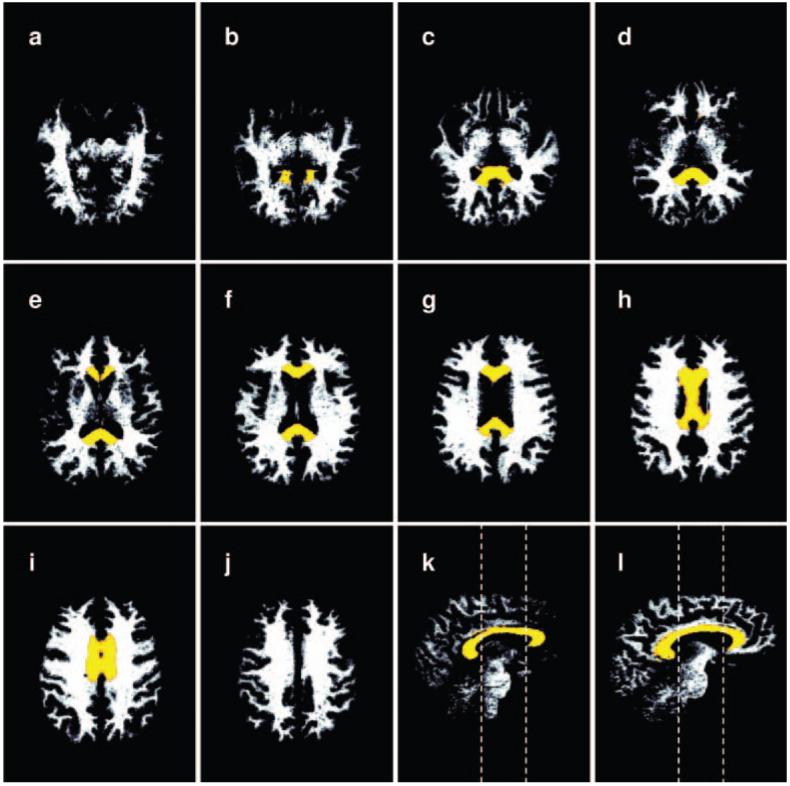
A series of segmented white matter images in the native space of the T1-weighted images from which they were calculated. The corpus callosum (CC) region of interest is superimposed in color. Volume measurements of the CC were performed by applying the CC masks to these white matter images. The CC ROI has been morphed from the MNI space where it was defined to the native space of the T1 image prior to application on the fractional anisotropy images. (a-j) Axial slices in an inferior to superior direction. (k) Paramedian sagittal slice offset 2 mm from the sagittal plane. (l) Sagittal slice offset 10 mm from the sagittal plane. Dashed lines in k-l indicate the caudal and rostral limits of the body of the CC.
Segmentation of T1 MRI data
Coregistration and normalization was performed using Statistical Parametric Mapping (SPM2; Wellcome Department of Imaging Neuroscience, London; www.fil.ion.ucl.ac.uk/spm), running under MATLAB 6.5 using an optimized VBM protocol as described previously (Ashburner & Friston, 2000; Good et al., 2001; Grieve et al., 2005). The segmentation protocol used a cluster analysis method to separate pixels based on intensity differences, together with a priori knowledge of spatial tissue distribution patterns in normal subjects (Ashburner & Friston, 2000; Friston, Holmes, Poline, Price, & Frith, 1996; Good et al., 2001). Customized gray matter, white matter, and cerebrospinal fluid template images were created from the averaged T1 images of 223 individuals in the BRID database (Grieve et al., 2005).
Creation of custom CC masks for FA and volume analysis
Following segmentation and normalization of the white matter of each subject image to MNI space, corpus callosum masks were created using a threshold of white matter probability >.4. The white matter data and the modified corpus callosum region of interest masks were transformed to “native” T1 space using the inverse of the deformation fields created through the normalization process. This operation was performed using the deformation toolbox in SPM2 (written by John Ashburner, www.fil.ion.ucl.ac.uk/~john). White matter volumes were calculated for each corpus callosum region of interest using the segmented white matter data in native space and the transformed corpus callosum masks. Figure 1 shows the segmented white matter data in the native space of the T1-weighted images with the corpus callosum region of interest superimposed in color. The native T1 image and the T2 image were then coregistered. Similarly, the T2 image was coregistered with the trace ADC image. The transforms from these two steps were then applied to both the segmented white matter data and to the corpus callosum masks, morphing these images to the native space of the DTI dataset. Figure 2 shows FA and trace ADC data from a representative subject. Columns 3 and 4 of Figure 2 show the white matter and corpus callosum region of interest superimposed on the FA dataset. Average FA and trace ADC values were then calculated using both the custom corpus callosum masks and the segmented white matter to define the region of interest. The use of the white matter image as a mask ensures FA was calculated from white matter pixels only. Figures 1a-d show axial and sagittal slices of a representative corpus callosum mask superimposed on the matching segmented white matter (Figure 1a), T2 (Figure 1b), trace ADC (Figure 1c), and FA dataset (Figure 1d).
Figure 2.
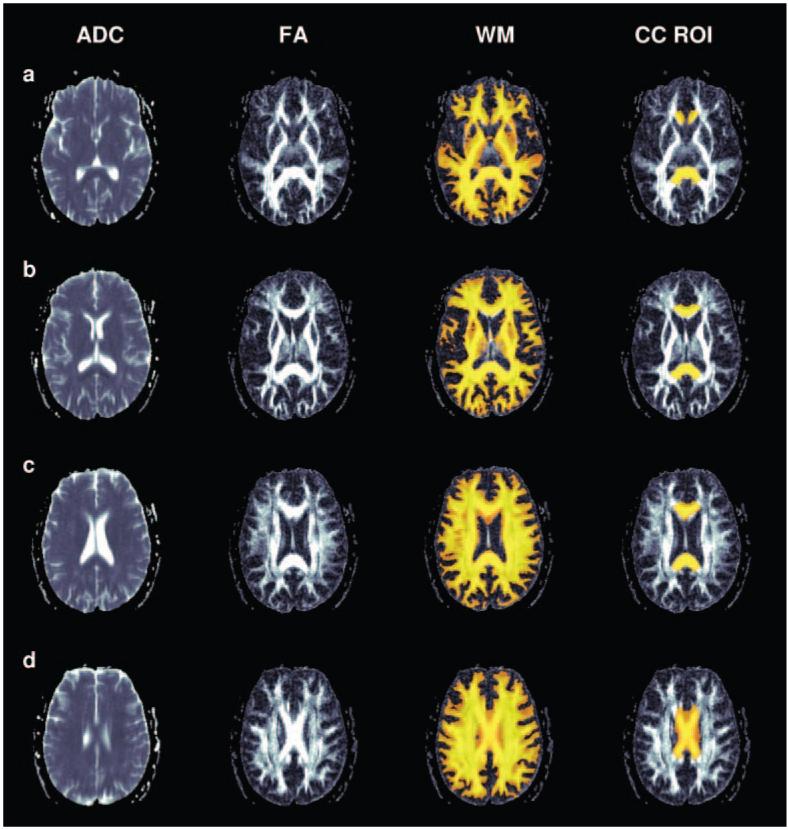
A series of slices from a representative individual from inferior to superior. Column 1 shows trace apparent diffusion coefficient (ADC) maps; column 2, fractional anisotropy (FA) maps. Columns 3 and 4 show FA maps with white matter (WM) and the CC region of interest (CC ROI) superimposed in color.
Data analyses
Preliminary analyses revealed no significant differences on the imaging variables between male and female smokers. Therefore, these data were pooled. FA, trace, and volumetric indices were contrasted between smokers and nonsmokers in the whole corpus callosum using Student’s t tests. We conducted analyses on total corpus callosal indices separately since total corpus callosal indices are dependent on the individual subregions. Subsequently, imaging variables were contrasted in three separate MANOVAs (one each for FA, trace, and volumetric indices). In each of these MANOVAs, the dependent measures were the three subregions of interest (genu, body, splenium), and the independent variable was group (i.e., smoker vs. nonsmoker). The three regions of interest were included in each of the separate MANOVAs to reduce the risk of Type 1 errors. Univariate contrasts were examined where the omnibus MANOVA was significant. Pearson correlation coefficients were examined between FTND) score, age, education, and all imaging variables. We also examined the relationship between number of cigarettes smoked per day and DTI metrics. To further explore the impact of FTND score on imaging metrics, the smokers were subdivided into two groups based on low versus high FTND score (mean=1.6, mean=5.6, respectively). A MANOVA was then computed between the two FTND groups and post hoc comparisons were evaluated with Tukey’s test.
Results
Demographics
We found no statistically significant difference between smokers and nonsmokers in terms of age, t(18)=0.01, p>.05, or education, t(18)=0.67, p>.05. As expected, we found a very strong statistical difference on the FTND scale, consistent with the initial groupings of smokers versus nonsmokers, t(18)=5.0, p<.01.
DTI contrasts: Smokers vs. nonsmokers
Compared with nonsmokers, the smokers exhibited significantly elevated FA in the whole corpus callosum, t(18)=2.63, p<.05. The overall MANOVA contrasting the three separate regions of the corpus callosum was statistically significant (Wilks’ λ=0.61, F=3.3, p<.05). Univariate contrasts revealed that smokers exhibited significantly elevated FA in the body of the corpus callosum, F(1, 18)=9.7, p<.01, compared with nonsmokers, and this effect remained after controlling for multiple comparisons (i.e., exceed p<.016). A trend was evident in the splenium, F(1, 18)=3.5, p=.07, but FA did not differ between groups in the genu, F(1, 18)=1.5, p>.05. Smokers did not exhibit significant differences in trace in the whole corpus callosum compared with nonsmokers, t(18)=0.94, p>.05. Similarly, the overall MANOVA contrasting trace within the three regions of the corpus callosum was not statistically significant (Wilks’ λ=0.88, F=0.64, p>.05).
Volumetric contrasts: Smokers vs. nonsmokers
We found no significant difference between smokers and nonsmokers in the volume of the whole corpus callosum, t(18)=-0.40, p>.05. Similarly, the overall MANOVA contrasting volume across the three regions of the corpus callosum was not statistically significant between smokers and nonsmokers (Wilks’ λ=0.88, F=0.71, p>.05).
DTI contrasts: Low Fagerström group vs. high Fagerström group, and nonsmokers
The ANOVA contrasting FA in the whole corpus callosum between the three groups was statistically significant, F(1, 17)=3.7, p<.05. The mean FA values were highest among smokers with lower nicotine dependence, followed by lower FA values among smokers with higher nicotine dependence and still lower FA values among the nonsmokers (Figure 3). Post hoc contrasts revealed that the low Fagerström group exhibited significantly more FA in the whole corpus callosum compared with the nonsmokers (p<.05), but there were no significant differences between the nonsmokers and the high Fagerström group (p=.25), or between the two subgroups of smokers (p=.68). The MANOVA contrasting the three regions of interest was statistically significant (Wilks’ λ=0.38, F=3.4, p<.05). The univariate contrasts revealed significant differences in the body of the corpus callosum (F=7.6, p<.05); smokers reporting lower scores on the FTND exhibited significantly higher FA compared with nonsmokers (p<.05). No other group differences emerged in the body of the corpus callosum. The ANOVA contrasting trace in the whole corpus callosum between the three groups was not statistically significant, F(2, 17)=2.0, p>.05. Similarly, the overall MANOVA contrasting the three regions of the corpus callosum were not statistically significant (Wilks’ λ=0.60, F=1.4, p>.05).
Figure 3.
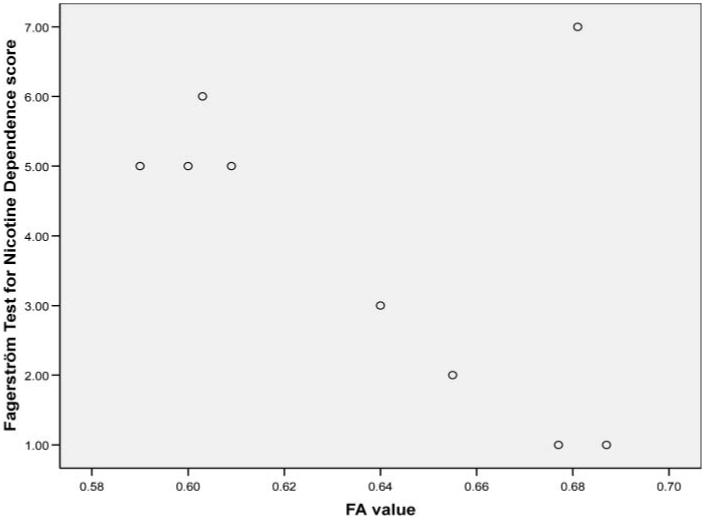
Scatterplot of FA values and Fagerström scores for current smokers.
Volumetric contrasts: Low Fagerström group vs. high Fagerström group, and nonsmokers
The ANOVA contrasting the volume of the whole corpus callosum between nonsmokers and smokers with low and high Fagerström was not significant, F(2, 17)=0.11, p>.05. Similarly, the overall MANOVA contrasting the three regions of interest in the corpus callosum between these groups was not statistically significant (Wilks’ λ=0.77, F=0.67, p>.05).
Correlational analyses
Among smokers, correlation analyses revealed strong but nonsignificant relationships between the Fagerström score and FA in the body (r=-.58, p=.07), genu (r=-.52, p=.12) and splenium (r=.57, p=.08), but not the whole corpus callosum (r=-.23, p>.05). These correlations reflect medium effect sizes and are likely statistically insignificant due to limited power. Neither age nor education correlated significantly with FA (r values <.13). Examination of individual items on the FTND revealed a strong relationship between total number of cigarettes smoked per day and FA in the genu (-.79, p<.01); no other relationships emerged between number of cigarettes per day and either FA or volumes of the corpus callosum in the three regions of interest. Since smokers reporting higher FTND scores were slightly older and less educated, we examined the degree of shared variance between education and age and FA values in the three regions of the corpus callosum. None of these correlations was statistically significant.
Discussion
To our knowledge, this study represents the first report of microstructural alterations in the white matter of the brain among chronic cigarette smokers as evidenced by in vivo neuroimaging. Our study revealed two interesting results. First, on average, smokers exhibited higher levels of FA in the corpus callosum than nonsmokers. Higher levels of FA are typically interpreted as suggesting superior integrity of the white matter. Second, the highest levels of FA were observed among smokers with the lowest nicotine dependence scores, as measured by the FTND. Collectively these findings suggest that among otherwise healthy adults, low levels of nicotine dependence are associated with increased microstructural integrity of the brain white matter.
Our finding of higher FA in the body of the corpus callosum among smokers is not consistent with other studies of FA in drug use populations. Previous studies of other drug-abusing groups revealed a decrease in FA in the brain white matter. For example, Pfefferbaum and colleagues (Pfefferbaum et al., 2000; Pfefferbaum & Sullivan, 2005) reported significantly reduced FA in multiple white matter tracts of chronic alcoholics compared with healthy control subjects. Similarly, Lim, Choi, Pomara, Wolkin, and Rotrosen (2000) reported significantly reduced FA in the white matter of the orbital frontal lobe among 12 cocaine-dependent individuals compared with healthy control subjects, which the authors interpreted as reduced connectivity of key brain regions that underlie decision-making capacity. In contrast to the effects of alcohol and cocaine, chronic marijuana abuse is associated with no significant alteration in FA but a significant increase in trace among abusers compared with demographically matched control subjects (Gruber & Yurgelun-Todd, 2005). Collectively these studies suggest that chronic substance abuse is associated with either reduced FA or increased trace in the white matter of the brain, both of which reflect less microstructural integrity. According to the results of our study, the effects of chronic cigarette smoking on the white matter may differ qualitatively from the effects of alcohol and illicit drugs.
Our findings are preliminary and associational in nature, yet it is appropriate to discuss possible biological mechanisms associated with increased white matter volume reported previously and increased FA among smokers evident in the present study. Gazdzinski et al. (2005) suggested that either nicotine-induced cytotoxic cell swelling secondary to nicotine-induced osmotic imbalances, or vasogenic swelling characterized by plasma fluid leaking into the parenchymal interstitial space might lead to alterations in the white matter. The latter is of interest as the authors noted that this type of vasogenic swelling occurs most strikingly in the white matter. Although our data do not directly address either of these possible explanations, it is of interest that we did not observe significant differences in trace between smokers and nonsmokers. Since trace reflects average diffusion, an increase in overall water content (e.g., edema/swelling) would be expected to result in significantly elevated trace values. An increase in nonaxonal water content (and therefore a decrease in nonisotropic water) also would be expected to decrease the FA in the affected tissue. For example, studies in patient populations have revealed increased trace in the white matter among individuals with cerebral edema (Kale et al., 2006), as well as in animals with experimentally induced vasogenic swelling (Kuriowa et al., 1999). Further, in these studies the degree of swelling was significantly positively correlated with trace values. The lack of group differences in trace between smokers and nonsmokers in our study suggests that vasogenic swelling may not adequately explain volumetric differences in the white matter observed in previous studies.
An alternative explanation for the observation of white matter changes among chronic smokers is related to the neurogenic properties of nicotine. As noted previously, nicotinic receptors are located throughout the CNS and some evidence indicates that nicotinic receptors are associated with a variety of neurogenic properties. For example, Opanashuk, Pauly, and Hauser (2005) treated cerebellar external granular layer (EGL) neuroblasts in vitro with nicotine and observed a concentration-dependent increase in DNA content and synthesis, suggesting increased cell numbers. Furthermore, chronic nicotine treatment for 4-7 days promoted EGL growth and survival. These effects were attenuated by administration of dihydro-beta-erythroidine, a nicotinic acetylcholine receptor antagonist. In addition, preliminary evidence in humans indicates that chronic smoking (in vivo) and nicotine exposure on cells obtained from humans (in vitro) promotes expression of genes involved in neurogenesis, stimulates nerve growth factor, and upregulates calcium-binding proteins (Garrido, King-Pospisil, Son, Hennig, & Toborek, 2003; Liu, Mohila, Gong, Govindarajan, & Onn, 2005). Similarly, P. G. Shields and colleagues (personal communication) observed significantly greater expression of two genes involved in neurogenesis and neurodevelopment, including sex-determining region Y (SRY-box 14), and glutamate receptor ionotropic, kainate in high compared to low smokers.
Ligand-binding studies have revealed the presence of nicotinic receptors in the cortical white matter (Ding et al., 2004), though significant nicotinic binding has not been noted in the corpus callosum per se. Nevertheless, previous studies have revealed that nicotinic receptors are specifically involved in the regulation of oligodendrocyte development. For example, nicotinic receptors are expressed in oligodendrocyte precursor cells (Rogers et al., 2001) and both acetylcholinesterase levels and binding to nicotinic receptors are increased in the subcortical white matter during early fetal development (Perry et al., 1986). Since the white matter in humans does not mature fully until mid to late adolescence (Benes, 1989), it is possible that stimulation of nicotinic receptors via smoking during adolescence and young adulthood results in direct effects on these glial cells, resulting in increased volume and microstructural integrity. It is also well established that nicotine is oxidized into nicotinic acid, and studies have revealed that animals provided with nicotinic aciddeficient diets develop less myelin than animals weaned on a diet enriched with nicotinic acid (Nakashima & Suzue, 1982). Although we do not have data on the chronicity of cigarette smoking in our sample, epidemiological studies suggest that most individuals begin regular smoking behavior during their teens and second decade of life (Lynch & Bonnie, 1994), a period falling in the developmental window of white matter proliferation (Benes, 1989).
Our findings are generally consistent with those reported in Gazdzinski et al. (2005), which identified significantly greater temporal white matter volume among nicotine-dependent alcoholics compared with alcoholic nonsmokers. White matter volumes also were larger in our small group of smokers, though the differences were not statistically significant. However, the observation of significantly greater FA in the corpus callosum among smokers compared with nonsmokers is consistent with microstructural changes in the corpus callosum reflecting enhanced neuronal integrity. The absence of statistically significant differences in volume between our groups of smokers compared with nonsmokers may reflect the health of our sample. All individuals in the BRID were comprehensively screened for medical (cardiovascular disease, cerebrovascular disease) and psychiatric (substance abuse) factors that could affect cerebral health. In addition, unlike the smokers evaluated in the study conducted by Gazdzinski et al. (2005), and the study reported by Brody et al. (2004), our group of smokers reported a relatively limited degree of nicotine dependence. For example, no individuals in our study smoked more than 30 cigarettes/day and most smoked 20 cigarettes/day or less. It is possible that more significant exposure to nicotine is required to result in macrostructural volumetric changes in the white matter. It is also important to recognize that our results are based on a relatively small sample of individuals and it is likely that larger cohorts of smokers with more severe smoking histories are required to define stable relationships between cigarette smoking and neuroimaging indices.
A few limitations of our study warrant discussion. First, the total numbers of subjects is relatively small; therefore, the results should be interpreted as preliminary and in need of replication with more individuals, and with more complete characterization of smoking behavior. Some of our nonsmokers may have had some history of smoking behavior in the past; this was not directly assessed in the present study. However, the impact of such a confound would not likely change the direction of the results since inclusion of former smokers in the nonsmoking group would have minimized rather than maximized differences in FA and volumetrics between the two groups. Another important consideration is that we did not have detailed information on race and ethnicity, and the high- versus low-FTND groups were not balanced on sex. Although we do not believe these factors significantly influenced our findings, larger studies are needed to confirm the results of our initial study.
Whereas our results and those reported by Grazdzinski et al. (2005) suggest neurotropic effects of cigarette smoking, the functional consequence of increased volume and microstructural integrity may not be beneficial. For example, recent work has demonstrated that nicotinic stimulation of the cholinergic system results in abnormal angiogenesis and arteriogenesis (Cooke & Bitterman, 2004). As noted by Cooke and Bitterman (2004), these effects of nicotine appear counterintuitive; however, on closer examination they may explain in part the relationships between cigarette smoking and coronary artery disease via abnormal cell development. Similarly, the increased volume and FA in the white matter among smokers may not represent adaptive brain integrity.
Acknowledgments
The authors thank Peter G. Shields, Professor of Oncology and Medicine, Lombardi Comprehensive Cancer Center at Georgetown University, for his helpful insights and contributions. They also acknowledge the support of the Brain Resource International Database (under the auspices of The Brain Resource Company [BRC]; www.brainresource.com) for use of data and thank the individuals who gave their time to participate in the database. Access to the database for scientific purposes is overseen by a scientific network (BRAINnet; www.brainnet.org.au), which is coordinated independent of the commercial operations of BRC. Part of this work was supported by National Institutes of Health grant EB4155 to David Laidlaw. Also, personal funding to RN from CA84718 and to SPD from DA14276.
References
- Ashburner J, Friston KJ. Voxel-based morphometry—the methods. Neuroimage. 2000;11:805–821. doi: 10.1006/nimg.2000.0582. [DOI] [PubMed] [Google Scholar]
- Bell SL, Taylor RC, Singleton EG, Henningfield JE, Heishman SJ. Smoking after nicotine deprivation enhances cognitive performance and decreases tobacco craving in drug abusers. Nicotine & Tobacco Research. 1999;1:45–52. doi: 10.1080/14622299050011141. [DOI] [PubMed] [Google Scholar]
- Benes FM. Myelination of cortical-hippocampal relays during late adolescence. Schizophrenia Bulletin. 1989;15:585–593. doi: 10.1093/schbul/15.4.585. [DOI] [PubMed] [Google Scholar]
- Brody AL, Mandelkern MA, Jarvik ME, Lee GS, Smith EC, Huang JC, et al. Differences between smokers and nonsmokers in regional gray matter volumes and densities. Biological Psychiatry. 2004;55(1):77–84. doi: 10.1016/s0006-3223(03)00610-3. [DOI] [PubMed] [Google Scholar]
- Catani M. Diffusion tensor magnetic resonance imaging tractography in cognitive disorders. Current Opinion in Neurology. 2006;19(6):599–606. doi: 10.1097/01.wco.0000247610.44106.3f. [DOI] [PubMed] [Google Scholar]
- Chen WT, Wang PN, Wang SJ, Fuh JL, Lin KN, Liu HC. Smoking and cognitive performance in the community elderly: A longitudinal study. Journal of Geriatric Psychiatry and Neurology. 2003;16:18–22. doi: 10.1177/0891988702250510. [DOI] [PubMed] [Google Scholar]
- Cooke JP, Bitterman H. Nicotine and angiogenesis: A new paradigm for tobacco-related diseases. Annals of Medicine. 2004;36(1):33–40. doi: 10.1080/07853890310017576. [DOI] [PubMed] [Google Scholar]
- Dani JA. Overview of nicotinic receptors and their roles in the central nervous system. Biological Psychiatry. 2001;49(3):166–174. doi: 10.1016/s0006-3223(00)01011-8. [DOI] [PubMed] [Google Scholar]
- Ding Y, Fowler JS, Logan J, Wang G, Telang F, Garza V, et al. 6-[18F] Fluoro-A-85380, a new PET tracer for the nicotinic acetylcholine receptor: Studies in the human brain and in vivo demonstration of specific binding in white matter. Synapse. 2004;53:184–189. doi: 10.1002/syn.20051. [DOI] [PubMed] [Google Scholar]
- Feldmann E, Broderick JP, Kernan WN, Viscoli CM, Brass LM, Brott T, et al. Major risk factors for intracerebral hemorrhage in the young are modifiable. Stroke. 2005;36(9):1881–1885. doi: 10.1161/01.STR.0000177480.62341.6b. [DOI] [PubMed] [Google Scholar]
- Foulds J, Stapleton J, Swettenham J, Bell N, McSorley K, Russell MA. Cognitive performance effects of subcutaneous nicotine in smokers and never-smokers. Psychopharmacology. 1996;127:31–38. doi: 10.1007/BF02805972. [DOI] [PubMed] [Google Scholar]
- Friston KJ, Holmes A, Poline JB, Price CJ, Frith CD. Detecting activations in PET and fMRI: Levels of inference and power. Neuroimage. 1996;4:223–235. doi: 10.1006/nimg.1996.0074. [DOI] [PubMed] [Google Scholar]
- Garrido R, King-Pospisil K, Son KW, Hennig B, Toborek M. Nicotine upregulates nerve growth factor expression and prevents apoptosis of cultured spinal cord neurons. Neuroscience Research. 2003;47(3):349–355. doi: 10.1016/s0168-0102(03)00222-0. [DOI] [PubMed] [Google Scholar]
- Gazdzinski S, Durazzo TC, Studholme C, Song E, Banys P, Meyerhoff DJ. Quantitative brain MRI in alcohol dependence: preliminary evidence for effects of concurrent chronic cigarette smoking on regional brain volumes. Alcoholism: Clinical and Experimental Research. 2005;29(8):1484–1495. doi: 10.1097/01.alc.0000175018.72488.61. [DOI] [PubMed] [Google Scholar]
- Goldstein LB, Adams R, Alberts MJ, Appel LJ, Brass LM, Bushnell CD, et al. American Heart Association/American Stroke Association Stroke Council. Atherosclerotic Peripheral Vascular Disease Interdisciplinary Working Group. Cardiovascular Nursing Council. Clinical Cardiology Council. Nutrition, Physical Activity, and Metabolism Council. Quality of Care and Outcomes Research Interdisciplinary Working Group Primary prevention of ischemic stroke. Stroke. 2006;37(6):1583–1633. doi: 10.1161/01.STR.0000223048.70103.F1. A guideline from the. cosponsored by the. and the. [DOI] [PubMed] [Google Scholar]
- Good CD, Johnsrude IS, Ashburner J, Henson RN, Friston KJ, Frackowiak RS. A voxel-based morphometric study of ageing in 465 normal adult human brains. Neuroimage. 2001;14:21–36. doi: 10.1006/nimg.2001.0786. [DOI] [PubMed] [Google Scholar]
- Gordon E. Integrative neuroscience. Neuropsychopharmacology. 2003;28:52–58. doi: 10.1038/sj.npp.1300136. [DOI] [PubMed] [Google Scholar]
- Grieve SM, Clark CR, Williams LM, Peduto AJ, Gordon E. Preservation of limbic and paralimbic structures in aging. Human Brain Mapping. 2005;25(4):391–401. doi: 10.1002/hbm.20115. [DOI] [PMC free article] [PubMed] [Google Scholar]
- Grieve SM, Williams L, Paul R, Clark CR, Gordon E. Cognitive aging, executive function and fractional anisotropy in the frontal lobe: A diffusion tensor MRI study. American Journal of Radiology. 2007;28(2):226–235. [PMC free article] [PubMed] [Google Scholar]
- Gruber SA, Yurgelun-Todd DA. Neuroimaging of marijuana smokers during inhibitory processing: A pilot investigation. Brain Research: Cognitive Brain Research. 2005;23(1):107–118. doi: 10.1016/j.cogbrainres.2005.02.016. [DOI] [PubMed] [Google Scholar]
- Heatherton TF, Kozlowski LT, Frecker RC, Fagerström KO. The Fagerström Test for Nicotine Dependence: A revision of the Fagerström Tolerance Questionnaire. British Journal of Addictions. 1991;86:1119–1127. doi: 10.1111/j.1360-0443.1991.tb01879.x. [DOI] [PubMed] [Google Scholar]
- Heishman SJ. Behavioral and cognitive effects of smoking: Relationship to nicotine addiction. Nicotine & Tobacco Research. 1999;1(Suppl):S143–S147. doi: 10.1080/14622299050011971. [DOI] [PubMed] [Google Scholar]
- Hickie IB, Davenport TA, Naismith SL, Scott EM, SPHERE National Secretariat SPHERE: A national depression project. Medical Journal of Australia. 2001;175:S4–S5. doi: 10.5694/j.1326-5377.2001.tb143781.x. [DOI] [PubMed] [Google Scholar]
- Jones S, Sudweeks S, Yakel JL. Nicotinic receptors in the brain: Correlating physiology with function. Trends in Neuroscience. 1999;22(12):555–561. doi: 10.1016/s0166-2236(99)01471-x. [DOI] [PubMed] [Google Scholar]
- Kale RA, Gupta RK, Saraswat VA, Hasan KM, Trivedi R, Mishra AM, et al. Demonstration of interstitial cerebral edema with diffusion tensor MR imaging in type C hepatic encephalopathy. Hepatology. 2006;43(4):698–706. doi: 10.1002/hep.21114. [DOI] [PubMed] [Google Scholar]
- Kuroiwa T, Nagaoka T, Ueki M, Yamada I, Miyasaka N, Akimoto H, et al. Correlations between the apparent diffusion coefficient, water content, and ultrastructure after induction of vasogenic brain edema in cats. Journal of Neurosurgery. 1999;90(3):499–503. doi: 10.3171/jns.1999.90.3.0499. [DOI] [PubMed] [Google Scholar]
- Lim KO, Choi SJ, Pomara N, Wolkin A, Rotrosen JP. Reduced frontal white matter integrity in cocaine dependence: A controlled diffusion tensor imaging study. Biological Psychiatry. 2002;51(11):890–895. doi: 10.1016/s0006-3223(01)01355-5. [DOI] [PubMed] [Google Scholar]
- Liu JJ, Mohila CA, Gong Y, Govindarajan N, Onn SP. Chronic nicotine exposure during adolescence differentially influences calcium-binding proteins in rat anterior cingulate cortex. European Journal of Neuroscience. 2005;22(10):2462–2474. doi: 10.1111/j.1460-9568.2005.04423.x. [DOI] [PubMed] [Google Scholar]
- Lovibond P, Lovibond S. The structure of negative emotional states: Comparison of the Depression Anxiety Stress Scales (DASS) with the Beck Depression and Anxiety Inventories. Behavioral Research and Therapy. 1995;33(3):335–343. doi: 10.1016/0005-7967(94)00075-u. [DOI] [PubMed] [Google Scholar]
- Lynch B, Bonnie R. Growing up tobacco free: Preventing nicotine addiction in children and youths. National Academies Press; Washington, DC: 1994. [PubMed] [Google Scholar]
- Nakashima Y, Suzue R. Effect of nicotinic acid on myelin lipids in brain of developing rat. Journal of Nutrition Science and Vitaminology. 1982;28(5):491–500. doi: 10.3177/jnsv.28.491. [DOI] [PubMed] [Google Scholar]
- Opanashuk LA, Pauly JR, Hauser KF. Effect of nicotine on cerebellar granule neuron development. European Journal of Neuroscience. 2005;112(11):1475–1478. [PMC free article] [PubMed] [Google Scholar]
- Paul R, Brickman AM, Cohen R, Williams LM, Niaura R, Pogun S, et al. Cognitive status of young and older cigarette smokers: Data from the International Brain Database. Journal of Clinical Neuroscience. 2006;13(4):457–465. doi: 10.1016/j.jocn.2005.04.012. [DOI] [PubMed] [Google Scholar]
- Perry EK, Smith CJ, Atack JR, Candy JM, Johnson M, Perry RH. Neocortical cholinergic enzyme and receptor activities in the human fetal brain. Journal of Neurochemistry. 1986;47(4):1262–1269. doi: 10.1111/j.1471-4159.1986.tb00749.x. [DOI] [PubMed] [Google Scholar]
- Pfefferbaum A, Sullivan EV. Disruption of brain white matter microstructure by excessive intracellular and extracellular fluid in alcoholism: Evidence from diffusion tensor imaging. Neuropsychopharmacology. 2005;30(2):423–432. doi: 10.1038/sj.npp.1300623. [DOI] [PubMed] [Google Scholar]
- Pfefferbaum A, Sullivan EV, Hedehus M, Adalsteinsson E, Lim KO, Moseley M. In vivo detection and functional correlates of white matter microstructural disruption in chronic alcoholism. Alcoholism: Clinical and Experimental Research. 2000;24(8):1214–1221. [PubMed] [Google Scholar]
- Reitz C, Luchsinger J, Tang MX, Mayeux R. Effect of smoking and time on cognitive function in the elderly without dementia. Neurology. 2005;65(6):870–875. doi: 10.1212/01.wnl.0000176057.22827.b7. [DOI] [PMC free article] [PubMed] [Google Scholar]
- Rogers SW, Gregori NZ, Carlson N, Gahring LC, Noble M. Neuronal nicotinic acetylcholine receptor expression by O2A/oligodendrocyte progenitor cells. Glia. 2001;33(4):306–313. [PubMed] [Google Scholar]
- Sacco S, Marini C, Totaro R, Russo T, Cerone D, Carolei A. A population-based study of the incidence and prognosis of lacunar stroke. Neurology. 2006;66(9):1335–1338. doi: 10.1212/01.wnl.0000210457.89798.0e. [DOI] [PubMed] [Google Scholar]
- Stewart MC, Deary IJ, Fowkes FG, Price JF. Relationship between lifetime smoking, smoking status at older age and human cognitive function. Neuroepidemiology. 2006;26(2):83–92. doi: 10.1159/000090253. [DOI] [PubMed] [Google Scholar]
- Waters AJ, Sutton SR. Direct and indirect effects of nicotine/smoking on cognition in humans. Addictive Behaviors. 2000;25:29–43. doi: 10.1016/s0306-4603(99)00023-4. [DOI] [PubMed] [Google Scholar]
- Wonnacott S, Sidhpura N, Balfour DJ. Nicotine: From molecular mechanisms to behaviour. Current Opinions in Pharmacology. 2005;5(1):53–59. doi: 10.1016/j.coph.2004.12.002. [DOI] [PubMed] [Google Scholar]