SUMMARY
Pluripotency can be induced in differentiated murine and human cells by retroviral transduction of Oct4, Sox2, Klf4 and c-Myc. We have devised a reprogramming strategy in which these four transcription factors are expressed from doxycycline (dox) inducible lentiviral vectors. Using these inducible constructs, we derived induced pluripotent stem (iPS) cells from mouse embryonic fibroblasts (MEFs) and found that transgene silencing is a prerequisite for normal cell differentiation. We have analyzed the timing of known pluripotency marker activation during mouse iPS cell derivation and observed that alkaline phosphatase (AP) was activated first, followed by stage specific embryonic antigen 1 (SSEA1). Expression of Nanog and the endogenous Oct4 gene, marking fully reprogrammed cells, were only observed late in the process. Importantly, the virally transduced cDNAs needed to be expressed for at least 12 days in order to generate iPS cells. Our results are a step towards understanding some of the molecular events governing epigenetic reprogramming.
INTRODUCTION
The generation of pluripotent cell lines from somatic cells has great potential for basic research as well as clinical applications (Hochedlinger and Jaenisch, 2003; Rideout et al., 2002). Even though epigenetic reprogramming of a somatic genome to an embryonic state by nuclear transfer or fusion of ES cells with somatic cells has become a widely used procedure in various mammalian species over the last decade (Cowan et al., 2005; Kato et al., 1998; Polejaeva et al., 2000; Tada et al., 2001; Wakayama et al., 1998; Wilmut et al., 1997), the underlying molecular mechanism has not been identified.
It has been shown recently that retroviral transduction of mouse and human somatic cells with four transcription factors initiates the gradual conversion of a small subpopulation of the infected cells into a pluripotent, ES cell-like state (Maherali et al., 2007; Meissner et al., 2007; Okita et al., 2007; Takahashi et al., 2007; Takahashi and Yamanaka, 2006; Wernig et al., 2007; Yu et al., 2007). In initial studies, mouse fibroblasts infected with murine Moloney Leukemia Virus (MLV) derived vectors carrying the cDNAs of Oct4, Sox2, c-Myc, and Klf4 under the control of the viral long terminal repeat (LTR) region gave rise to ES cell-like iPS cells that were able to differentiate into cell types of all three germ layers and contributed to the germline of chimeric mice (Maherali et al., 2007; Okita et al., 2007; Wernig et al., 2007). More recently, iPS cells were isolated in the absence of a transduced c-Myc gene although with a significantly lower efficiency (Nakagawa et al., 2008; Wernig et al., 2008; Yu et al., 2007). DNA methylation and histone modification analyses revealed that the chromatin of mouse iPS cells had been reprogrammed to an embryonic state. This included demethylation of the endogenous promoters controlling the ES cell specific genes Nanog and Oct4 and the simultaneous establishment of both H3K4 and H3K27 tri-methylation marks at loci previously identified to be ‘bivalent’ in ES cells (Bernstein et al., 2006; Maherali et al., 2007; Okita et al., 2007; Wernig et al., 2007). During the derivation process, iPS cells efficiently downregulated the transcriptional activity of the viral LTRs to basal levels, suggesting that viral transgene expression becomes dispensable at a certain time point during the reprogramming process. Though the isolation of human iPS cells has been achieved recently (Takahashi et al., 2007; Yu et al., 2007) the translation of this approach for clinical use faces a number of problems. One major obstacle is the stochastic re-activation of the viral transgenes which has been linked to an elevated frequency of tumor formation in iPS cell-derived chimeric mice (Okita et al., 2007).
In previous studies, iPS cell colonies were detected at widely differing time points after infection of somatic cells. Depending on the selection strategy employed, cells undergoing reprogramming could be enriched for by drug selection starting as early as on day three and as late as several weeks after infection (Maherali et al., 2007; Okita et al., 2007; Wernig et al., 2007). Our recently published data demonstrated that cells originating from the same infected parental cell activate the endogenous Oct4-locus at different time points, suggesting that the induction of pluripotency by viral transduction is a gradual process involving stochastic epigenetic events (Meissner et al., 2007). Viral transduction-mediated reprogramming involves the transcriptional activation of endogenous markers for pluripotency such as AP, SSEA1, Sox2, Oct4 and Nanog (Maherali et al., 2007; Meissner et al., 2007; Okita et al., 2007; Wernig et al., 2007). It is unclear, however, whether the reactivation of pluripotency-associated genes is a random, stochastic process or follows a specific set of sequential events and the minimal length of transgene expression required for successful reprogramming has not been determined. Understanding the timing of endogenous gene activation and transgene silencing is fundamental for the development of transient, non-viral reprogramming strategies.
In order to study the activation of endogenous genes during the reprogramming process and the time requirements for ectopic expression of the four factors, we have developed a lentiviral system in which the cDNAs of the four transcription factors are driven from a dox-inducible promoter. In contrast to previously employed retroviral systems (Maherali et al., 2007; Meissner et al., 2007; Okita et al., 2007; Wernig et al., 2007), this allows for controlled expression of all four transgenes independent of viral integration and cellular silencing of viral LTRs. We have derived iPS cell lines after infection of fibroblasts obtained from Oct4-GFP mice or Nanog-GFP mice expressing the M2rtTA from the endogenous Rosa26 (R26) promoter. By utilizing inducible viruses, we were able to activate or downregulate the expression of the four factors at different time points and to analyze the timing of the reprogramming process. Using FACS analysis, we assessed the activation of the four ES cell markers AP, SSEA1, Oct4-GFP and Nanog-GFP and found that SSEA1 expression marks an intermediate state of reprogramming whereas Oct4 and Nanog expression was only detected in fully reprogrammed cells. We also identified the minimum time of viral transgene expression required for completion of the reprogramming process and determined the effect of continued expression of the four factors on the differentiation potential of several iPS cell lines.
RESULTS
A dox-inducible system for the derivation of pluripotent cell lines
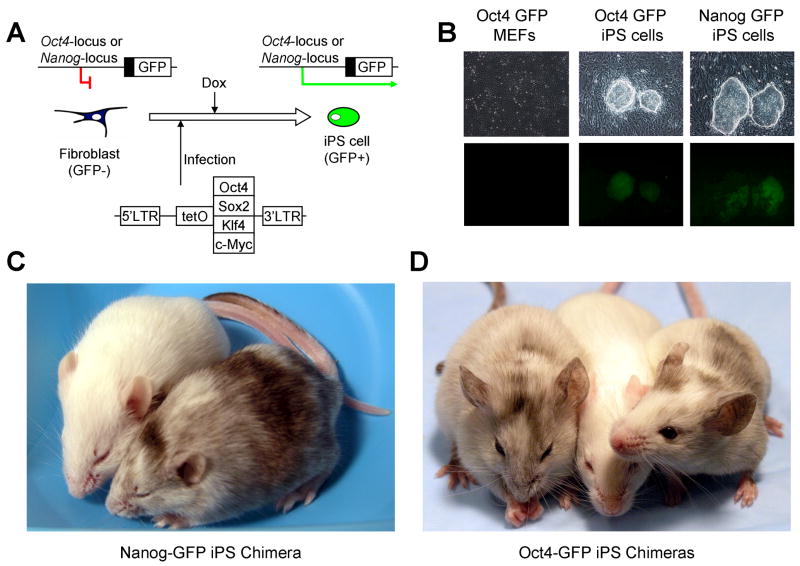
A lentiviral backbone for dox-inducible transgene expression was constructed by replacing the human Ubiquitin-C promoter of the FUW plasmid (Lois et al., 2002) with a tetracycline operator and minimal CMV promoter. The cDNAs for Oct4, Sox2, Klf4, and c-Myc were subsequently cloned into this backbone. We generated mouse embryonic fibroblasts carrying the R26 promoter-driven M2rtTA (Beard et al., 2006) and a GFP allele driven by either the endogenous Oct4 or Nanog promoter (Maherali et al., 2007; Meissner et al., 2007). M2rtTA(+/−);Oct4GFP(+/−) and M2rtTA(+/−);NanogGFP(+/−) MEFs were infected with inducible Oct4, Sox2, c-Myc, and Klf4 viruses and subsequently treated with dox (Figure 1A). To determine the expression levels of the four genes from the inducible viruses, we performed quantitative PCR analysis showing that ectopic transcript expression could be strongly induced in the presence of dox (Supplementary Figure 1).
Figure 1. Derivation of iPS cells using an inducible lentiviral system.
Somatic cells harboring a GFP reporter driven by the endogenous Oct4 or Nanog promoters were infected with tet-inducible lentiviral vectors carrying the cDNAs of Oct4, Sox2, Klf4 and c-Myc (A). The addition of doxycycline after infection induced lentiviral expression and subsequently led to reprogrammed, GFP positive iPS cell colonies (B). The iPS cells were pluripotent and contributed to viable chimeras after injection into BALB/C host blastocysts as indicated by coat color (C, D). White mice are non-chimeric BALB/C animals, whereas mixed coat color mice are chimeric.
To generate iPS cell lines, 2.5×10⁵ MEFs were infected in 10cm cell culture dishes. The cultures were split 1:5 at three days after infection. Dox was added to the cell culture medium one day following the split to induce transgene expression and initiate the reprogramming process. In the presence of dox, the morphology of the infected MEFs changed within 3 days, with small, rounded cells forming in the culture. Similar to previous observations (Maherali et al., 2007; Meissner et al., 2007; Okita et al., 2007; Wernig et al., 2007) small colonies were observed by day 9 and ES-like colonies appeared by day 16, many of which had activated transcription of endogenous Oct4 or Nanog as indicated by GFP expression. ES-like colonies were not observed in cultures that had not been treated with dox. We picked single GFP-positive colonies from the dox-treated plates at day 26 and expanded them on feeder MEFs in the absence of dox to derive iPS cell lines (Figure 1B). Viable chimeras were generated from both Oct4-GFP and Nanog-GFP iPS clones after injection into BALB/C blastocysts (Figure 1C and D).
Sequential activation of pluripotency markers
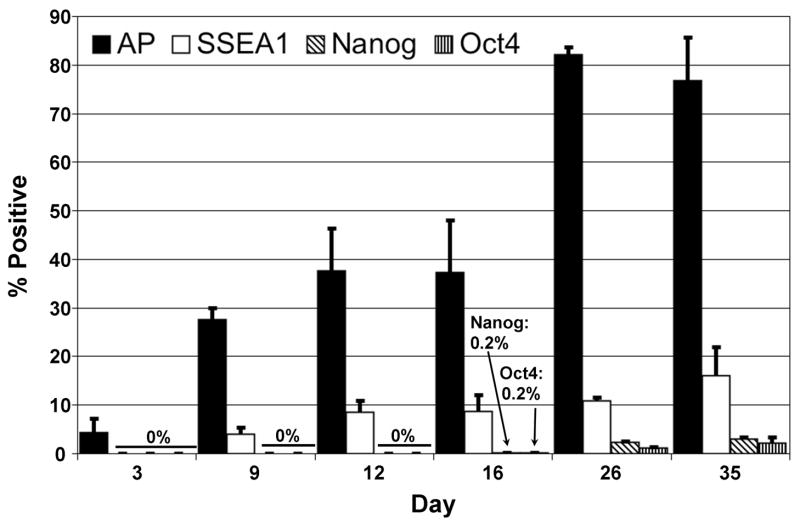
In order to provide a baseline measure of endogenous ES cell marker activation during the direct reprogramming of MEFs, we performed FACS analyses of AP, SSEA1, and Oct4- or Nanog-driven GFP. For each experiment, Oct4-GFP and Nanog-GFP cells were infected with the same batch of virus to reduce variability. Three days after infection, the MEFs were split onto gelatin-coated 10cm plates. The next day, dox was added to all plates (day 0). The expression of ES cell specific markers was analyzed at various time points after dox addition up to day 35. The average percentages of cells expressing AP, SSEA1, Oct4-GFP or Nanog-GFP from three independent experiments are displayed in Figure 2. Representative FACS plots for AP and SSEA1/Oct4-GFP or SSEA1/Nanog-GFP analysis are displayed in Supplementary Figure 2. Since the GFP signal to background fluorescence ratio was low, we performed autofluorescence correction as outlined elsewhere (Alberti et al., 1987). Consistent with our previous observations (Wernig et al., 2007), AP was reactivated early after induction of the four factors and was detectable in a small percentage (~3–4%) of cells at day 3. SSEA1 was first expressed in a subpopulation of cells (~4%) at day 9 and GFP expression from either the Oct4 or Nanog endogenous promoters was first observed by FACS at day 16, with the percentage of GFP positive cells being below 1% in both cases. We performed quantitative RT-PCR assays on whole cell populations as well as on SSEA1 positive cells to investigate whether transcriptional activation of the endogenous Nanog or Sox2 loci was detectable before the appearance of GFP positive cells. We found no significant levels of either transcript at time points up to day 9 of dox induction (Supplementary Figure 3). The portion of cells expressing AP, SSEA1 or GFP increased in both reporter lines over time, consistent with our previous results (Wernig et al., 2007).
Figure 2. Timing of pluripotency marker reactivation during reprogramming.
FACS analysis of AP, SSEA1 and GFP reactivation was performed on Nanog-GFP/M2rtTA and Oct4-GFP/M2rtTA MEFs at different times after the induction of reprogramming. Cells were harvested at various time points after the addition of dox to the ES cell medium and incubated with an APC labeled anti-SSEA1 antibody and a fluorescent substrate that is activated in the presence of AP activity. The data from three independent experiments are summarized. Columns display average percentages of cells expressing AP (black), SSEA1 (white) and Nanog-GFP (diagonal) or Oct4-GFP (vertical). AP and SSEA1 values represent averages of Nanog-GFP and Oct4-GFP experiments. Error bars indicate standard deviations.
SSEA1 activation marks an intermediate step of reprogramming
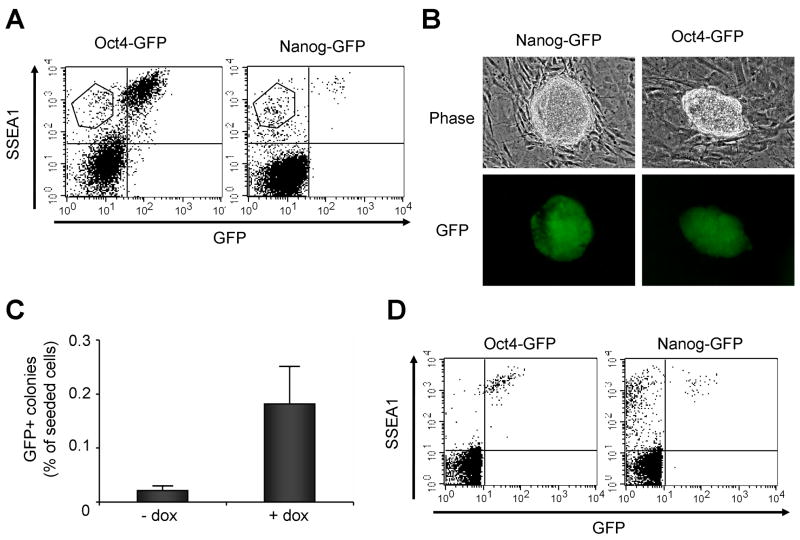
The timing of marker appearance observed by FACS suggests that the activation of AP, SSEA1, Oct4 and Nanog might be sequential events. This notion is supported by the observation that at day 9 after infection only about 7% of the AP positive cells also expressed SSEA1 and at day 16 only about 3% of the cells staining for SSEA1 also expressed Nanog or Oct4 as indicated by GFP fluorescence. In contrast, most if not all GFP positive cells also expressed SSEA1. To test the hypothesis that SSEA1 and Oct4/Nanog are sequentially activated, we sorted infected populations of Oct4-GFP and Nanog-GFP cells at day 21 of dox treatment (Figure 3A). Equal numbers of SSEA1+/GFP− cells were plated on feeders and cultured for three days either in the presence or in the absence of dox. After three days the medium was changed and the cells were incubated in dox-free medium for an additional seven days. GFP positive colonies were observed in both treated and untreated cultures of SSEA1+/GFP− cells (Figure 3B). The percentage of SSEA1+/GFP− cells that were able to generate GFP positive colonies was calculated. In both the Oct4-GFP and the Nanog-GFP cell populations ~0.02% of the SSEA1+/GFP− cells gave rise to GFP positive colonies without dox treatment. This percentage increased about ten-fold to ~0.2% when the cells were treated with dox, indicating that continuous expression of the transcription factors enhanced reprogramming in SSEA1+/GFP− cells (Figure 3C). We confirmed the existence of SSEA1+/GFP+ cells in the sorted populations by FACS analysis 11 days after the initial sort (Figure 3D). In contrast to SSEA1+/GFP− cells, SSEA1−/GFP− cells did not give rise to any GFP positive colonies after ten days of culturing with or without dox.
Figure 3. SSEA1 expression marks an intermediate state of reprogramming.
SSEA1+/GFP− cells were sorted with an APC conjugated SSEA1-antibody after 21 days of transgene expression and seeded on feeder MEFs (A). GFP positive ES-like cell colonies were observed ten days after sorting (B). Supplementation of the media with dox for an additional three days after sorting increased the percentage of SSEA1+/GFP−cells that gave rise to GFP positive iPS cell colonies (C). Numbers from two independent experiments for Oct4-GFP and Nanog-GFP were averaged. Error bars indicate standard deviations. Confirmation of GFP-positive cells in the sorted SSEA1+/GFP− populations eleven days after initial sorting and seeding on feeder MEFs (D).
To investigate whether the SSEA1+/GFP− cells that did not give rise to iPS cell colonies after dox-withdrawal simply stopped dividing while maintaining SSEA1 expression or returned to a MEF-like SSEA1-negative state, we sorted cells after 9 days of dox treatment - a time point well before the expression of Nanog-GFP or Oct4-GFP could be detected. The SSEA1+/GFP− cells were seeded onto plates with feeders and cultured for 20 days with or without dox. In addition, some of the SSEA1+/GFP− cells were also seeded onto plates without feeders to allow for the analysis of their morphology. At the end of the culture period, we assessed SSEA1 and GFP expression by FACS analysis (Figure 4A). In contrast to the SSEA1+/GFP− populations sorted at day 21, the populations sorted at day 9 did not give rise to any SSEA1+/GFP+ cells after culturing them without dox, indicating the complete absence of transgene-independent cells within the SSEA1+/GFP− populations sorted at this earlier time point. Furthermore, most if not all cells cultured without dox ceased to express SSEA1 and returned to a MEF-like morphology (Figure 4B). In contrast, when cultured in the presence of dox, the SSEA1+/GFP− cells from day 9 gave rise to iPS colonies and yielded SSEA1+/GFP+ iPS cells at the end of the culture period (Figure 4A and B).
Figure 4. SSEA1+/GFP− cells return to a MEF-like state upon dox withdrawal.
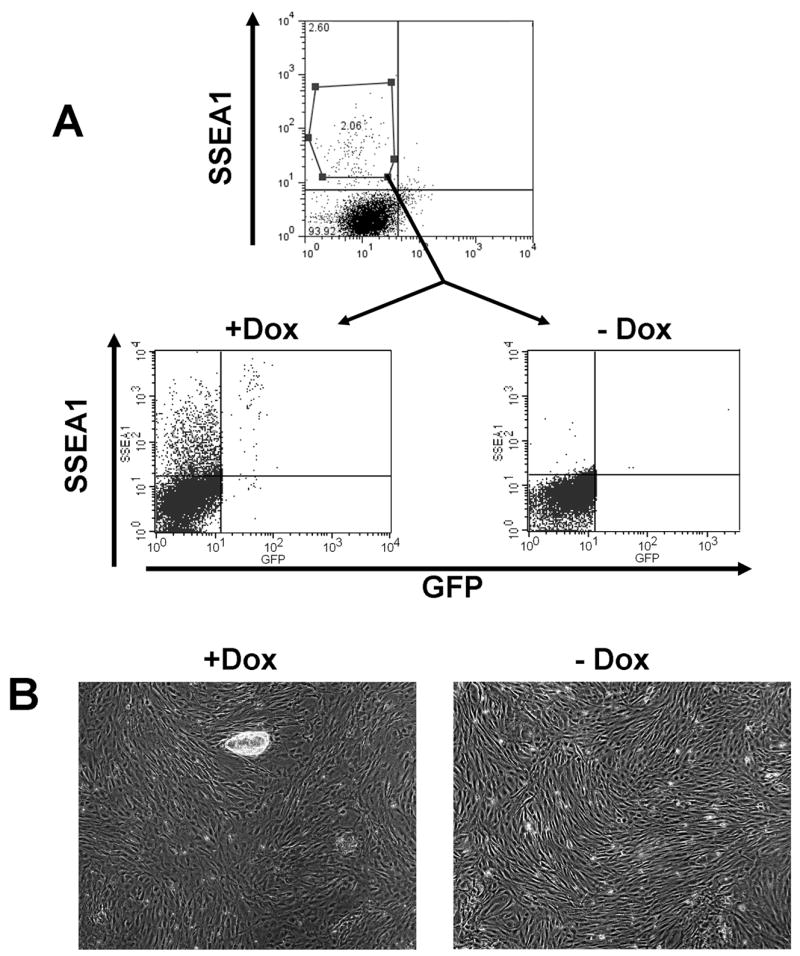
Oct4GFP/M2rTTA MEFs undergoing reprogramming were FACS sorted for SSEA1 expression after 9 days of transgene expression (A). The cells were cultured either in the presence or absence of dox for 20 days after the initial sorting and then re-analyzed for SSEA1 and GFP expression. Plates that were treated with dox contained SSEA1+/GFP+ and SSEA1+/GFP− cells whereas cells on untreated plates had lost their SSEA1 expression (A). Culture in the presence of dox yielded ES-like colonies, but in the absence of dox the SSEA1+/GFP− cells returned to a MEF like morphology (B).
Our results indicate that SSEA1 activation may represent an intermediate step preceding the activation of Oct4 or Nanog. The SSEA1-positive state seems to be instable and SSEA1+/GFP− cells separated at day 9 depend on continued transgene expression to complete the reprogramming process. When the transgenes are turned off the reprogramming process is halted and the cells assume a state resembling that of the donor MEFs. Our findings also indicate that reprogramming is a gradual, asynchronous process and that continuous vector expression enhances reprogramming efficiency even at 21 days after the start of dox induction, a time point well beyond the initial appearance of GFP positive iPS cells.
Minimal time of transgene expression required for direct reprogramming
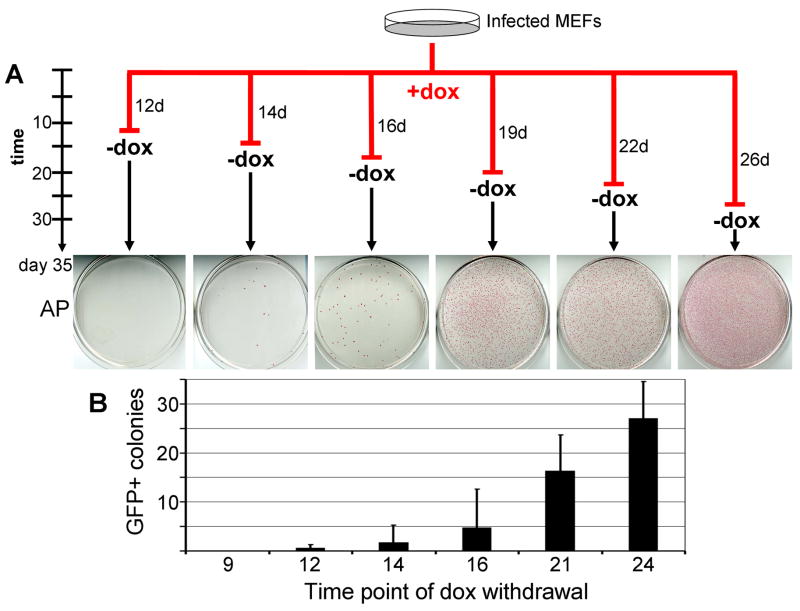
We investigated how long the exogenous expression of the four factors was required for successful reprogramming of fibroblasts to dox-independent, self-renewing iPS cells. For this, cells were infected with the inducible lentiviruses, and split onto six gelatin-coated 10cm plates three days later as outlined in Figure 5A. One day after splitting the cells, dox was added to the culture medium (day 0). The drug was withdrawn from individual cultures at various time points (day 12, 14, 16, 19, 22 and 26) and the dishes were fixed and stained for AP on day 35 (Figure 5A). We found that day 14 was the earliest time point of dox-withdrawal that was permissive to the establishment of dox-independent colonies that stained positive for AP (Figure 5A). No dox-independent, AP positive colonies were observed on plates that had dox withdrawn on day 12 (Figure 5A), even though AP positive cells were consistently detectable at the time of dox-withdrawal in our FACS experiments (compare Figure 2). These initial colonies did not proliferate after dox-withdrawal and did not stain for AP at day 35. In the dishes where dox was withdrawn at later time points, the number of dox-independent, AP positive colonies increased with the time that the cells were exposed to dox and therefore with the length of transgene expression (Figure 5A).
Figure 5. Time requirement of transgene expression for iPS derivation.
Infected MEFs were split into 6 dishes and cultured in the presence of dox for a different number of days as indicated by numbers next to the red lines (A). Dox was withdrawn at different time points as indicated by red bars and the cells were subsequently cultured in the absence of the drug until day 35. All plates were stained for AP at day 35 of reprogramming to determine how many transgene-independent cells existed at the time point of dox withdrawal. No AP positive colonies were observed when dox was withdrawn before day 12 and the number of AP positive colonies increased with the time the cells were exposed to the drug (A). Similarly, infected MEFs were grown in the presence of dox and dox was removed at different time points from the culture medium. GFP expressing iPS colonies were counted on day 35. Data for Nanog-GFP and Oct4-GFP experiments were averaged and the number of colonies detected in six wells (3 for Oct4-GFP and 3 for Nanog-GFP cells) for each time point is shown in the bar graph (B). Error bars indicate standard deviation.
To determine the time point of dox-withdrawal at which fully reprogrammed iPS cells could reproducibly be derived, we repeated this experiment in triplicate for both Nanog-GFP and Oct4-GFP cells. This time we withdrew dox on days 9, 12, 14, 16, 21 and 24, respectively, and examined the plates for GFP expressing iPS colonies on day 35 (Figure 5B). No marked differences in colony counts were detected between Oct4-GFP and Nanog-GFP cells and the data obtained from both donor cell lines was combined. We observed that dox-independent, GFP expressing iPS cell colonies could not reliably be detected on plates that had dox removed on or prior to day 12, with four of the six “day 12” plates containing no GFP-positive colonies, one plate containing a single colony and another plate containing two GFP-positive colonies. Notably, a number of small colonies were visible on these early withdrawal plates at the time of dox removal (Supplementary Figure 4A). However, these did not resemble ES cell colonies and did not continue to proliferate once dox was withdrawn (Supplementary Figure 4B). Dox-independent, GFP positive colonies consistently appeared on plates treated with dox for 16 days or longer suggesting that some cells on those plates could proliferate and self-renew independently of viral transgene expression. Consistent with our results from the AP stainings displayed in Figure 5A, continued dox-treatment increased the number of transgene-independent and GFP positive cells (Figure 5B). Together, these results suggest that transgene expression is critical for the formation of iPS cells at least up to day 12–16, and that the continued expression of the transgenes beyond this time point increases the number of iPS cell colonies. Shorter transgene expression yields cells that are AP and SSEA1 positive but depend on transgene expression for progressing towards a fully reprogrammed iPS cell state.
Differentiation of iPS cells requires downregulation of transgene expression
To test whether continuous transgene expression affected the differentiation potential of the derived iPS lines, we compared three iPS cell lines derived using inducible lentiviruses to iPS cell lines obtained after transduction of MEFS with the four cDNAs cloned into the constitutively expressed FUW lentiviral vector (Lois et al., 2002). In this vector, the cDNAs are expressed from the human Ubiquitin C promoter that is ubiquitously expressed in mouse cells (Lois et al., 2002). We injected 5×10⁵ cells of three iPS lines harboring inducible vectors (NS12, NS14, and NS16) and of five lines harboring constitutive vectors subcutaneously into SCID mice. We used wt ES cells and ES cells harboring the R26-M2rtTA allele as controls. Figure 6 shows representative sections of ES-cell and iPS-derived tumors that were stained for Oct4 expression. Whereas the tumors obtained from the control ES cells and the inducible iPS cells displayed similar states of differentiation, the tumors generated from iPS cell lines harboring constitutively expressing vectors showed virtually no differentiated cells. Most if not all cells in the FUW-derived iPS cell tumors stained strongly for Oct4. This was in contrast to the controls and the tumors obtained after injection of iPS cells harboring inducible vectors, where Oct4 was only expressed in very few cells throughout the tumor. These results suggest that continued ectopic expression of the four transcription factors ablates the differentiation capacity of iPS cell lines.
Figure 6. Constitutive expression of the four factors prevents differentiation of iPS cells in teratomas.
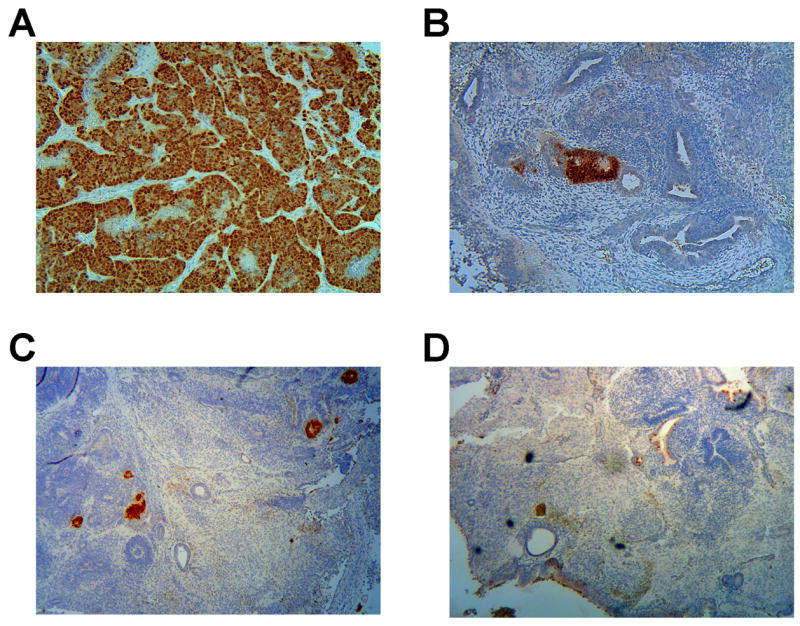
Differentiation of iPS cells in teratomas was ablated by continuous expression of transgenes in iPS cells. Tumors derived from iPS cells expressing the four transgenes under the control of the constitutive Ubiquitin C promoter stained homogeneously positive for Oct4 and did not show normal cell differentiation (A). IPS cells harboring the inducible viral backbones differentiated readily after downregulation of the transgenes in the absence of dox (B). The tumors derived from these cells were similar in size, fraction of cells staining positive for Oct4 and differentiation to tumors derived from wildtype control ES cell lines (C) or ES cells harboring the R26-M2rtTA allele (D).
DISCUSSION
In this study, we used an inducible, lentiviral system to generate GFP positive, pluripotent iPS cells from MEFs derived from Oct4-GFP/R26-M2rtTA and Nanog-GFP/R26-M2rtTA mice. We established iPS cell lines that were able to differentiate in teratoma assays and could produce viable chimeras. This is in contrast to iPS cells harboring constitutively expressing lentiviral constructs that are not efficiently silenced in iPS cells. The inducible system allowed us to investigate the timing and sequence of ES cell marker gene activation using FACS analysis. We found direct in vitro reprogramming to be a gradual process encompassing the sequential activation of four pluripotency marker genes, with AP being expressed first on day 3 followed by SSEA1 on day 9. GFP expressed from the endogenous promoters of Oct4 or Nanog was first detectable on day 16 (Figure 7). SSEA1−/GFP− cells were not able to activate GFP expression in the same time frame as SSEA1+/GFP− cells and the progress from the SSEA1+/GFP− state to the dox-independent, fully reprogrammed SSEA1+/GFP+ state was greatly enhanced by continued transgene expression. Together, these results suggest that SSEA1+/GFP− cells may represent a transgene-dependent intermediate state of reprogramming. These partially reprogrammed cells required continued transgene expression in order to progress towards a fully reprogrammed state, whereas transgene downregulation caused reversion to a fibroblast-like, SSEA1-negative state. Finally, we demonstrated that the generation of iPS cells requires the ectopic expression of the four transcription factors for a minimum of 12–16 days (Figure 7). The removal of dox prior or on day 12 resulted in the return of colony-forming cells to a MEF-like state. The independence from transgene expression closely correlated with the reactivation of the endogenous Oct4 and Nanog loci (Figure 7). We postulate that the activation of the endogenous Oct4 or Nanog may be a marker for fully reprogrammed, transgene-independent iPS cells.
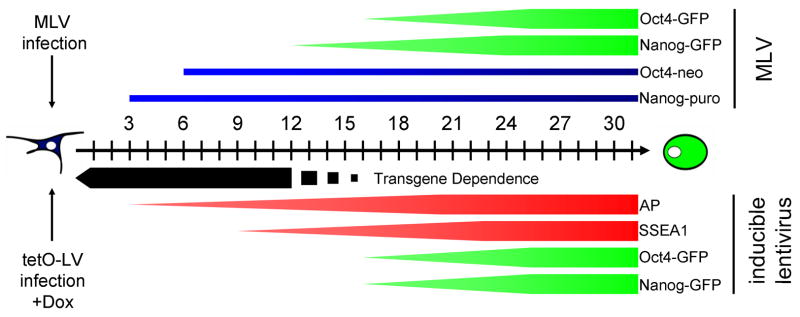
Figure 7. Reprogramming of somatic cells: sequential marker activation and time of virus expression.
The black arrow represents the time starting from MLV vector infection (above (Maherali et al., 2007; Meissner et al., 2007; Okita et al., 2007; Wernig et al., 2007)) or dox-induction (below) in days. For MLV infection, the earliest time points for two antibiotic selection strategies are indicated by blue bars and the expression of Nanog-GFP and Oct4-GFP is indicated by green bars. For dox-inducible transgenes, the minimum time of dox-induced transgene expression for successful iPS cell derivation is displayed as a black bar. The expression timing of four pluripotency marker genes is indicated by red (AP and SSEA1) and green bars (Nanog-GFP and Oct4-GFP)
The sequential activation of pluripotency marker genes found in this study is consistent with our previous observations from MLV-based reprogramming strategies where cells at day 14 after MLV-infection expressed AP and SSEA1, but not Nanog, whereas cells had activated all three markers at day 20 (Wernig et al., 2007). Intriguingly, Nanog-neo MEFs in that study yielded neomycin resistant colonies even when the selection process was initiated at day 6 after infection, a time point well before Nanog expression could be detected by immunostaining (Wernig et al., 2007). Similar results were reported in Okita et al., 2007, and Maherali et al., 2007, where puromycin resistant colonies were derived from Nanog-GFP-IRES-puro MEFs by starting puromycin selection as early as 3 days after infection. This discrepancy in timing between the appearance of antibiotic resistance and protein detection could be due to a low level of initial expression that is sufficient to render the partially reprogrammed cells drug resistant, but below the level required to visualize GFP and maintain pluripotency. This may be the result of a gradual process of gene reactivation that occurs at different times for specific markers, with AP and SSEA1 being activated earlier than Oct4 or Nanog (Figure 7).
We found the time span at which transgene expression becomes dispensable for iPS cell derivation (12–16 days) to precede the appearance of GFP expression which marks the full activation of the endogenous Oct4 and Nanog loci (day 16). Since GFP detection by FACS requires a significant level of protein expression, it is likely that this method overestimates the minimum time span required for Nanog and Oct4 activation. Delayed detection of GFP expression could also explain why SSEA1+/GFP− cells sorted at day 21, but not at day 9, contained a small fraction of transgene-independent cells. These cells might have activated the Oct4 or Nanog loci but did not as yet display GFP expression levels high enough for FACS detection. Sustained transgene expression beyond the minimal time requirement increased the number of cells activating endogenous Nanog and Oct4 expression, supporting the idea of stochastic epigenetic events playing a role in four-factor reprogramming. This is consistent with our previous observation that infected cell populations continue to generate iPS colonies over a drawn-out time window (Meissner et al., 2007). Our results suggest that individual cells either enter the reprogramming process at different time points after transgene induction or take different times to go through the reprogramming sequence. Longer transgene expression, therefore, would give more cells the chance to undergo the required stochastic epigenetic changes and, consequentially, proceed to a state of transgene independence.
In previous reports on iPS cell derivation from somatic cells, transgene expression was driven by the LTRs of MLV based vectors, which were shown to be efficiently silenced in iPS cells (Maherali et al., 2007; Okita et al., 2007; Wernig et al., 2007). When we used constitutively expressed lentiviral vectors to generate iPS cell lines, we found these cells to be poorly capable to differentiate in teratoma assays. This result supports the notion that efficient transgene silencing is essential for the derivation of truly pluripotent iPS cell lines. In a recent publication, iPS cell lines generated using constitutive lentiviral vectors were reported to differentiate in teratoma assays and to contribute to various tissues of mid-gestation chimeric fetuses (Blelloch et al., 2007). The cDNAs in that study were driven from the CMV promoter, which has been shown to undergo methylation-mediated silencing in embryonic stem cells (Hong et al., 2007; Xia et al., 2007), in contrast to the Ubiquitin C promoter employed in our constitutively expressed viral constructs (Lois et al., 2002). It is possible that the differentiation capabilities observed in iPS cells harboring CMV-driven cDNAs could be a result of at least partial silencing of the viral transgenes. Notably, no viable chimeras have been reported from iPS cell lines derived using constitutive lentiviral constructs so far (Blelloch et al., 2007).
Very recently, it has been reported that mouse and human iPS cells can be generated without the use of a c-Myc transgene (Nakagawa et al., 2008; Wernig et al., 2008; Yu et al., 2007). However, the forced expression of c-Myc, as well as other factors such as Nanog and Lin28, has been found to have a substantial effect on the efficiency and the timing of the reprogramming process. While these reports are significant steps towards reducing the tumorigenic potential of iPS cells and their derivatives, the final solution to this problem will be the generation of transgene-free iPS cells. The ability to quantify reprogramming dynamics in a controlled system as presented here will be an invaluable tool for the development of transient reprogramming strategies.
In conclusion, the results presented in this report clarify steps involved in the generation of iPS cells by the expression of the four transcription factors Oct4, Sox2, Klf4 and c-Myc. The information on pluripotency marker activation and transgene expression provided here can be utilized as a benchmark for further analyses of the reprogramming process and should allow for the identification of factors that positively affect epigenetic reprogramming. When compared to nuclear transfer, it is obvious that reprogramming by viral transduction requires a longer period of time, and it will be important to understand the molecular basis for this difference. The determination of the minimum length of transgene expression has implications for the development of non-retroviral delivery methods of these four factors to derive genetically unmodified iPS cells. Specifically, any transient expression strategy for iPS cell generation, such as protein transduction, will need to provide protein expression at sufficient levels for a minimum of 12–16 days. The generation of transient, non-viral approaches in conjunction with a better understanding of the reprogramming process will be an important step in the development of stem cell based therapies.
MATERIALS AND METHODS
Reporter cells
MEFs used in the infections with inducible lentiviruses were harvested at 13.5dpc from F1 matings between R26-M2rtTA mice (Beard et al., 2006) and either Oct4-GFP (Meissner et al., 2007) or Nanog-GFP mice (Maherali et al., 2007). MEFs used in the infections with constitutive lentiviruses were derived from matings of mice carrying an Oct4-neomycin reporter allele (Wernig et al., 2007) and expressed a p53 hairpin (Ventura et al., 2004).
Viral Constructs
To generate the tetracycline inducible viral backbone the human Ubiquitin C promoter and intron were excised from FUW (Lois et al., 2002) by first digesting with PacI, followed by 3′ overhang removal with Klenow, and subsequent digest with BamHI. The Tet Operator/CMV promoter was excised from pRevTRE (Clontech) by digesting first with BglII followed by fill-in followed by BamHI digest. The TetO/CMV promoter and FUW backbone were then ligated. The cDNAs for Oct4, Klf-4, Sox2 and c-Myc were subsequently cloned into the EcoRI sites of the resulting vector. For the constitutive constructs, cDNAs were cloned into the EcoRI site of FUW.
Cell Culture
Cells were cultured in standard ES-cell culture conditions in DMEM supplemented with 10% FBS and LIF as described previously (Beard et al., 2006).
Infections
Virus was prepared as previously described. Briefly, 293 cells were transfected with a mixture of viral plasmid and packaging constructs expressing the viral packaging functions and the VSV-G protein. Medium was replaced 24hrs after transfection and viral supernatants were collected at 48hrs and 72hrs. After filtration, supernatants were pooled and MEFs were incubated with viral supernatants and fresh media at a ratio of 1:1 for 24 hours and subsequently cultured in ES-cell medium.
Blastocyst Injections
Injections of iPS cells into Balb/c host blastocysts were carried out as previously described (Beard et al., 2006).
Antibodies
For FACS analysis we used an APC conjugated anti-mouse SSEA1 (R&D systems, Minneapolis, MN) and an alkaline phosphatase substrate kit: Vector Red substrate kit (Vector Laboratories, Burlingame, CA).
FACS
Cells were trypsinized, washed once in PBS and resuspended in FACS buffer (PBS+5%CCS). 106 cells were stained with 10ul of anti-SSEA1 antibody for 30 minutes and for the stains that included the AP substrate, cells were then washed once in PBS and fixed/permeabilized using an intracellular staining kit (R&D systems, Minneapolis, MN). After permeabilization, cells were treated with 500ul of AP substrate solution (Vector Laboratories, Burlingame, CA) for 20 minutes. Cells were then washed once with wash buffer and resuspended in FACS buffer for analysis on a FACS-calibur cell sorter. For live sorting, cells were stained with an APC-conjugated antibody against SSEA1 (R&D systems, Minneapolis, MN) and sorted on a FACS-Aria cell sorter.
Teratoma assay
Cells were trypsinized and 5×10⁵ cells were injected subcutaneously into SCID mice. After 14–21 days, teratomas were dissected, fixed in 10% phosphate-buffered formalin overnight and subsequently embedded in paraffin wax using a Tissue-Tek VIP embedding machine (Miles Scientific, Naperville, IL) and a Thermo Shandon Histocenter 2 (Thermo Fisher Scientific, Waltham, MA). Sections were cut at a thickness of 2 μm using a Leica RM2065 (Leica, Wetzlar, Germany) and stained with hematoxylin and eosin or antibodies against Oct4 as previously described(Hochedlinger et al., 2005).
Quantitative RT-PCR
Total RNA was isolated using Trizol reagent (Invitrogen, Carlsbad, CA). Five micrograms of total RNA was treated with DNase I to remove potential contamination of genomic DNA using a DNA Free RNA kit (Zymo Research, Orange, CA). One microgram of DNase I-treated RNA was reverse transcribed using a First Strand Synthesis kit (Invitrogen) and ultimately resuspended in 100 ul of water. Quantitative PCR analysis was performed in triplicate using 1/50 of the reverse transcription reaction in an ABI Prism 7000 (Applied Biosystems, Foster City, CA) with Platinum SYBR green qPCR SuperMix-UDG with ROX (Invitrogen). Primers used for amplification were as follows: Oct4 F, 5′-ACATCGCCAATCAGCTTGG-3′ and R, 5′-AGAACCATACTCGAACCACATCC-3′; c-myc F, 5′-CCACCAGCAGCGACTCTGA-3′ and R, 5′-TGCCTCTTCTCCACAGACACC-3′; Klf4 F, 5′-GCACACCTGCGAACTCACAC-3′ and R, 5′-CCGTCCCAGTCACAGTGGTAA-3′; Sox2 F, 5′-ACAGATGCAACCGATGCACC-3′ and R, 5′-TGGAGTTGTACTGCAGGGCG-3′. To ensure equal loading of cDNA into RT reactions, GAPDH mRNA was amplified using the following: F, 5′-TTCACCACCATGGAGAAGGC-3′; and R, 5′-CCCTTTTGGCTCCACCCT-3′. Data were extracted from the linear range of amplification. All graphs of qRT-PCR data shown represent samples of RNA that were DNase treated, reverse transcribed, and amplified in parallel to avoid variation inherent in these procedures.
Supplementary Material
Acknowledgments
The authors thank Glenn Paradis for critical evaluation of the FACS data and help with the autofluorescence correction, Jessica Dausman and Ruth Flannery for their help with the generation of chimeras, Dongdong Fu for the immunostaining of the teratomas, Caroline Beard, Laurie Boyer, Alexander Meissner, Krishanu Saha, Frank Soeldner and Betty Zhou for critical review of the manuscript. Rudolf Jaenisch was supported by NIH grants RO1-HD045022 and R37-CA084198 and a grant from the Ellison Foundation.
Footnotes
Publisher's Disclaimer: This is a PDF file of an unedited manuscript that has been accepted for publication. As a service to our customers we are providing this early version of the manuscript. The manuscript will undergo copyediting, typesetting, and review of the resulting proof before it is published in its final citable form. Please note that during the production process errors may be discovered which could affect the content, and all legal disclaimers that apply to the journal pertain.
References
- Alberti S, Parks DR, Herzenberg LA. A single laser method for subtraction of cell autofluorescence in flow cytometry. Cytometry. 1987;8:114–119. doi: 10.1002/cyto.990080203. [DOI] [PubMed] [Google Scholar]
- Beard C, Hochedlinger K, Plath K, Wutz A, Jaenisch R. Efficient method to generate single-copy transgenic mice by site-specific integration in embryonic stem cells. Genesis. 2006;44:23–28. doi: 10.1002/gene.20180. [DOI] [PubMed] [Google Scholar]
- Bernstein BE, Mikkelsen TS, Xie X, Kamal M, Huebert DJ, Cuff J, Fry B, Meissner A, Wernig M, Plath K, et al. A bivalent chromatin structure marks key developmental genes in embryonic stem cells. Cell. 2006;125:315–326. doi: 10.1016/j.cell.2006.02.041. [DOI] [PubMed] [Google Scholar]
- Blelloch R, Venere M, Yen J, Ramalho-Santos M. Generation of Induced Pluripotent Stem Cells in the Absence of Drug Selection. Cell Stem Cell. 2007;1:245–247. doi: 10.1016/j.stem.2007.08.008. [DOI] [PMC free article] [PubMed] [Google Scholar]
- Cowan CA, Atienza J, Melton DA, Eggan K. Nuclear reprogramming of somatic cells after fusion with human embryonic stem cells. Science. 2005;309:1369–1373. doi: 10.1126/science.1116447. [DOI] [PubMed] [Google Scholar]
- Hochedlinger K, Jaenisch R. Nuclear transplantation, embryonic stem cells, and the potential for cell therapy. N Engl J Med. 2003;349:275–286. doi: 10.1056/NEJMra035397. [DOI] [PubMed] [Google Scholar]
- Hochedlinger K, Yamada Y, Beard C, Jaenisch R. Ectopic expression of Oct-4 blocks progenitor-cell differentiation and causes dysplasia in epithelial tissues. Cell. 2005;121:465–477. doi: 10.1016/j.cell.2005.02.018. [DOI] [PubMed] [Google Scholar]
- Hong S, Hwang DY, Yoon S, Isacson O, Ramezani A, Hawley RG, Kim KS. Functional analysis of various promoters in lentiviral vectors at different stages of in vitro differentiation of mouse embryonic stem cells. Mol Ther. 2007;15:1630–1639. doi: 10.1038/sj.mt.6300251. [DOI] [PMC free article] [PubMed] [Google Scholar]
- Kato Y, Tani T, Sotomaru Y, Kurokawa K, Kato J, Doguchi H, Yasue H, Tsunoda Y. Eight calves cloned from somatic cells of a single adult. Science. 1998;282:2095–2098. doi: 10.1126/science.282.5396.2095. [DOI] [PubMed] [Google Scholar]
- Lois C, Hong EJ, Pease S, Brown EJ, Baltimore D. Germline transmission and tissue-specific expression of transgenes delivered by lentiviral vectors. Science. 2002;295:868–872. doi: 10.1126/science.1067081. [DOI] [PubMed] [Google Scholar]
- Maherali N, Sridharan R, Xie W, Utikal J, Eminli S, Arnold K, Stadtfeld M, Yachechko R, Tchieu J, Jaenisch R, et al. Directly Reprogrammed Fibroblasts Show Global Epigenetic Remodeling and Widespread Tissue Contribution. Cell Stem Cell. 2007;1:55–70. doi: 10.1016/j.stem.2007.05.014. [DOI] [PubMed] [Google Scholar]
- Meissner A, Wernig M, Jaenisch R. Direct reprogramming of genetically unmodified fibroblasts into pluripotent stem cells. Nat Biotechnol. 2007;25:1177–1181. doi: 10.1038/nbt1335. [DOI] [PubMed] [Google Scholar]
- Nakagawa M, Koyanagi M, Tanabe K, Takahashi K, Ichisaka T, Aoi T, Okita K, Mochiduki Y, Takizawa N, Yamanaka S. Generation of induced pluripotent stem cells without Myc from mouse and human fibroblasts. Nat Biotechnol. 2008;26:101–106. doi: 10.1038/nbt1374. [DOI] [PubMed] [Google Scholar]
- Okita K, Ichisaka T, Yamanaka S. Generation of germline-competent induced pluripotent stem cells. Nature. 2007;448:313–317. doi: 10.1038/nature05934. [DOI] [PubMed] [Google Scholar]
- Polejaeva IA, Chen SH, Vaught TD, Page RL, Mullins J, Ball S, Dai Y, Boone J, Walker S, Ayares DL, et al. Cloned pigs produced by nuclear transfer from adult somatic cells. Nature. 2000;407:86–90. doi: 10.1038/35024082. [DOI] [PubMed] [Google Scholar]
- Rideout WM, 3rd, Hochedlinger K, Kyba M, Daley GQ, Jaenisch R. Correction of a genetic defect by nuclear transplantation and combined cell and gene therapy. Cell. 2002;109:17–27. doi: 10.1016/s0092-8674(02)00681-5. [DOI] [PubMed] [Google Scholar]
- Tada M, Takahama Y, Abe K, Nakatsuji N, Tada T. Nuclear reprogramming of somatic cells by in vitro hybridization with ES cells. Curr Biol. 2001;11:1553–1558. doi: 10.1016/s0960-9822(01)00459-6. [DOI] [PubMed] [Google Scholar]
- Takahashi K, Tanabe K, Ohnuki M, Narita M, Ichisaka T, Tomoda K, Yamanaka S. Induction of pluripotent stem cells from adult human fibroblasts by defined factors. Cell. 2007;131:861–872. doi: 10.1016/j.cell.2007.11.019. [DOI] [PubMed] [Google Scholar]
- Takahashi K, Yamanaka S. Induction of pluripotent stem cells from mouse embryonic and adult fibroblast cultures by defined factors. Cell. 2006;126:663–676. doi: 10.1016/j.cell.2006.07.024. [DOI] [PubMed] [Google Scholar]
- Ventura A, Meissner A, Dillon CP, McManus M, Sharp PA, Van Parijs L, Jaenisch R, Jacks T. Cre-lox-regulated conditional RNA interference from transgenes. Proc Natl Acad Sci U S A. 2004;101:10380–10385. doi: 10.1073/pnas.0403954101. [DOI] [PMC free article] [PubMed] [Google Scholar]
- Wakayama T, Perry AC, Zuccotti M, Johnson KR, Yanagimachi R. Full-term development of mice from enucleated oocytes injected with cumulus cell nuclei. Nature. 1998;394:369–374. doi: 10.1038/28615. [DOI] [PubMed] [Google Scholar]
- Wernig M, Meissner A, Cassady JP, Jaenisch R. c-Myc Is Dispensable for Direct Reprogramming of Mouse Fibroblasts. Cell Stem Cell. 2008;2:10–12. doi: 10.1016/j.stem.2007.12.001. [DOI] [PubMed] [Google Scholar]
- Wernig M, Meissner A, Foreman R, Brambrink T, Ku M, Hochedlinger K, Bernstein BE, Jaenisch R. In vitro reprogramming of fibroblasts into a pluripotent ES-cell-like state. Nature. 2007;448:318–324. doi: 10.1038/nature05944. [DOI] [PubMed] [Google Scholar]
- Wilmut I, Schnieke AE, McWhir J, Kind AJ, Campbell KH. Viable offspring derived from fetal and adult mammalian cells. Nature. 1997;385:810–813. doi: 10.1038/385810a0. [DOI] [PubMed] [Google Scholar]
- Xia X, Zhang Y, Zieth CR, Zhang SC. Transgenes delivered by lentiviral vector are suppressed in human embryonic stem cells in a promoter-dependent manner. Stem Cells Dev. 2007;16:167–176. doi: 10.1089/scd.2006.0057. [DOI] [PMC free article] [PubMed] [Google Scholar]
- Yu J, Vodyanik MA, Smuga-Otto K, Antosiewicz-Bourget J, Frane JL, Tian S, Nie J, Jonsdottir GA, Ruotti V, Stewart R et al. Induced Pluripotent Stem Cell Lines Derived from Human Somatic Cells. Science. 2007 doi: 10.1126/science.1151526. [DOI] [PubMed] [Google Scholar]
Associated Data
This section collects any data citations, data availability statements, or supplementary materials included in this article.


