

Abstract
Cell migration is essential for proper development of numerous structures derived from embryonic neural crest cells (NCCs). Although recent work has shown that receptor recycling plays an important role in NCC motility on laminin, the molecular mechanisms regulating NCC motility on fibronectin remain unclear. One mechanism by which cells regulate motility is by modulating the affinity of integrin receptors. Here, we provide evidence that cranial and trunk NCCs rely on functional regulation of integrins to migrate efficiently on fibronectin (FN) in vitro. For NCCs cultured on fibronectin, velocity decreases after Mn2+ application (a treatment that activates all surface integrins) while velocity on laminin (LM) is not affected. The distribution of activated integrin β1 receptors on the surface of NCCs is also substratum-dependent. Integrin activation affects cranial and trunk NCCs differently when cultured on different concentrations of FN substrata; only cranial NCCs slow in a FN concentration-dependent manner. Furthermore, Mn2+ treatment alters the distribution and number of activated integrin β1 receptors on the surface of cranial and trunk NCCs in different ways. We provide a hypothesis whereby a combination of activated surface integrin levels and the degree to which those receptors are clustered determines NCC motility on fibronectin.
Keywords: Neural crest, integrin activation, cell movement, laminin, fibronectin, integrins, endocytosis, extracellular matrix
INTRODUCTION
The neural crest is a transient embryonic cell population which migrates long distances through the vertebrate embryo during development and gives rise to diverse derivatives. Neural crest cells (NCCs) arise on the dorsal side of the neural tube and, after an epithelial to mesenchymal transition, migrate along defined pathways to generate many cell types, including the neurons and glia of the peripheral and autonomic nervous systems, craniofacial connective tissue and bone, melanocytes, as well as the outflow tract of the heart (reviewed in [1-4]). The extensive migratory ability of the neural crest distinguishes this cell population from most embryonic and adult cell types which generally remain stationary. Unlike stationary cells, NCCs are able to adapt to changing extracellular environments and thereby migrate efficiently through diverse tissues over the course of many days. This behavior suggests that NCCs are able to maintain motility by continuously monitoring and responding to changes in the extracellular matrix (ECM), however, the molecular mechanisms responsible for such flexibility are only partially understood.
During development, the integrin family of cell adhesion receptors are required for proper cell migration, proliferation, survival and differentiation of many embryonic cell populations, including the neural crest. Integrins are heterodimeric transmembrane receptors that bind both ECM and cytoskeletal proteins, and thus provide a transmembrane link between extracellular signals and intracellular mechanical forces. Efficient cell motility requires an intermediate level of cell adhesion because cells that are too weakly attached cannot generate enough traction for movement, and cells that are too strongly adhered remain stationary. Thus, the ability to modulate cell adhesion via integrin function differentiates stationary cells, which remain restricted to certain tissues in vivo, from migratory cells, which can invade new environments. Hence, it is likely that regulation of cell adhesion is fundamental for proper migration of NCCs.
Previous work indicates that changes in integrin surface expression [5] and surface integrin distribution [6] can regulate cell adhesion and motility. In addition, ligand affinity is regulated by rapid and reversible conformation changes in the extracellular domains of integrin heterodimers. The process by which integrin-ligand affinity is regulated is called integrin activation, and refers to the change from an inactive (low-affinity) to an active (high-affinity) conformation [7, 8]. It is thought that integrin receptors remain in a state of flux between the two conformations until intracellular signals, ligand- or divalent cation-binding holds the receptor in the active state. Furthermore, clustering of activated integrins into focal adhesions increases integrin avidity and cell adhesion, and subsequently slows cell migration [8, 9].
The adhesion and migration of NCCs, both in vivo and in vitro, are primarily mediated by beta 1 integrins, whose ligands include two major ECM molecules, laminin and fibronectin [10-19]. Both laminin and fibronectin are abundantly expressed in neural crest migration pathways in vivo [20, 21]. Previous analysis of NCC migration in vitro using a variety of monoclonal and polyclonal antibodies to integrin β1 as substrata has shown that both the affinity of receptors for the substratum and the number of receptors bound to the substratum are critical in regulating NCC motility [22]. It has also been shown that two subpopulations of neural crest, cranial and trunk (based on their axial level of origin), differ in their requirement of divalent cations for attachment to laminin and fibronectin, suggesting that differences in integrin activation levels may underlie distinctions between embryonic cell populations [23]. However, the contribution of integrin activation to NCC motility has not been well studied.
Early investigation of NCC motility in vitro has shown that cranial and trunk NCCs migrate efficiently across a wide range of fibronectin concentrations [16]. Cranial NCCs regulate surface expression of integrin α4 (a fibronectin receptor) in response to the concentration of ligand present in the substratum, presumably to maintain the intermediate level of adhesion necessary for optimal motility. In contrast, trunk NCCs do not regulate surface fibronectin receptor levels, suggesting that this population of cells use another mechanism to compensate for changing fibronectin densities. Whether trunk NCCs accommodate different fibronectin levels either by regulation of integrin function or by compensatory alterations in downstream integrin signaling is unknown. Interestingly, overexpression of fibronectin receptors in cranial NCCs does not slow their motility on fibronectin, suggesting that, like trunk NCCs, other regulation mechanisms must control cranial NCC motility. Thus, we hypothesized that integrin functional regulation, i.e. the ratio of activated to inactivated receptors on the cell surface, may be an important mechanism for cranial and trunk NCC motility on fibronectin.
In the present study, we examined the role of integrin functional regulation in cranial and trunk NCC motility in vitro. We find that integrin functional regulation is substratum-dependent and plays a greater role in NCC motility on fibronectin than on laminin. Activated integrin β1 distribution on the surface of NCCs cultured on fibronectin is distinct compared to the distribution on laminin, indicating that integrin clustering is also substratum-dependent. On varying concentrations of fibronectin, ligand availability regulates the speed of cranial but not trunk NCCs after activation of surface integrins with Mn2+ treatment. This treatment alters the distribution of activated integrin β1 receptors on the cell surface, while only varying the level of activated surface receptors slightly. We provide a summary of our core findings whereby a combination of activated surface integrin levels and receptor clustering determines NCC motility on fibronectin in vitro, and we hypothesize that this mechanism may provide NCCs the flexibility to migrate through changing environments in vivo.
MATERIALS and METHODS
Substratum preparation and cell culture
Glass coverslips (Goldseal; Fisher) were acid washed, rinsed in dH2O, and baked at 350° C for 12 hours. 13mm holes were drilled in the bottom of 35mm tissue culture dishes (Fisher) and the prepared coverslips were affixed to the dish with Sylgard (Dow Corning). Bovine plasma fibronectin (FN; Gibco BRL) and natural mouse laminin (LM; Gibco) were diluted to low (1 μg/ml) and high (20 μg/ml) concentrations in phosphate buffered saline (PBS), and 300 μl of the protein solution was added to the coverslips, incubated for 3 hours at room temperature and then rinsed once with PBS. As previously published [16], absolute protein concentration on the coverslips was determined by measuring the amount of tritiated laminin and fibronectin bound to glass as described in [24]. Application of laminin at 1 μg/ml (low laminin) and 20 μg/ml (high laminin) resulted in a density of 45 ng/cm2 and 430 ng/cm2 bound laminin, respectivelApplication of fibronectin at 1 μg/ml (low fibronectin) and 20 μg/ml (high fibronectin) resulted in 35 ng/cm2 and 700 ng/cm2 bound fibronectin, respectively.
White Leghorn chicken eggs (supplied by Utah State University) were incubated at 38° C until the embryos reached [25] stages 8 (cranial cultures) and 12 (trunk cultures). All animal studies were approved by the University of Utah Institutional Review Board. Neural tubes from the mesencephalic level (cranial) or adjacent to the caudal-most 6-8 somites (trunk) were dissected away from the surrounding tissue with tungsten needles. Neural tubes were cultured at 37° C with 5% CO2 for 48 hours in 250 μl of Neurobasal Medium (Gibco) supplemented with 25 μM glutamic acid (Sigma), 500 μM L-glutamine (Sigma), 1x B-27 and N-2 (Gibco), 10 ng/ml NT3 (Chemicon), 100 ng/ml EGF (Upstate), 10 ng/ml FGF (Upstate), and 50 ng/ml NGF (R & D Systems). Neurobasal medium without the supplements and buffered with N-(2-Hydroxyethyl)piperazine-N′-(2-ethanesulfonic acid) (HEPES; USBiological) was used for the timelapse assays.
Reagents and Antibodies
Antibodies against the following proteins were used in these experiments: activated integrin β1 (TASC: MAB19294; Chemicon) and actin (AAN01; Cytoskeleton Inc., and Alexa Phalloidin; Molecular Probes.) Manganese chloride (Sigma) was applied at a final concentration of 0.25 mM. Secondary antibodies were from Molecular Probes.
Timelapse Analysis
Cranial and trunk neural crest were cultured for 48 hours. The neurobasal media was replaced with HEPES-buffered neurobasal media for filming. Independent cells (25-35/condition) at the outer edge of the explant were videographed at 10X for 30 minutes to establish the pre-treatment velocity. We chose to investigate the explant edge at this time point in order to maximize the number of solitary, migratory cells for our study. Phase images were acquired (Metamorph 5.0) every 150 seconds. Manganese chloride or H20 alone (vehicle) was then added, and after 15 minutes the post-treatment velocity was determined by filming the cells for an additional 30 minutes. Cell velocity was determined by tracking the position of the nucleus over time (Metamorph 5.0), and any cell that was not actively migrating just prior to treatment was not included in the analysis. Cumulative distribution graphs were generated by sorting each cell's velocity from highest to lowest speed, and determining the percentage of cells (in the same condition) that traveled slower than that cell. The speed of the cell was plotted against the percentage of cells traveling slower in order to show the velocity of each cell in relation to the whole population. Specific points in each graph are not directly comparable to corresponding points in other graphs as each point merely reflects a cell's speed in relation to the whole population.
Immunohistochemistry and Focal Adhesion Analysis
For the analysis of activated integrin β1 distribution, cranial and trunk neural crest cultures were grown for 48 hours and incubated with Mn2+ or the vehicle control (H20) for 20 minutes at 37 °C. Cells were then rinsed and fixed with 2% paraformaldehyde (EMS) with 35% sucrose for 20 minutes at room temperature. This fixation technique does not permeabilize these cells. Anti-activated integrin β1 antibody (TASC; 1:500) was diluted in blocking buffer (PBS- with 5% normal goat serum) and added to the cells for 1 hour at room temperature. Secondary antibodies (1:500; Molecular Probes) were also diluted in blocking buffer and added to the cells for 1 hour at room temperature. Images were acquired from all conditions on the same day at 60X magnification with a CCD camera using Spot acquisition software (Diagnostic Instruments, Inc.)
To quantify the number of focal adhesions and the focal adhesion area, cells were treated as detailed above. All data acquisition and analysis was done by an observer blinded to the experimental condition. Using criteria we have previously published [16, 26], the entire area of a cell with a migratory morphology (leading lamella, rearward nucleus, and in some cases, a retraction fiber) was selected and measured (Metamorph 5.0). Two deconvolution steps, flatten background and no neighbors, were applied to each cell image to select focal adhesions. Focal adhesion area and number were then measured.
Immunoprecipitations
For the analysis of the ratio of active versus inactive integrin β1 on the cell surface, cranial and trunk neural crest cultures were grown for 48 hours and incubated with 0.25 mM Mn2+ or the vehicle control (H20) for 20 minutes at 37 °C. Cell surface receptors were labeled with NHS-SS-biotin (Pierce) on ice and the cells (100,000) were then lysed on ice in a solution containing 0.5% triton x-100 and protease inhibitors. Protein concentration in each cell lysate was determined with a BCA protein assay (Pierce) and equalized across conditions. Activated integrin β1 was immunoprecipitated with the TASC antibody using standard protocols [24], and immunoprecipitated proteins were size fractionated under nonreducing conditions on acrylamide gels and electrophoretically transferred to nitrocellulose membranes. Biotinylated proteins were detected by using strep-Avidin conjugated to HRP and a chemoluminescent reagent (Pierce) followed by exposure to film. Exposures of blots that were in the linear range were quantified using GelDoc and QuantityOne (BioRad).
RESULTS
Integrin activation slows NCC motility on fibronectin
To determine the role of integrin functional regulation in NCC motility on laminin and fibronectin, we examined the velocity of cranial and trunk NCCs before and after treatment with the divalent cation manganese (Mn2+). Because Mn2+ holds integrins in an active conformation, we postulated that cells which require a balance of inactive and active surface integrins for efficient motility would be slowed after treatment. Using time-lapse videomicroscopy, we established a pre-treatment velocity for each cell and graphed these data in a cumulative distribution plot (see Materials and methods for generation of these plots) to show the range of velocities in these heterogeneous cell populations. On high concentrations of fibronectin (FN20) and laminin (LM20) cranial NCCs traveled at the same velocity, whereas trunk NCCs were significantly faster on laminin compared to fibronectin (Fig. 1A). The average velocity of cranial NCCs pre-treatment was 179 μm/hr ± 10 (SEM) on FN20 compared to 186 μm/hr ± 8 on LM20, whereas the average velocity of trunk NCCs pre-treatment was 142 μm/hr ± 5 on FN20 compared to 173 μm/hr ± 8 on LM20. After following each cell for 30 minutes, Mn2+ was applied at a final concentration of 0.25 mM and allowed to act for 15 minutes. Each cell was then followed for another 30 minutes to determine a post-treatment velocity (Fig. 1B). The average velocity of cranial NCCs post-treatment was 106 μm/hr ± 10 on FN20 compared to 171 μm/hr ± 9 on LM20. The average velocity of trunk NCCs post-treatment was 89 μm/hr ± 5 on FN20 compared to 157 μm/hr ± 6 on LM20.
Figure 1.

Integrin activation regulates NCC motility on fibronectin, but not on laminin. (A) Cumulative distribution plots of cranial and trunk NCC velocity before Mn2+ treatment are shown where each point represents the pre-treatment velocity of a single cell. Cumulative percent on the y-axis refers to the percent of the population traveling that speed or faster. The average velocity of cranial NCCs pre-treatment is 179 μm/hr ± 10 (SEM) (n = 23) on FN20 (filled circles) compared to 186 μm/hr ± 8 (n = 19) on LM20 (open circles). The two pre-treatment conditions are not statistically different (P > 0.05; ttest). The average velocity of trunk NCCs pre-treatment is 142 μm/hr ± 5 (SEM) (n = 24) on FN20 (filled triangles) compared to 173 μm/hr ± 8 (n = 26) on LM20 (open triangles). The difference between the two pre-treatment conditions is statistically significant (P < 0.01; t test). (B) Cumulative distribution plots of cranial and trunk NCC velocity after Mn2+ treatment. The average velocity of cranial NCCs post-treatment is 106 μm/hr ± 10 on FN20 compared to 171 μm/hr ± 9 on LM20. The average velocity of trunk NCCs post-treatment is 89 μm/hr ± 5 on FN20 compared to 157 μm/hr ± 6 on LM20. The differences between the post-treatment conditions for both cranial and trunk NCCs are statistically significant (P < 0.001; t test). (C) Cumulative distribution plots of the change in cell velocity after Mn2+ treatment where each point represents the change in velocity of a single cell following Mn2+ treatment. Cranial NCCs cultured on FN20 and treated with Mn2+ slow an average of 73 μm/hr ± 11 (post-treatment velocities are statistically different from pre-treatment velocities; P < 0.001; paired t test). In contrast, cranial NCCs cultured on LM20 and treated with Mn2+ slow an average 15 μm/hr ± 10 (pre-and post-treatment velocities are not significantly different; P > 0.05, paired t test). Trunk NCCs cultured on FN20 and treated with Mn2+ slow an average of 52 μm/hr ± 8 (post-treatment velocities are statistically different from pre-treatment velocities; P < 0.001; paired t test). Trunk NCCs cultured on LM20 and treated with Mn2+ slow an average 16 μm/hr ± 7 (post-treatment velocities are significantly different from pre-treatment velocities; P < 0.05, paired t test). Specific points in each graph are not directly comparable to corresponding points in other graphs as each point merely reflects a cell's velocity, or change in velocity, in relation to the whole population.
Cumulative distribution plots of the change in each cell's velocity after Mn2+ treatment show that nearly 90% of both cranial and trunk NCCs cultured on FN20 slowed when all surface integrins were activated (Fig. 1C); post-treatment velocities were significantly different from pre-treatment velocities (P < 0.001; paired t test). In contrast, there was no change in velocity for cranial NCCs cultured on LM20; pre- and post-treatment velocities were not significantly different from each other (P > 0.05; paired t test). Trunk NCCs cultured on LM20 and treated with Mn2+ slowed slightly; post-treatment velocities were significantly different from pre-treatment velocities (P < 0.05; paired t test). These results indicate that integrin functional regulation is substratum-dependent and plays a greater role in NCC motility on fibronectin compared to laminin.
Activated integrin β1 distribution in NCCs is substratum-dependent
To determine whether the substratum-dependent slowing of NCCs was due to differential distribution of activated integrin receptors, we immunostained NCCs for activated integrin β1 before and after Mn2+ treatment. Integrin β1 heterodimerizes with a variety of integrin alpha subunits, some of which bind laminin, or fibronectin or both molecules. Clustering of activated integrins into large focal adhesions increases cell adhesion to the substratum and slows cell motility [11]. For cranial NCCs cultured on high concentrations of fibronectin, activated integrin β1 was observed in clusters both before and after Mn2+ treatment (Fig. 2A). In contrast, there was much less clustering of activated integrin β1 in cranial NCCs cultured on high laminin both before and after Mn2+ treatment. For trunk NCCs cultured on high fibronectin, activated integrin β1 was observed in clusters both before and after Mn2+ treatment (Fig. 2B). Activated integrin β1 also clustered in trunk NCCs cultured on high laminin, although perhaps to a lesser degree than on high fibronectin. These results indicate that both the motility of NCCs and their surface activated integrin β1 distribution is substratum-dependent.
Figure 2.

Activated integrin β1 distribution in NCCs is substratum-dependent. Cranial and trunk NCCs were cultured on high concentrations of fibronectin or laminin and immunostained for activated integrin β1 before (−) and after (+) Mn2+ treatment. On high concentrations of fibronectin, activated integrin β1 clustered both before and after Mn2+ treatment (Fig. 2A). In contrast, there was much less clustering of activated integrin β1 in cranial NCCs cultured on high laminin both before and after Mn2+ treatment. For trunk NCCs cultured on high fibronectin, activated integrin β1 clustered both before and after Mn2+ treatment (Fig. 2B). Activated integrin β1 also clustered in trunk NCCs cultured on high laminin, although perhaps to a lesser degree than on high fibronectin.
Integrin activation slows cranial NCC motility in a substratum-dependent manner
Activation of all surface integrins would be predicted to slow cells to a greater degree on high concentrations of fibronectin where more ligand is available to adhere cells to the substratum. To determine whether substratum density regulates the levels of surface integrin activation and thereby regulates NCCs motility, we examined the velocity of cranial and trunk NCCs cultured on low (FN1) and high (FN20) concentrations of fibronectin. Using the same experimental method as in Figure 1, we established pre-treatment velocities for cranial and trunk NCCs cultured on FN1 and FN20. On both fibronectin concentrations, cranial NCCs traveled at the same velocity, whereas trunk NCCs were slightly faster (P < 0.05; t test) on FN1 compared to FN20 (Fig. 3A). The average velocity of cranial NCCs pre-treatment was 179 μm/hr ± 10 on FN20 compared to 172 μm/hr ± 8 on FN1, whereas the average velocity of trunk NCCs pre-treatment was 142 μm/hr ± 5 on FN20 compared to 157 μm/hr ± 6 on FN1. After following each cell for 30 minutes, Mn2+ was applied and allowed to act for 15 minutes. Each cell was then followed for another 30 minutes to determine a post-treatment velocity (Fig. 3B). Both populations of NCC on both concentrations of FN slowed in response to treatment. The average velocity of cranial NCCs post-treatment was 106 μm/hr ± 10 on FN20 compared to 128 μm/hr ± 11 on FN1. The average velocity of trunk NCCs post-treatment was 89 μm/hr ± 5 on FN20 compared to 115 μm/hr ± 6 on FN1.
Figure 3.

Integrin activation regulates cranial NCC motility in a substratum concentration-dependent manner, but not trunk NCC motility. (A) Cumulative distribution plots of cranial and trunk NCC velocity before Mn2+ treatment are shown where each point represents the pre-treatment velocity of a single cell. Cumulative percent on the y-axis refers to the percent of the population traveling that speed or faster. The average velocity of cranial NCCs pre-treatment is 179 μm/hr ± 10 (SEM) (n = 23) on FN20 (filled circles) compared to 172 μm/hr ± 8 (n = 24) on FN1 (open circles). The two pre-treatment conditions are not statistically different (P > 0.05; t test). The average velocity of trunk NCCs pre-treatment is 142 μm/hr ± 5 (SEM) (n = 24) on FN20 (filled triangles) compared to 157 μm/hr ± 6 (n = 26) on FN1 (open triangles). The difference between the two pre-treatment conditions is statistically significant (P < 0.05; t test). (B) Cumulative distribution plots of cranial and trunk NCC velocity after Mn2+ treatment. The average velocity of cranial NCCs post-treatment is 106 μm/hr ± 10 on FN20 compared to 128 μm/hr ± 11 on FN1. The two post-treatment conditions are not statistically different (P > 0.05; t test). The average velocity of trunk NCCs post-treatment is 89 μm/hr ± 5 on FN20 compared to 115 μm/hr ± 8 on FN1. The difference between the two post-treatment conditions is statistically significant (P < 0.01; t test). (C) Cumulative distribution plots of the change in cell velocity after Mn2+ treatment where each point represents the change in velocity of a single cell following Mn2+ treatment. Cranial NCCs treated with Mn2+ slow an average of 73 μm/hr ± 11 on FN20 versus 44 μm/hr ± 11 on FN1 (post-treatment velocities on both substrata are statistically different from pre-treatment velocities; P < 0.001; paired t test). The difference between the changes in velocity for cranial NCCs on FN20 and FN1 is statistically significant (P < 0.05; t test). Trunk NCCs treated with Mn2+ slow an average of 52 μm/hr ± 8 on FN20 versus 42 μm/hr ± 8 on FN1 (post-treatment velocities on both substrata were statistically different from pre-treatment velocities; P < 0.001; paired t test). The change in velocity for trunk NCCs on FN20 or FN1 is not statistically significant (P > 0.05; t test). Specific points in each graph are not directly comparable to corresponding points in other graphs as each point merely reflects a cell's velocity, or change in velocity, in relation to the whole population.
Cumulative distribution plots of the change in each cell's velocity after Mn2+ treatment show that approximately 80% of both cranial and trunk NCCs cultured on FN1 or FN20 slowed when all surface integrins were activated (Fig. 3C); post-treatment velocities were significantly different from pre-treatment velocities (P < 0.001; paired t test). Cranial NCCs cultured on FN20 slowed to a greater degree than the same cell type cultured on FN1 (P < 0.05; t test), as would be predicted from high fibronectin concentrations mediating a greater increase in cell adhesion. In contrast, trunk NCCs slowed to the same degree on either FN1 or FN20 (P > 0.05; t test). These results indicate that amount of ligand available regulates the speed of cranial but not trunk NCCs cultured on fibronectin.
Surface ratios of inactive to active integrin β1
To further investigate the differences between cranial and trunk NCCs cultured on low and high fibronectin, we examined the surface levels of active integrin β1 before and after Mn2+ treatment. Although NCC motility on fibronectin is mediated by both β1 and β3 integrins, only integrin β1 can be studied in its activated form with the available antibodies. An increased level of activated integrin β1 on the cell surface after Mn2+ treatment would be predicted to slow cells possibly by increasing adhesion to the substratum, or by altering surface presentation of the receptor [27]. Cranial and trunk NCCs were cultured on low (FN1) and high (FN20) concentrations of fibronectin and surface activated integrin β1 was immunoprecipitated with and without Mn2+ treatment (Fig. 4). There was no statistically significant difference between the amount of activated integrin β1 on the surface without (red bars) or with (black bars) Mn2+ treatment for any condition. These results indicate that the majority of integrin β1 on the surface of NCCs cultured on FN is already activated, and that the Mn2+-induced slowing is not due to activation of a large pool of inactivated surface receptors. However, there was a trend toward an increased level of activated surface integrin β1 after Mn2+ treatment for cranial NCCs on FN20 and trunk NCCs on FN1. Thus, these results suggest that the distribution of activated integrins on the cell surface, rather than the surface level, regulates NCC motility.
Figure 4.
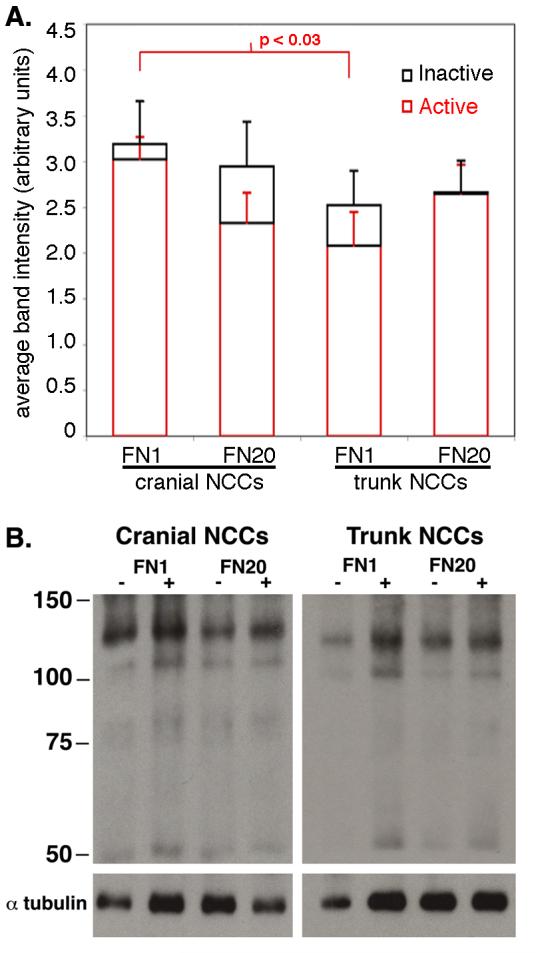
Surface levels of active and inactive integrin β1 in cranial and trunk NCCs cultured on low (FN1) and high (FN20) concentrations of fibronectin. (A) Cell surface labeled integrins were immunoprecipitated and analyzed on western blot. Average band intensities of activated integrin β1 were determined for cranial and trunk NCCs cultured on FN1 or FN20 without Mn2+ treatment (red). Average band intensities of activated integrin β1 with Mn2+ treatment are shown in black. The levels of activated integrin β1 on the surface of cranial NCCs cultured on FN1 is significantly different from that of trunk NCCs cultured on the same substratum (P < 0.05; t test). (B) All eight conditions were simultaneously analyzed in a total of seven experiments. Representative gel from one experiment.
Clustering of activated integrin β1 in cranial neural crest
In some cases, integrin activation can slow cells by increasing the number and/or strength of adhesions to the substratum [8]. However, manganese-induced changes in integrin activation can also be transient, with cells regulating total surface levels of activated protein [27]. Since Mn2+ treatment did not cause a significant increase in the number of activated surface integrin β1 for any condition, we predicted that NCC motility on fibronectin is instead regulated by the distribution of activated integrins. Clustering of activated integrins into large focal adhesions increases cell adhesion to the substratum and slows cell motility [9]. To verify that activated integrin β1 clusters were indeed focal adhesions, i.e. linked to the cytoskeleton, NCCs were cultured on fibronectin and stained for activated integrin β1 and actin. Clusters of activated integrin β1 colocalized with the tips of actin stress fibers (data not shown), consistent with previous analysis of clustered integrins in focal adhesions [28].
To quantify the change in distribution of activated integrin β1 in cell surface adhesions, cranial NCCs were fixed but not permeabilized, and stained for activated integrin β1 without and with Mn2+ treatment (Fig. 5A). The total area and focal adhesion area of each cell was measured to determine the percentage of total cell area that contained adhesions (Table 1). To determine the degree of clustering, the percentage of adhesion area was divided by the total number of adhesions to generate a clustering index. Thus, an increase in the clustering index number indicates greater integrin avidity and increased cell adhesion. For cranial NCCs cultured on FN1, there was a significant increase (P < 0.05; t test) in clustering of activated surface integrin β1 after Mn2+ treatment (Fig. 5A). In contrast, the clustering of activated surface integrin β1 in cranial NCCs cultured on FN20 did not change after Mn2+ treatment (Table 1 and Fig. 5A). These results, in combination with the results presented in Figure 4, suggest that after Mn2+ treatment, cranial NCCs on FN1 slow due to increased integrin avidity, whereas cranial NCCs on FN20 slow due to increased integrin affinity.
Figure 5.

Mn2+-induced clustering of activated integrin β1 differs between NCCs cultured on low and high fibronectin. (A) Cranial NCCs were cultured on low (FN1) high (FN20) concentrations of fibronectin and stained for activated integrin β1 without (−Mn2+) and with (+Mn2+) treatment with Mn2+. For cranial NCCs, the clustering index (percent of focal adhesion area/focal adhesion number) significantly increases after Mn2+ treatment on FN1 (P < 0.01; t test) but not on FN20 (P > 0.05; t test). (B) Trunk NCCs were cultured on low (FN1) high (FN20) concentrations of fibronectin and stained for activated integrin β1 without (−Mn2+) and with (+Mn2+) treatment with Mn2+. For trunk NCCs, the clustering index increases after Mn2+ treatment on FN20 (P < 0.05; t test), but not on FN1 (P > 0.05; t test).
Table 1.
Integrin clustering.
| Condition (# of cells) |
Cell area (μm2) |
Focal adhesion area |
% Focal adhesion area |
Focal adhesion count |
Clustering index |
|---|---|---|---|---|---|
| CF1− (n = 23) |
2424 ± 175 |
255 ± 23 |
10.6 ± 0.7 |
244 ± 20 |
4.8 ± 0.4 |
| CF1+ (n = 35) |
2035 ± 99 |
251 ± 18 |
12.5 ± 0.7 |
212 ± 12 |
6.1 ± 0.3 |
| CF20− (n = 30) |
2742 ± 135 |
270 ± 20 |
9.8 ± 0.6 |
216 ± 15 |
5.0 ± 0.3 |
| CF20+ (n = 21) |
2787 ± 188 |
278 ± 22 |
10.1 ± 0.6 |
247 ± 21 |
4.6 ± 0.4 |
| TF1− (n = 33) |
2153 ± 120 |
249 ± 18 |
11.4 ± 0.4 |
235 ± 16 |
5.3 ± 0.3 |
| TF1+ (n = 29) |
2192 ± 115 |
250 ± 15 |
11.6 ± 0.5 |
237 ± 14 |
5.1 ± 0.3 |
| TF20− (n = 33) |
2312 ± 130 |
258 ± 12 |
11.7 ± 0.5 |
224 ± 11 |
5.5 ± 0.3 |
| TF20+ (n = 45) |
2152 ± 108 |
255 ± 13 |
12.2 ± 0.5 |
210 ± 10 |
6.2 ± 0.3 |
Clustering of activated integrin β1 in trunk neural crest
As in Figure 5A, trunk NCCs were fixed but not permeabilized, and stained for activated integrin β1 without and with Mn2+ treatment (Fig. 5B). For trunk NCCs the effect of Mn2+ treatment on clustering was opposite that of cranial NCCs. On FN1, there was no increase in clustering of activated surface integrin β1 after Mn2+ treatment, whereas on FN20 there was an increase in clustering of activated surface integrin β1 after Mn2+ treatment (Table 1 and Fig. 5B). These results, in combination with the results presented in Figure 4, suggest that after Mn2+ treatment, trunk NCCs on FN1 slow due to increased integrin affinity, whereas trunk NCCs on FN20 slow due to increased avidity. Together, these results indicate that a combination of the levels of activated surface integrins and their distribution regulates NCC motility, and furthermore, that cranial and trunk NCCs differ in their response to substratum density.
DISCUSSION
In this work we have investigated the role of integrin activation in regulated cranial and trunk NCC motility on fibronectin in vitro. We show that integrin functional regulation is substratum-dependent and plays a greater role in NCC motility on fibronectin than on laminin, indicating that on fibronectin NCCs maintain a balance of integrin affinity and avidity to preserve motility. Activated integrin β1 is distributed differently on the surface of NCCs cultured on fibronectin compared to laminin, indicating that integrin clustering is substratum-dependent. On varying concentrations of fibronectin, activation of surface integrins with Mn2+ slows cranial but not trunk NCCs in a substratum concentration-dependent manner. Although there is only a small change in the number of activated integrins on the surface after Mn2+ treatment, the distribution of activated integrins changes significantly, in particular on the cell surface of cranial NCCs cultured on low fibronectin and trunk NCCs cultured on high fibronectin. Our findings (summarized in Fig. 6) are consistent with the possibility that a combination of activated surface integrin levels (receptor affinity) and the degree to which those receptors are clustered (receptor avidity) determines NCC motility on fibronectin. Our results suggest that efficient motility on fibronectin is regulated by the appropriate matching of receptor affinity and avidity to ligand availability (Fig. 6). On low concentrations of fibronectin (FN1), there is very little ligand available so efficient motility may require a high receptor affinity, i.e. mostly active receptors on the surface to increase the probability of ligand binding events. Based on immunoprecipitaiton analysis, cranial NCCs have a greater number of activated receptors on their surface on FN1 compared to trunk NCCs on the same substratum which may underlie the difference in their rate of migration. Mn2+ treatment may slow cranial NCCs on FN1 by clustering activated receptors thereby increasing avidity to the substratum, and slows trunk NCCs on the same substratum by activating the inactive pool of surface receptors thereby increasing affinity. In contrast, on high concentrations of fibronectin (20-fold higher density), ligand is more readily available and fewer receptors need to be activated to achieve the same probability of ligand binding. On high fibronectin (FN20), greater numbers of activated surface receptors would increase cell adhesion and concomitantly decrease motility, which presumably is why trunk NCCs travel slower than cranial NCCs on FN20. Mn2+ treatment may slow cranial NCCs on high fibronectin by activating the inactive pool of surface receptors thereby increasing affinity to the substratum, and slow trunk NCCs on the same substratum by clustering activated receptors thereby increasing cell avidity.
Figure 6.
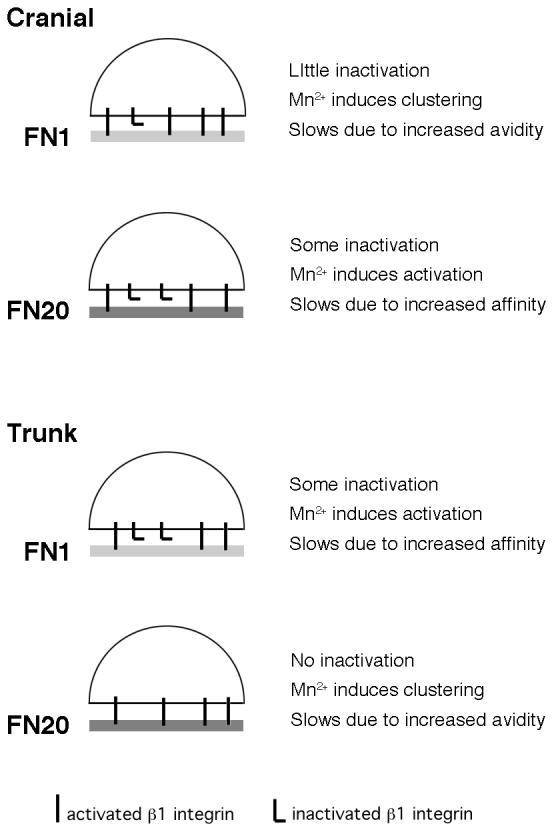
Diagram summarizing results of neural crest motility on fibronectin. NCC motility on fibronectin is mediated by a combination of activated surface integrin β1 levels and integrin β1 clustering. On low fibronectin concentrations (FN1), cranial NCCs have few inactivated β1 receptors on their surface. Mn2+ treatment induces integrin β1 clustering in cranial NCCs cultured on FN1, and may slow their motility due to increased avidity to the substratum. On high fibronectin concentrations (FN20), cranial NCCs have some inactivated β1 receptors on their surface. Mn2+ treatment activates some inactive β1 integrins and may slow cell motility due to increased affinity for the substratum. The effects of Mn2+ treatment on non-β1-containing integrins has not been determined, but αVβ3 and αVβ5 are known to play important roles in neural crest motility. In contrast to cranial NCCs, on low fibronectin (FN1), trunk NCCs have some inactivated β1 receptors on their surface. Mn2+ treatment activates some inactive β1 integrins and may slow cell motility due to increased affinity for the substratum. For trunk NCCs on high fibronectin (FN20), all surface β1 integrins are activated. Mn2+ treatment induces integrin β1 clustering in trunk NCCs cultured on FN20, and may slow their motility due to increased avidity to the substratum.
Integrin activation and motility
The first observation that functional regulation of integrins played a role in the motility of developmentally important cells showed that developing retinal neurons which had lost responsiveness to laminin regained the ability to bind laminin after integrin activation [29]. These authors postulated that the observed developmental change in retinal neurons must be due to mechanisms which lead to the reversible inactivation of receptor populations on the cell surface. Furthermore, in a different cell population, integrin activation had little effect on neurite outgrowth of dorsal root ganglion neurons [30], suggesting that intrinsic integrin activation states differ among distinct cell types. Our finding that integrin activation regulates NCC motility on fibronectin is consistent with the notion that some cells fine tune integrin activation to promote efficient motility.
The fact that integrin activation regulates NCC motility to a greater degree on fibronectin compared to laminin indicates that substratum-specific mechanisms regulate neural crest migration. This finding is consistent with previous studies which have shown that the effect of integrin activation on lymphoblast motility is dependent not only on the substratum, but also on the ligand concentration [31]. It is also possible that changes in the activation state of non β1 containing integrins, particularly αVβ3 or αVβ5, may play an important role in regulating neural crest motility on fibronectin. This possibility is consistent with the data shown in Figure 1, that manganese has greater effects on a fibronectin, a ligand for αV-containing integrins [17, 38], compared to laminin, a substratum that interacts primarily with β1-containing integrins [11,14, 22, 23]. However, the lack of reagents suitable for monitoring the activation state of αV-containing integrins in this system limits our ability to investigate this possibility.
Alternatively, immunoprecipitation might not fully reveal all of the activated β1-containing integrins, leading to an underestimate of the level of activation receptors by manganese. However, following manganese treatment there is a statistically significant difference between the surface levels of activated integrin β1 on cranial and trunk NCCs cultured on low fibronectin concentrations (Fig. 4), suggesting that differences in β1 activation state make different contributions to neural crest motility on fibronectin depending on the axial origin of the cells (Fig. 6)
Interestingly, the effect of integrin activation on NCC motility was dependent on the substratum concentration, but only for cranial cells. Early analyses of cranial and trunk NCC motility in vitro, established that cranial and trunk NCCs differ in their mechanisms of adhesion to fibronectin [23], however these authors only looked at one concentration of fibronectin and did not investigate whether these differences translated to differences in motility. It is tempting to speculate that differences between the way these two NC subpopulations modulate their adhesion to the substratum contribute to differences in their migration in vivo, especially since it is likely that both cranial and trunk NCCs encounter large variations in fibronectin density during migration.
Cytoskeletal organization and motility
Substratum-induced changes in cytoskeletal organization have been implicated in cell migration [32]. Integrin receptors can be found on the surface of cells either associated with stable, focal adhesions or migratory, focal contacts. Thus, the difference between stationary and migratory cells typically reflects a balance of integrin receptor usage and the functional regulation of those receptors. Integrins cluster into focal adhesions which are rich in structural proteins including vinculin, talin, paxillin, zyxin, and α-actinin, as well as tyrosine kinases such as focal adhesion kinase (FAK) and Src [33-35]. One of the earliest analyses into the spatial distribution of cytoskeletal components in migrating NCCs in situ compared three different neural crest subpopulations, cranial, vagal and trunk, and found that trunk and vagal NCCs express increasing amounts of vinculin as they migrate [36]. Moreover, this was not the case for cranial NCCs and thus it was postulated that particular adhesive behaviors of these cells may be related to their distinct differentiation. Our data shows that regulation of both receptor affinity and avidity control NCC motility, however, cranial and trunk NCCs regulate these processes in response to substratum concentration in opposite ways. These data suggest that cell-type specific regulation of adhesive structures in combination with ligand availability determines NCC motility on fibronectin.
Clearly, the regulation of adhesion in migrating NCCs must be a dynamic and multifaceted process. Tyrosine kinases play important roles in controlling substratum adhesion [37] and promoting cell motility [38]. Both the size and distribution of focal adhesions are acutely sensitive to the actions of tyrosine kinases and phosphatases, and inhibitors of these co-regulators often have cell-specific effects [39, 40]. Previous studies have investigated the role of phosphotyrosine signaling in regulating a balance of cell-cell adhesion and contact inhibition of movement, versus cell-substratum interactions during trunk NCC migration [41]. It is possible that the activation state of tyrosine kinases and phosphatases differs between cranial and trunk NCCs, and that these differences correspond to the distinct way these cell types cluster activated integrins.
Neural crest motility and cell fate
In the developing embryo, different populations of neural crest (cranial, vagal, trunk, and sacral) follow different migratory pathways and give rise to distinct derivatives [42]. Generally, NCCs can assume position-appropriate fates when grafted into ectopic environments. However, some NCC subpopulations will not migrate or differentiate appropriately when grafted into a heterotopic environment. For example, trunk NCCs cannot form all mesectodermal derivatives when transplanted into cranial levels [43, 44]. Interestingly, trunk NCCs can contribute to the trigeminal ganglia and corneal stroma, indicating that although they are able to migrate in a new environment, only certain pathways are available to them [45]. Because target-derived differentiation cues lie far away from the origin of neural crest migration and these signals may be short-lived, the ability to migrate efficiently in a specific embryonic environment may determine (or limit) the final destinations and cell fates available to particular NCCs.
There is evidence that neural crest phenotypes are specified in broad domains along the anterior/posterior (A/P) axis, and that gene expression patterns respect these broad domains [46-48]. For example, the matrix metalloprotease ADAM13 [49] and the hyaluronic acid receptor CD44 [50] are know to be expressed in cranial, but not trunk NCCs at early stages. Furthermore, our lab has previously shown that cranial and trunk NCCs differ in their migratory ability and integrin regulation when cultured on high concentrations of laminin [16]. Our finding that trunk NCCs are faster on low concentrations of fibronectin compared to high, while cranial NCCs travel at the same rate on both concentrations of fibronectin, suggests that the ability to migrate efficiently in a specific embryonic environment may determine the final destinations available to neural crest populations. This suggests that differences in NCC migratory ability may influence where NCCs go and thereby what derivatives they are able to produce.
Although the roles of integrin activation and receptor clustering have been well studied in transformed cell lines and adult primary cell populations, very little is known about how these mechanisms regulate developmental cell motility. During migration, NCCs encounter distinct environments and must dynamically regulate their adhesion in order to maintain an efficient rate of motility during migration to their target tissues. Our results suggest that both substratum-specific and cell type-specific differences between cranial and trunk NCCs regulate their cytoskeletal organization and subsequently, their migratory behavior.
ACKNOWLEDGMENTS
We thank Drs. M. Beckerle, R. I. Dorsky and S.A. Scott for comments on the manuscript. This work was supported by a Basil O'Connor Award from the March of Dimes and NIH-R01 NS 048382 to M.L.C. and NIH-F31-NS43849-01 to L.R.S.
Footnotes
Publisher's Disclaimer: This is a PDF file of an unedited manuscript that has been accepted for publication. As a service to our customers we are providing this early version of the manuscript. The manuscript will undergo copyediting, typesetting, and review of the resulting proof before it is published in its final citable form. Please note that during the production process errors may be discovered which could affect the content, and all legal disclaimers that apply to the journal pertain.
REFERENCES
- 1.Anderson DJ. Genes, lineages and the neural crest: a speculative review. Philos Trans R Soc Lond B Biol Sci. 2000;355:953–64. doi: 10.1098/rstb.2000.0631. [DOI] [PMC free article] [PubMed] [Google Scholar]
- 2.Bronner-Fraser M. Mechanisms of neural crest cell migration. Bioessays. 1993;15:221–30. doi: 10.1002/bies.950150402. [DOI] [PubMed] [Google Scholar]
- 3.Christiansen JH, Coles EG, Wilkinson DG. Molecular control of neural crest formation, migration and differentiation. Curr Opin Cell Biol. 2000;12:719–24. doi: 10.1016/s0955-0674(00)00158-7. [DOI] [PubMed] [Google Scholar]
- 4.Kalcheim C. Mechanisms of early neural crest development: from cell specification to migration. Int Rev Cytol. 2000;200:143–96. doi: 10.1016/s0074-7696(00)00004-8. [DOI] [PubMed] [Google Scholar]
- 5.Palecek SP, Loftus JC, Ginsberg MH, Lauffenburger DA, Horwitz AF. Integrin-ligand binding properties govern cell migration speed through cell-substratum adhesiveness. Nature. 1997;385:537–40. doi: 10.1038/385537a0. [DOI] [PubMed] [Google Scholar]
- 6.Maheshwari G, Brown G, Lauffenburger DA, Wells A, Griffith LG. Cell adhesion and motility depend on nanoscale RGD clustering. J Cell Sci. 2000;113:1677–86. doi: 10.1242/jcs.113.10.1677. [DOI] [PubMed] [Google Scholar]
- 7.Calderwood DA. Integrin activation. J Cell Sci. 2004;117:657–66. doi: 10.1242/jcs.01014. [DOI] [PubMed] [Google Scholar]
- 8.van der Flier A, Sonnenberg A. Function and interactions of integrins. Cell Tissue Res. 2001;305:285–98. doi: 10.1007/s004410100417. [DOI] [PubMed] [Google Scholar]
- 9.Duband JL, Nuckolls GH, Ishihara A, Hasegawa T, Yamada KM, Thiery JP, Jacobson K. Fibronectin receptor exhibits high lateral mobility in embryonic locomoting cells but is immobile in focal contacts and fibrillar streaks in stationary cells. J Cell Biol. 1988;107:1385–96. doi: 10.1083/jcb.107.4.1385. [DOI] [PMC free article] [PubMed] [Google Scholar]
- 10.Alfandari D, Cousin H, Gaultier A, Hoffstrom BG, DeSimone DW. Integrin alpha5beta1 supports the migration of Xenopus cranial neural crest on fibronectin. Dev Biol. 2003;260:449–64. doi: 10.1016/s0012-1606(03)00277-x. [DOI] [PubMed] [Google Scholar]
- 11.Desban N, Duband JL. Avian neural crest cell migration on laminin: interaction of the alpha1beta1 integrin with distinct laminin-1 domains mediates different adhesive responses. J Cell Sci. 1997;110:2729–44. doi: 10.1242/jcs.110.21.2729. [DOI] [PubMed] [Google Scholar]
- 12.Goh KL, Yang JT, Hynes RO. Mesodermal defects and cranial neural crest apoptosis in alpha5 integrin-null embryos. Development. 1997;124:4309–19. doi: 10.1242/dev.124.21.4309. [DOI] [PubMed] [Google Scholar]
- 13.Kil SH, Krull CE, Cann G, Clegg D, Bronner-Fraser M. The alpha4 subunit of integrin is important for neural crest cell migration. Dev Biol. 1998;202:29–42. doi: 10.1006/dbio.1998.8985. [DOI] [PubMed] [Google Scholar]
- 14.Kil SH, Lallier T, Bronner-Fraser M. Inhibition of cranial neural crest adhesion in vitro and migration in vivo using integrin antisense oligonucleotides. Dev Biol. 1996;179:91–101. doi: 10.1006/dbio.1996.0243. [DOI] [PubMed] [Google Scholar]
- 15.Lallier TE, Whittaker CA, DeSimone DW. Integrin alpha 6 expression is required for early nervous system development in Xenopus laevis. Development. 1996;122:2539–54. doi: 10.1242/dev.122.8.2539. [DOI] [PubMed] [Google Scholar]
- 16.Strachan LR, Condic ML. Neural crest motility and integrin regulation are distinct in cranial and trunk populations. Dev. Biol. 2003;259:288–302. doi: 10.1016/s0012-1606(03)00187-8. [DOI] [PubMed] [Google Scholar]
- 17.Testaz S, Delannet M, Duband J. Adhesion and migration of avian neural crest cells on fibronectin require the cooperating activities of multiple integrins of the (beta)1 and (beta)3 families. J Cell Sci. 1999;112:4715–28. doi: 10.1242/jcs.112.24.4715. [DOI] [PubMed] [Google Scholar]
- 18.Testaz S, Duband JL. Central role of the alpha4beta1 integrin in the coordination of avian truncal neural crest cell adhesion, migration, and survival. Dev Dyn. 2001;222:127–40. doi: 10.1002/dvdy.1181. [DOI] [PubMed] [Google Scholar]
- 19.Tucker RP. Antisense knockdown of the beta1 integrin subunit in the chicken embryo results in abnormal neural crest cell development. Int J Biochem Cell Biol. 2004;36:1135–9. doi: 10.1016/j.biocel.2004.01.010. [DOI] [PubMed] [Google Scholar]
- 20.Duband JL, Thiery JP. Distribution of laminin and collagens during avian neural crest development. Development. 1987;101:461–78. doi: 10.1242/dev.101.3.461. [DOI] [PubMed] [Google Scholar]
- 21.Newgreen D, Thiery JP. Fibronectin in early avian embryos: synthesis and distribution along the migration pathways of neural crest cells. Cell Tissue Res. 1980;211:269–91. doi: 10.1007/BF00236449. [DOI] [PubMed] [Google Scholar]
- 22.Duband JL, Dufour S, Yamada SS, Yamada KM, Thiery JP. Neural crest cell locomotion induced by antibodies to beta 1 integrins. A tool for studying the roles of substratum molecular avidity and density in migration. J Cell Sci. 1991;98:517–32. doi: 10.1242/jcs.98.4.517. [DOI] [PubMed] [Google Scholar]
- 23.Lallier T, Leblanc G, Artinger KB, Bronner-Fraser M. Cranial and trunk neural crest cells use different mechanisms for attachment to extracellular matrices. Development. 1992;116:531–41. doi: 10.1242/dev.116.3.531. [DOI] [PubMed] [Google Scholar]
- 24.de Curtis I, Quaranta V, Tamura RN, Reichardt LF. Laminin receptors in the retina: sequence analysis of the chick integrin alpha 6 subunit. Evidence for transcriptional and posttranslational regulation. J Cell Biol. 1991;113:405–16. doi: 10.1083/jcb.113.2.405. [DOI] [PMC free article] [PubMed] [Google Scholar]
- 25.Hamburger V. The stage series of the chick embryo. Dev Dyn. 1992;195:273–5. doi: 10.1002/aja.1001950405. [DOI] [PubMed] [Google Scholar]
- 26.Strachan LR, Condic ML. Cranial neural crest recycle surface integrins in a substratum-dependent manner to promote rapid motility. J Cell Biol. 2004;167:545–54. doi: 10.1083/jcb.200405024. [DOI] [PMC free article] [PubMed] [Google Scholar]
- 27.Lemons ML, Condic ML. Combined integrin activation and intracellular cAMP cause Rho GTPase dependent growth cone collapse on laminin-1. Exp Neurol. 2006 doi: 10.1016/j.expneurol.2006.06.008. [DOI] [PubMed] [Google Scholar]
- 28.Kawakami K, Tatsumi H, Sokabe M. Dynamics of integrin clustering at focal contacts of endothelial cells studied by multimode imaging microscopy. J Cell Sci. 2001;114:3125–35. doi: 10.1242/jcs.114.17.3125. [DOI] [PubMed] [Google Scholar]
- 29.Neugebauer KM, Reichardt LF. Cell-surface regulation of beta 1-integrin activity on developing retinal neurons. Nature. 1991;350:68–71. doi: 10.1038/350068a0. [DOI] [PMC free article] [PubMed] [Google Scholar]
- 30.Ivins JK, Yurchenco PD, Lander AD. Regulation of Neurite Outgrowth by Integrin Activation. J Neurosci. 2000;20:6551–6560. doi: 10.1523/JNEUROSCI.20-17-06551.2000. [DOI] [PMC free article] [PubMed] [Google Scholar]
- 31.Gomez M, Luque A, del Pozo MA, Hogg N, Sanchez-Madrid F, Cabanas C. Functional relevance during lymphocyte migration and cellular localization of activated beta1 integrins. Eur J Immunol. 1997;27:8–16. doi: 10.1002/eji.1830270103. [DOI] [PubMed] [Google Scholar]
- 32.Liu S, Thomas SM, Woodside DG, Rose DM, Kiosses WB, Pfaff M, Ginsberg MH. Binding of paxillin to alpha4 integrins modifies integrin-dependent biological responses. Nature. 1999;402:676–81. doi: 10.1038/45264. [DOI] [PubMed] [Google Scholar]
- 33.Burridge K, Fath K, Kelly T, Nuckolls G, Turner C. Focal adhesions: transmembrane junctions between the extracellular matrix and the cytoskeleton. Annu Rev Cell Biol. 1988;4:487–525. doi: 10.1146/annurev.cb.04.110188.002415. [DOI] [PubMed] [Google Scholar]
- 34.Clark EA, Brugge JS. Integrins and signal transduction pathways: the road taken. Science. 1995;268:233–9. doi: 10.1126/science.7716514. [DOI] [PubMed] [Google Scholar]
- 35.Beckerle MC. Zyxin: zinc fingers at sites of cell adhesion. Bioessays. 1997;19:949–57. doi: 10.1002/bies.950191104. [DOI] [PubMed] [Google Scholar]
- 36.Duband JL, Thiery JP. Spatial and temporal distribution of vinculin and talin in migrating avian neural crest cells and their derivatives. Development. 1990;108:421–33. doi: 10.1242/dev.108.3.421. [DOI] [PubMed] [Google Scholar]
- 37.Burridge K, Turner CE, Romer LH. Tyrosine phosphorylation of paxillin and pp125FAK accompanies cell adhesion to extracellular matrix: a role in cytoskeletal assembly. J Cell Biol. 1992;119:893–903. doi: 10.1083/jcb.119.4.893. [DOI] [PMC free article] [PubMed] [Google Scholar]
- 38.Klemke RL, Yebra M, Bayna EM, Cheresh DA. Receptor tyrosine kinase signaling required for integrin alpha v beta 5-directed cell motility but not adhesion on vitronectin. J Cell Biol. 1994;127:859–66. doi: 10.1083/jcb.127.3.859. [DOI] [PMC free article] [PubMed] [Google Scholar]
- 39.Retta SF, Barry ST, Critchley DR, Defilippi P, Silengo L, Tarone G. Focal adhesion and stress fiber formation is regulated by tyrosine phosphatase activity. Exp Cell Res. 1996;229:307–17. doi: 10.1006/excr.1996.0376. [DOI] [PubMed] [Google Scholar]
- 40.Monier-Gavelle F, Duband JL. Control of N-cadherin-mediated intercellular adhesion in migrating neural crest cells in vitro. J Cell Sci. 1995;108:3839–53. doi: 10.1242/jcs.108.12.3839. [DOI] [PubMed] [Google Scholar]
- 41.Brennan H, Smith S, Stoker A. Phosphotyrosine signalling as a regulator of neural crest cell adhesion and motility. Cell Motil Cytoskeleton. 1999;42:101–13. doi: 10.1002/(SICI)1097-0169(1999)42:2<101::AID-CM2>3.0.CO;2-W. [DOI] [PubMed] [Google Scholar]
- 42.Bronner-Fraser M. Environmental influences on neural crest cell migration. J Neurobiol. 1993;24:233–47. doi: 10.1002/neu.480240209. [DOI] [PubMed] [Google Scholar]
- 43.Epperlein H, Meulemans D, Bronner-Fraser M, Steinbeisser H, Selleck MA. Analysis of cranial neural crest migratory pathways in axolotl using cell markers and transplantation. Development. 2000;127:2751–61. doi: 10.1242/dev.127.12.2751. [DOI] [PubMed] [Google Scholar]
- 44.Le Douarin NM, Creuzet S, Couly G, Dupin E. Neural crest cell plasticity and its limits. Development. 2004;131:4637–50. doi: 10.1242/dev.01350. [DOI] [PubMed] [Google Scholar]
- 45.Lwigale PY, Conrad GW, Bronner-Fraser M. Graded potential of neural crest to form cornea, sensory neurons and cartilage along the rostrocaudal axis. Development. 2004;131:1979–91. doi: 10.1242/dev.01106. [DOI] [PubMed] [Google Scholar]
- 46.Couly G, Creuzet S, Bennaceur S, Vincent C, Le Douarin NM. Interactions between Hox-negative cephalic neural crest cells and the foregut endoderm in patterning the facial skeleton in the vertebrate head. Development. 2002;129:1061–73. doi: 10.1242/dev.129.4.1061. [DOI] [PubMed] [Google Scholar]
- 47.del Barrio MG, Nieto MA. Overexpression of Snail family members highlights their ability to promote chick neural crest formation. Development. 2002;129:1583–93. doi: 10.1242/dev.129.7.1583. [DOI] [PubMed] [Google Scholar]
- 48.Trainor PA, Sobieszczuk D, Wilkinson D, Krumlauf R. Signalling between the hindbrain and paraxial tissues dictates neural crest migration pathways. Development. 2002;129:433–42. doi: 10.1242/dev.129.2.433. [DOI] [PubMed] [Google Scholar]
- 49.Alfandari D, Cousin H, Gaultier A, Smith K, White JM, Darribere T, DeSimone DW. Xenopus ADAM 13 is a metalloprotease required for cranial neural crest-cell migration. Curr Biol. 2001;11:918–30. doi: 10.1016/s0960-9822(01)00263-9. [DOI] [PubMed] [Google Scholar]
- 50.Corbel C, Lehmann A, Davison F. Expression of CD44 during early development of the chick embryo. Mech Dev. 2000;96:111–4. doi: 10.1016/s0925-4773(00)00347-6. [DOI] [PubMed] [Google Scholar]