

Abstract
In the cell, the activity of tRNA is governed by its acylation state. Interactions with the ribosome, translation factors, and regulatory elements are strongly influenced by the acyl group, and presumably other cellular components that interact with tRNA also use the acyl group as a specificity determinant. Thus, those using biochemical approaches to study any aspect of tRNA biology should be familiar with effective methods to prepare and evaluate acylated tRNA reagents. Here, methods to prepare aminoacyl-tRNA, N-acetyl-aminoacyl-tRNA, and fMet-tRNAfMet and to assess their homogeneity are described. Using these methods, acylated tRNAs of high homogeneity can be reliably obtained.
Keywords: aminoacyl-tRNA, N-acetyl-aminoacyl-tRNA, fMet-tRNAfMet, acylation state, acid gel electrophoresis
1. Introduction
In the cell, tRNA exists in three forms: aminoacyl-tRNA, peptidyl-tRNA, and deacylated tRNA. These forms are distinguished by their acylation state (i.e., whether an amino acid, peptide, or no group is attached to the 3' end of tRNA). As one might expect, the acylation state is a critical specificity determinant for interactions with the ribosome [1-9], translation factors [10-15], regulatory elements [16, 17], and other cellular components that interact with tRNA [reviewed in 18].
The amino acid (or peptide) is linked to the ribose of the 3' terminal adenosine (A76) of tRNA via an ester bond. This ester bond is sensitive to alkaline hydrolysis, which is generally true of esters with a neighboring hydroxyl group [19, 20]. In solutions of near-neutral pH (7 to 9), aminoacyl-tRNAs can spontaneously deacylate with half-lives that range from minutes to tens of minutes. Compared to aminoacyl-tRNA, peptidyl-tRNA is considerably more stable [19, 21]. This can be explained by the fact that a free α-amino group, largely protonated at neutral pH, has higher propensity to withdraw electrons from the carbonyl carbon than a substituted amino group. The nature of the amino acid also influences the stability of the ester bond [19, 22], which presumably reflects the contribution of the side chain to inductive (electron-withdrawing) effects. Among the least stable aminoacyl-tRNAs are Arg-tRNA, Lys-tRNA, Pro-tRNA, and Ala-tRNA.
Because the acylation state of tRNA governs its biological activities and the ester linkage can be quite susceptible to spontaneous hydrolysis, those interested in studying tRNA need to know how to prepare and evaluate acylated tRNAs. In this article, we describe methods to prepare acylated tRNA reagents and assess their homogeneity. Approaches to purify particular isoacceptors from bulk tRNA are not presented here but have been discussed elsewhere [23-26]. Currently, there are at least three commercial sources for purified tRNAs (Sigma, Chemical Block, and MP Biomedicals).
2. Preparation of aminoacyl-tRNA
It is important to keep in mind that the ester bond of aminoacyl-tRNA is susceptible to alkaline hydrolysis. Therefore, after the charging reaction, the aminoacyl-tRNA product should be extracted, precipitated, de-salted, and stored under acidic conditions (e.g., pH 5.2).
It is highly recommended that the efficiency of aminoacylation be tested in analytical experiments (∼ 40 pmol tRNA) before preparative scale reactions (∼4000 pmol tRNA; see details below) are set up. In analytical experiments, there is no need to phenol extract after the charging reaction. Simply add sodium acetate (NaOAc; pH 5.2) to 300 mM, ethanol precipitate, dissolve the pellet in acid gel loading buffer, and subject the sample to acid gel electrophoresis (see Section 3). Based on our experience, the extent of aminoacylation of purified tRNAs from various sources (i.e., Sigma, Chemical Block) should exceed 90%.
Whenever working with RNA, gloves should be worn to prevent contamination by RNases, which are natural components of healthy human skin [27]. As an additional precaution, all solutions should be made using nanopure water and baked glassware or new plasticware.
2.1 Materials required
purified tRNA (Note: The extinction coefficient at 260 nm for a particular species of pure tRNA can be estimated based on its amino acid acceptor activity, which is typically provided by the supplier.)
amino acid (Use of 14C-labeled amino acid allows a more accurate quantification of the aminoacyl-tRNA product. If the product will be acetylated, 14C-labeled amino acid is recommended in order to assess the extent of acetylation.)
1 M HEPES-KOH (pH 7.6)
100 mM ATP (pH 7)
100 mM DTT
3 M KCl
1 M MgCl2
aminoacyl-tRNA synthetase (AARS; Although S-100 extracts from E. coli [28] often give high-level charging, we typically use purified or partially-purified AARS. Over-expression constructs encoding tagged-versions of AARSs are available from several laboratories and are also available from the ASKA collection (National Institute of Genetics, Japan).)
3 M NaOAc (pH 5.2)
phenol saturated with 300 mM NaOAc (pH 5.2)
CHCl3 and isoamyl alcohol (24:1 mixture)
ethanol
Sephadex G-25 (Amersham Biosciences). To prepare, combine dry resin (∼ 8 g) and ∼ 70 mL 2 mM NaOAc (pH 5.2) in a 125 mL screw-cap glass bottle, autoclave for 10 minutes with the cap loose, and allow to cool. The volume of buffer above the swelled resin should be about half of the total volume. If it is more than half after cooling, remove the excess. Store the equilibrated resin at 4°C.
Disposable Bio-Spins columns (Bio-Rad).
Falcon 6 mL, 12 × 75 mm, disposable test tubes (Becton Dickinson) or other appropriately-sized tubes
2.2 Protocol
- In a reaction volume of 500 μL, combine the following components:
- tRNA (4000 pmol; ∼ 3 A260 units)
- amino acid (100 μM; 14C-labeled is recommended)
- HEPES-KOH (pH 7.6; 100 mM)
- ATP (10 mM)
- DTT (1 mM)
- KCl (10 mM)
- MgCl2 (20 mM)
- AARS (∼ 1 μM; The amount added should be sufficient to ensure complete aminoacylation as judged by preliminary analytical experiments.)
Incubate the reaction in a circulating water bath at 37°C for 20 minutes.
Add 50 μL 3 M NaOAc (pH 5.2).
Extract with equal volume of phenol for 10 minutes using a vortex-mixer in the cold room.
Separate the phases by spinning in a microfuge for 5 minutes at top speed (∼ 13,000 rpm). Move the aqueous phase to a new microfuge tube.
Back extract the phenol phase with 300 mM NaOAc (pH 5.2), spin, remove the aqueous phase and combine it with the aqueous fraction saved from step 5.
Repeat steps 5 and 6. (Note: The volume of the aqueous phase keeps increasing, so additional microfuge tubes will be needed for subsequent extractions. Always extract 500 μL or less per 1.5 mL tube).
Extract the aqueous phase twice with a mixture of CHCl3 and isoamyl alcohol (24:1).
Add 2.5 volumes of 100% ethanol to precipitate the aminoacyl-tRNA. The solution will become cloudy as the ATP co-precipitates.
Pellet the precipitate by centrifugation in the cold room (e.g., 15 minutes in a microfuge at 13K rpm). Remove supernatant.
Wash pellets with 70% ethanol.
Dissolve pellets in a small volume of 2 mM NaOAc (pH 5.2). For example, if microfuge tubes were used in step 9, dissolve each pellet in 20 μL and then combine.
Prepare Sephadex G-25 spin columns. Add 2.5 mL of G-25 slurry (in 2 mM NaOAc, pH 5.2) to each column, place in an appropriately-sized collection tube (e.g., Falcon 6 mL disposable test tube), and use a clinical centrifuge to pack the column. The volume of the packed resin should be about 1 mL.
Pass the aminoacyl-tRNA through spin columns. Load < 50 μL on each ∼ 1 mL column. For collection, stack two topless microfuge tubes in a 15 mL plastic tube (e.g., Falcon), and then place the (loaded) spin column into the top microfuge tube prior to centrifugation. This step removes the remaining small molecules.
Combine, aliquot, and store at −70°C.
Determine counts per minute of the [14C]-aminoacyl-tRNA preparation and of the stock [14C]-amino acid by scintillation counting. Calculate the concentration of aminoacyl-tRNA based on the specific activity of the amino acid stock. If radiolabel is not employed, estimate the concentration of aminoacyl-tRNA based on A260. Determine the extent of aminoacylation using acid gel electrophoresis (see below). Generally, the yield is 70 to 80% and the extent of charging is > 90%.
3. Use of acid gel electrophoresis to determine the extent of aminoacylation
A key technical advance came when RajBhandary and coworkers showed that aminoacyl-tRNA can be separated from deacylated tRNA using polyacrylamide gel electrophoresis under acidic conditions [29]. This technique allows direct assessment of the extent of aminoacylation and is clearly superior to earlier methods that involved estimating the relative amount of tRNA and amino acid in the preparation based on A260 and 14C measurements, respectively. Aminoacyl-tRNA migrates more slowly through acid gels than deacylated tRNA (Fig. 1). This difference in mobility is lessened when the free amino group is acetylated. Thus, when preparing N-acetyl-aminoacyl-tRNA, an aliquot of aminoacyl-tRNA should be removed for acid gel electrophoresis before the remainder is acetylated.
Figure 1.
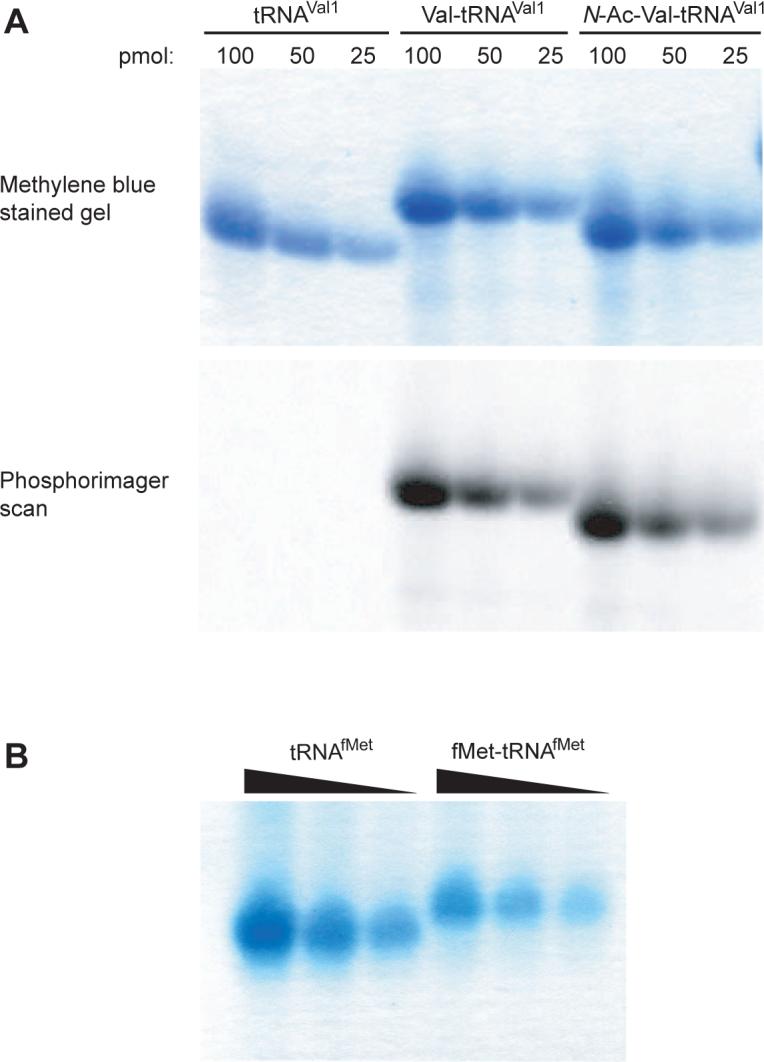
Acid gel electrophoresis resolves aminoacyl-tRNA from deacylated tRNA, allowing the extent of aminoacylation to be determined. (A) Various amounts (as indicated) of tRNAVal, Val-tRNAVal, and N-acetyl-Val-tRNAVal were subjected to acid gel electrophoresis, the gel was stained with methylene blue (top panel), dried, exposed to a phosphorimager screen, and scanned (bottom panel). (B) Various amounts of tRNAfMet and fMet-tRNAfMet were resolved on an acid gel, which was then stained with methylene blue.
3.1 Materials required
electrophoresis rig
power supply
glass plates (∼ 30 cm length by ∼ 20 cm width)
spacers and comb (0.75 mm thick)
40% acrylamide solution (19:1; mono:bis)
3 M NaOAc (pH 5.2)
urea
10% ammonium persulfate (APS)
N,N,N',N'-tetramethylethylenediamine (TEMED)
bromophenol blue
methylene blue
Pyrex dish with dimensions larger than the gel
rotator
3.2 Protocol
Pour a 6.5% polyacrylamide gel containing 100 mM NaOAc (pH 5.2) and 8 M urea. The length of the plates should be about 30 cm and the spacer thickness should be 0.75 mm. To polymerize the gel, add 600 μL 10% APS and 60 μL TEMED per 100 mL of acrylamide solution.
Once polymerized, set up the gel in the cold room. Use 100 mM NaOAc (pH 5.2) as running buffer.
Add loading dye [100 mM NaOAc (pH 5.2), 7 M urea, 0.05% bromophenol blue] to the tRNA samples. Load approximately 40 pmol tRNA per lane. Do not heat samples before loading.
Electrophoresis for 12 hours at 10 Watts.
Remove the spacers and then separate the plates. Carefully transfer the gel into ∼ 500 mL of staining solution (500 mM NaOAc pH 5.2, 0.06% methylene blue) contained in a large Pyrex dish. Place the dish on a rotator set at its lowest speed and allow the gel to stain thoroughly (∼ 30 minutes).
Transfer the staining solution (which can be reused) into a large glass bottle using a funnel. This can be done by holding the gel against the bottom of the dish with one gloved hand while supporting the weight of the dish with the other.
Destain the gel with water. Several changes of water will be necessary for complete destaining. It works well to siphon the water from a corner of the dish.
It is wise to load the gel with some asymmetry, so that the lane orientation is unambiguous. This can be accomplished by loading a dilution series of each sample (Fig. 1), which also serves to compensate for poor estimations of concentrations prior to loading and to better assess the fraction of tRNA charged.
4. N-acetylation of aminoacyl-tRNA
The peptidyl-tRNA analog N-acetyl-aminoacyl-tRNA can be readily made by chemical acetylation of aminoacyl-tRNA using acetic anhydride. This reaction is highly efficient and thus homogeneous preparations of N-acetyl-aminoacyl-tRNA are typically obtained.
4.1 Materials required
aminoacyl-tRNA
3 M NaOAc (pH 5.2)
acetic anhydride (≥ 99%)
ethanol
4.2 Protocol
Dilute aminoacyl-tRNA to 1.6 μM in microfuge tubes containing 250 μL cold 200 mM NaOAc (pH 5.2).
Add 4 μL acetic anhydride to each tube, mix, and incubate on ice for one hour.
Add another 4 μL acetic anhydride, mix, and incubate on ice for another hour.
Raise the NaOAc (pH 5.2) concentration to 300 mM.
Ethanol precipitate.
Wash pellets with 70% ethanol.
Dissolve each pellet in 20 μL 2 mM NaOAc (pH 5.2), pool samples, aliquot, and store at −70° C.
5. Use of thin layer chromatography (TLC) to quantify the extent of N-acetylation
5.1 Materials required
N-acetyl-[14C]-aminoacyl-tRNA
[14C]-amino acid
acetic anhydride
ammonium hydroxide (NH4OH)
silica gel thin-layer chromatography plates (e.g., Analtech silica gel HLF)
butanol
acetic acid
plastic film (e.g., Saran Wrap)
phosphorimager
5.2 Protocol
To prepare markers for the TLC, treat the appropriate [14C]-amino acid with acetic anhydride as described in Protocol 4.2 (steps 1−3). Since this acetylation reaction is less efficient than that of the aminoacyl-tRNA, the resulting sample is expected to contain both the acetylated and unacetylated amino acid.
To a small aliquot of N-acetyl-[14C]-aminoacyl-tRNA (∼ 50 pmol), add NH4OH to 3% and incubate at 55° C for 20 minutes. This step deacylates the tRNA.
Spot 1 μL onto a small silica TLC plate with the appropriate controls (i.e., the [14C]-amino acid and the N-acetylated amino acid prepared as described above). Allow the spots to dry.
Develop the TLC with a mixture of butanol, water, and acetic acid (4:1:1).
Air dry the TLC plate completely. Cover with plastic film and expose to a phosphorimager screen. Care should be taken to prevent contamination of the screen with 14C.
It is worth noting that extent of acetylation of unlabeled aminoacyl-tRNA can be qualitatively assessed by acid gel electrophoresis (Fig. 1A). However, the difference in migration between the aminoacyl-tRNA and N-acetyl-aminoacyl-tRNA is typically too small to allow accurate quantification.
6. Preparation of fMet-tRNAfMet
Translation initiation involves a specific tRNA, the initiator tRNA, which reads the start codon in the ribosomal P site. In bacteria, the initiator tRNA is fMet-tRNAfMet, which has a number of unique features that specify its role in initiation [11].
fMet-tRNAfMet can be generated in a reaction containing methionyl-tRNA synthetase (MetRS) to charge tRNAfMet and methionyl-tRNA formyltransferase (MTF) to formylate Met-tRNAfMet. The electrophoretic mobility of both Met-tRNAfMet and fMet-tRNAfMet is sufficiently different from that of tRNAfMet, allowing the extent of aminoacylation to be assessed after both reactions have occurred (Fig. 1B).
Methionine is susceptible to oxidation by air, which can result in sulfoxide formation [30]. If this poses a problem, methionine oxidation can be reversed enzymatically using MsrA or chemically using a reducing agent [31]. Typically, about 30% of fMet-tRNAfMet is oxidized when prepared as described below (Fig. 2D).
Figure 2.

The extent of acetylation or formylation can be determined using TLC. N-acetyl-[14C]-Tyr-tRNATyr (panel A), N-acetyl-[14C]-Val-tRNAVal (panel B), and N-acetyl-[14C]-Phe-tRNAPhe (panel C) were deacylated by treatment with NH4OH and spotted onto a silica-gel TLC plate (lane 3) along with the corresponding [14C]-amino acid (lane 1) and acetylated [14C]-amino acid (lane 2). The TLC plate was developed with a mixture of butanol, water, and acetic acid (4:1:1), dried, wrapped with plastic film, and exposed to a phosphorimager screen. (D) TLC analysis comparing deacylated formyl-[35S]-Met-tRNAfMet (lane 2) with a partially oxidized sample of [35S]-methionine (lane 1). Assignments of spots are based on separate experiments in which hydrogen peroxide was used to promote oxidation.
6.1 Materials required
N5,N10-methenyltetrahydrofolic acid (To make, dissolve 25 mg folinic acid (Ca2+ salt; available from Sigma) in 2 mL 50 mM β-mercaptoethanol, add 220 μL 1M HCl, and incubate at room temperature for 3 hours. The solution should turn yellow; if a precipitate forms, heat at 50°C to dissolve. Dilute with 1 mL of 100 mM HCl and store in 200 μL aliquots at −20°C [32].)
1M KOH
1M Tris-HCl (pH 7.9)
pH test strips
purified tRNAfMet
methionine (Use of radiolabel is recommended in order to assess the product.)
1 M HEPES-KOH (pH 7.6)
100 mM ATP (pH 7)
100 mM DTT
3 M KCl
1 M MgCl2
S-100 extract from E. coli [28] or purified methionyl-tRNA synthetase (MetRS) and methionyl-tRNA formyltransferase (MTF) Over-expression constructs encoding tagged-versions of these enzymes are available from laboratories that study these enzymes and can also be obtained from the ASKA collection (National Institute of Genetics, Japan).
3 M NaOAc (pH 5.2)
20% SDS
phenol saturated with 300 mM NaOAc (pH 5.2)
CHCl3 and isoamyl alcohol (24:1 mixture)
ethanol
Sephadex G-25 (Amersham Biosciences; To prepare, see Section 2.1 above.)
Disposable Bio-Spins columns (Bio-Rad)
Falcon 6 mL, 12 × 75 mm, disposable test tubes (Becton Dickinson) or other appropriately-sized tubes
6.2 Protocol
To form N10-formyl-tetrahydrofolate, neutralize a 200 μL aliquot of N5,N10-methenyl-tetrahydrofolic acid by adding 10 μL 1M Tris-HCl (pH 7.9) and 20 μL 1M KOH and incubating at room temperature for 15 minutes. The solution should turn clear. Check the pH, which should be ∼ 7.5.
- In a reaction volume of 500 μL, combine the following components:
- tRNAfMet (4000 pmol; ∼ 3 A260 units)
- methionine (100 μM; radiolabel recommended)
- HEPES-KOH (pH 7.6; 100 mM)
- ATP (10 mM)
- DTT (1 mM)
- KCl (10 mM)
- MgCl2 (20 mM)
- N10-formyl-tetrahydrofolate, neutralized in step 1 (300 μM)
- S-100 extract (25 μL) or MetRS and MTF (∼ 1 μM each)
Incubate the reaction in a circulating water bath at 37° C for 20 minutes.
Add 50 μL 3 M NaOAc (pH 5.2) and 14 μL 20% SDS.
Extract with phenol.
Back extract the phenol phase with 300 mM NaOAc (pH 5.2).
Repeat steps 5 and 6.
Extract the aqueous phase twice with a mixture of CHCl3 and isoamyl alcohol (24:1).
Ethanol precipitate.
Wash pellets with 70% ethanol.
Dissolve pellets in 20 μL of 2 mM NaOAc (pH 5.2) and combine.
Pass the fMet-tRNA through spin columns as described in section 2.1.
Combine, aliquot, and store at −70°C.
The extent of aminoacylation and formylation should be assessed by acid gel electrophoresis and TLC as described above (sections 3 and 5). β-mercaptoethanol (50 mM) is often included in the electrophoresis buffer and developing solvent to help prevent oxidation of the methonine. To generate markers for the TLC analysis, hydrogen peroxide (100 mM) can be used to convert methionine and formyl-methionine to their sulfoxide and sulfone forms.
7. Concluding Remarks
In this article, we describe methods to prepare aminoacyl-tRNA, N-acetyl-aminoacyl-tRNA, and fMet-tRNAfMet and to assess their homogeneity. These protocols seem generally applicable, regardless of tRNA species, and thus should be useful for a number of laboratories. Throughout the text, we have tried to emphasize the importance of evaluating the acylated tRNA preparations. The techniques involved are easy and the data unambiguous, allowing the investigator to interpret subsequent experiments with a higher degree of confidence. In our hands, the extent of acylation is generally high (>90%), obviating the need for subsequent purification steps [33].
Footnotes
Publisher's Disclaimer: This is a PDF file of an unedited manuscript that has been accepted for publication. As a service to our customers we are providing this early version of the manuscript. The manuscript will undergo copyediting, typesetting, and review of the resulting proof before it is published in its final citable form. Please note that during the production process errors may be discovered which could affect the content, and all legal disclaimers that apply to the journal pertain.
References
- 1.Munro JB, Altman RB, O'Connor N, Blanchard SC. Mol. Cell. 2007;25:505–17. doi: 10.1016/j.molcel.2007.01.022. [DOI] [PMC free article] [PubMed] [Google Scholar]
- 2.Fahlman RP, Uhlenbeck OC. Biochemistry. 2004;43:7575–83. doi: 10.1021/bi0495836. [DOI] [PubMed] [Google Scholar]
- 3.Moazed D, Noller HF. Nature. 1989;342:142–48. doi: 10.1038/342142a0. [DOI] [PubMed] [Google Scholar]
- 4.Moazed D, Noller HF. Cell. 1989;57:585–97. doi: 10.1016/0092-8674(89)90128-1. [DOI] [PubMed] [Google Scholar]
- 5.Rheinberger HJ, Sternbach H, Nierhaus KH. Proc. Natl. Acad. Sci. USA. 1981;78:5310–4. doi: 10.1073/pnas.78.9.5310. [DOI] [PMC free article] [PubMed] [Google Scholar]
- 6.Lill R, Robertson JM, Wintermeyer W. Biochemistry. 1986;25:3245–55. doi: 10.1021/bi00359a025. [DOI] [PubMed] [Google Scholar]
- 7.Semenkov YP, Rodnina MV, Wintermeyer W. Nat. Struct. Biol. 2000;7:1027–31. doi: 10.1038/80938. [DOI] [PubMed] [Google Scholar]
- 8.Fredrick K, Noller HF. Mol. Cell. 2002;9:1125–31. doi: 10.1016/s1097-2765(02)00523-3. [DOI] [PubMed] [Google Scholar]
- 9.McGarry KG, Walker SE, Wang H, Fredrick K. Mol. Cell. 2005;20:613–22. doi: 10.1016/j.molcel.2005.10.007. [DOI] [PMC free article] [PubMed] [Google Scholar]
- 10.Antoun A, Lovmar M, Ehrenberg M. Mol. Cell. 2006;23:183–93. doi: 10.1016/j.molcel.2006.05.030. [DOI] [PubMed] [Google Scholar]
- 11.Mayer C, Stortchevoi A, Kohrer C, Varshney U, RajBhandary UL. “Cold Spring Harbor Symposia on Quantitative Biology”. LXVI. CSHL Press; Cold Spring Harbor: 2001. pp. 195–206. [DOI] [PubMed] [Google Scholar]
- 12.Pingoud A, Block W, Wittinghofer A, Wolf H, Fischer E. J. Biol. Chem. 1982;257:11261–67. [PubMed] [Google Scholar]
- 13.Louie A, Jurnak F. Biochemistry. 1985;24:6433–39. doi: 10.1021/bi00344a019. [DOI] [PubMed] [Google Scholar]
- 14.Janiak F, Dell VA, Abrahamson JK, Watson BS, MIller DL, Johnson AE. Biochemistry. 1990;29:4268–77. doi: 10.1021/bi00470a002. [DOI] [PubMed] [Google Scholar]
- 15.LaRiviere FJ, Wolfson AD, Uhlenbeck OC. Science. 2001;294:165–68. doi: 10.1126/science.1064242. [DOI] [PubMed] [Google Scholar]
- 16.Grundy FJ, Henkin TM. Cell. 1993;74:475–82. doi: 10.1016/0092-8674(93)80049-k. [DOI] [PubMed] [Google Scholar]
- 17.Grundy FJ, Yousef MR, Henkin TM. J. Mol. Biol. 2005;346:73–81. doi: 10.1016/j.jmb.2004.11.051. [DOI] [PubMed] [Google Scholar]
- 18.Ibba M, Söll D. Genes and Development. 2004;18:731–38. doi: 10.1101/gad.1187404. [DOI] [PubMed] [Google Scholar]
- 19.Hentzen D, Madel P, Garel J. Biochim. Biophys. Acta. 1972;281:228–32. doi: 10.1016/0005-2787(72)90174-8. [DOI] [PubMed] [Google Scholar]
- 20.Bruice TC, Fife TH. J. Am. Chem. Soc. 1962;84:1973–79. [Google Scholar]
- 21.Schuber F, Pinck M. Biochimie. 1974;56:383–90. doi: 10.1016/s0300-9084(74)80146-x. [DOI] [PubMed] [Google Scholar]
- 22.Strickland JE, Jacobson KB. Biochemistry. 1972;11:2321–23. doi: 10.1021/bi00762a017. [DOI] [PubMed] [Google Scholar]
- 23.Kelmers AD, Weeren HO, Weiss JF, Pearson PL, Stulberg MP, Novelli GD. Methods Enzymol. 1971;20:9–34. [Google Scholar]
- 24.Gillam IC, Tener GM. Methods Enzymol. 1971;20:55–70. [Google Scholar]
- 25.Holmes WM, Hurd RE, Reid BR, Rimerman RA, Hatfield GW. Proc. Natl. Acad. Sci. USA. 1975;72:1068–71. doi: 10.1073/pnas.72.3.1068. [DOI] [PMC free article] [PubMed] [Google Scholar]
- 26.Ribeiro S, Nock S, Sprinzl M. Anal. Biochem. 1995;228:330–35. doi: 10.1006/abio.1995.1359. [DOI] [PubMed] [Google Scholar]
- 27.Schröder JM, Harder J. Cell. Mol. Life Sci. 2006;63:469–86. doi: 10.1007/s00018-005-5364-0. [DOI] [PMC free article] [PubMed] [Google Scholar]
- 28.Traub P, Mizushima S, Lowry CV, Nomura M. Methods Enzymol. 1971;22:391–407. [Google Scholar]
- 29.Varshney U, Lee C, RajBhandary UL. J. Biol. Chem. 1991;266:24712–18. [PubMed] [Google Scholar]
- 30.Creighton TE. Proteins. W. H. Freeman and Company; New York: 1993. [Google Scholar]
- 31.Boschi-Muller S, Olry A, Antoine M, Branlant G. Biochim Biophys Acta. 2005;1703:231–38. doi: 10.1016/j.bbapap.2004.09.016. [DOI] [PubMed] [Google Scholar]
- 32.Dubnoff JS, Maitra U. Methods Enzymol. 1971;20:248–61. [Google Scholar]
- 33.Rodnina MV, Semenkov YP, Wintermeyer W. Anal. Biochem. 1994;219:380–1. doi: 10.1006/abio.1994.1282. [DOI] [PubMed] [Google Scholar]