Abstract
Study Objectives:
To explore the role of autonomic nervous system in initiation of sleep-wake transitions.
Design:
Changes in cardiovascular variability during sleep-wake transitions of adult male Wistar-Kyoto rats on their normal daytime sleep were analyzed.
Interventions:
A 6-h daytime sleep-wakefulness recording session was performed.
Measurements and Results:
Electroencephalogram and electromyogram (EMG) signals were subjected to continuous power spectral analysis, from which mean power frequency of the electroencephalogram (MPF) and power of the EMG were quantified. Active waking (AW), quiet sleep (QS), and paradoxical sleep (PS) were defined every 8 s according to corresponding MPF and EMG power. Continuous power spectral analysis of R-R intervals was performed to quantify its high-frequency power (HF, 0.6–2.4 Hz), low-frequency power (0.06–0.6 Hz) to HF ratio (LF/HF). MPF exhibited two phases of change during AW-QS and QS-AW transitions: a slowly changing first phase followed by a rapidly changing second phase. HF increased linearly with the decrease of MPF during the first phase of AW-QS transition whereas LF/HF increased linearly with the increase of MPF during the first phase of QS-AW transition. However, the LF/HF was not correlated with the HF. The MPF and HF exhibited only a rapidly changing phase during QS-PS transition. The LF/HF declined transiently during the QS-PS transition, followed by a sustained increase in PS.
Conclusions:
The parasympathetic activity before falling asleep and the sympathetic activity before waking up change coincidentally with EEG frequency, and may respectively contain the messages of sleeping and waking drives.
Citation:
Kuo TBJ; Shaw FZ; Lai CJ; Yang CCH. Asymmetry in sympathetic and vagal activities during sleep-wake transitions. SLEEP 2008;31(3):311-320.
Keywords: Heart rate variability, arterial pressure variability, sleep-to-wake transition, wake-to-sleep transition, electroencephalogram
IT IS WELL KNOWN THAT SLEEP-WAKE STATES ARE ASSOCIATED WITH DRAMATIC CHANGES IN AUTONOMIC FUNCTIONS.1,2 QUIET SLEEP (QS), ALSO known as non-rapid eye movement sleep,3 is accompanied with a decrease of sympathetic activity but an increase of parasympathetic activity as compared to active waking (AW). These changes are partially reversed during paradoxical sleep (PS), which is equivalent to rapid eye movement sleep.3 Even during QS, the autonomic nervous functions may alter along with the depth of sleep.4–7 The sleep-wake regulating systems have been proposed to be located in various nuclei of hypothalamus and brain stem.3,8–10 These sleep-wake related nuclei are largely overlapped with the autonomic related nuclei.11,12 The interaction between the sleep-wake states and autonomic functions warrants further exploration.
In freely moving humans or animals, the application of heart rate variability have recently gained popularity in quantifying autonomic functions noninvasively. Heart rate variability has been categorized into high-frequency (HF), low-frequency (LF), and very-low frequency powers according to its frequency.13–15 HF is considered to represent vagal control of heart rate.13,16 The ratio LF/HF is considered by some investigators to mirror sympathovagal balance or to reflect sympathetic modulations.13,15 With the application of the heart rate variability technique, growing evidence indicates that the autonomic nervous system may not only broadcast the sleep-wake information to the target organs, but may also play an active role in sleep-wake transitions. For example, it was observed that the study subjects who had higher vagal activity during sleep stage 0 reached slow wave sleep (stage 4) within 90 min, while those who had lower vagal activity did not within the same period.17 It was also shown that changes in heart rate variability led changes in electroencephalogram (EEG) during sleep time.18 Various study groups had independently demonstrated that the sympathetic index of heart rate variability was inversely related to sleep depth.4–7 The mechanisms underlying these findings, however, were not clear.
The autonomic nuclei in the brain stem are anatomically close to the hindbrain sleep-wake regulating system.10 More specifically, the parasympathetic center (e.g. dorsal motor nucleus and nucleus ambiguous) is directly regulated by the solitary tract nucleus, which is the classical hindbrain sleep center.8,10 On the other hand, the sympathetic center (e.g., rostral ventrolateral medulla) is highly modulated by nearby medullary reticular formation, which is the well-known hindbrain wake center.3 A detailed examination of the time sequence of the autonomic nervous functions and sleep-wake transitions may provide integrative information about the concealed roles of the hindbrain sleep-wake regulating system8 in initiation of sleep and wakefulness in intact subjects.
MATERIALS AND METHODS
Animal Preparation
Experiments were carried out on adult male Wistar-Kyoto rats. They were obtained from the Animal Center of Tzu Chi University of Taiwan with the guidelines established by the Position of the American Heart Association on Research Animal Use. They were raised in a sound-attenuated room with a 12:12 light-dark cycle (06:00–18:00 lights on) and at appropriate temperature (22 ± 2°C) and humidity (40%–70%) control. These experimental procedures have been approved by The Institutional Animal Care and Use Committee of Tzu Chi University.
The detailed surgical procedure for the implantation of the electrophysiologic and blood pressure sensors has been described previously.19–22 Electrodes for the parietal EEG and nuchal electromyogram (EMG) were implanted at appropriate positions when the rats were 8 to 10 weeks old. Under pentobarbital anesthesia (50 mg/kg, ip), each rat was placed in a standard stereotaxic apparatus. The dorsal surface of the skull was exposed and cleaned. Two stainless steel screws were driven bilaterally into the skull overlaying the parietal (2.0 mm posterior to and 2.0 mm lateral to the bregma) regions of the cortex. A reference electrode was implanted 2 mm caudal to the lambda. Care was taken to prevent electrodes from penetrating the underlying dura. Two 7-strand stainless steel microwires were bilaterally inserted into the dorsal neck muscles to record EMG. In 85 rats, electrocardiogram (ECG) was recorded via a pair of microwires placed under the skin of the dorsal part of the body (one was between the cervical and thoracic levels, the other at the lumbar level). In another 28 rats, a telemetry transmitter (TA11PA-C40, Data Sciences, St. Paul, MN, USA) was implanted to record arterial pressure signals. The tip of the arterial catheter was inserted into the abdominal aorta.
PROTOCOL
After surgery, the rats were given antibiotics (chlortetracycline) and housed individually in cages for one week of recovery. To allow the rats to become habituated to the experimental apparatus, each animal was placed in the recording environment at least two times (1 hour per day) before testing. On the day of the recording, a 30-min period was allowed for the rat to become familiar with the chamber. Then the biological signals and behaviors were synchronously recorded for 6 h (10:30–16:30) in a sound-attenuated room.
Measurements
EEG, EMG, and ECG signals were amplified 10,000-fold, but with different selections for filter bandwidths. The EEG was filtered at 0.3–70 Hz, the EMG at 100–500 Hz, and the ECG at 10–100 Hz.14,20,21 These bioelectrical and arterial pressure signals were relayed to a 12-bit analog-digital converter (PCL-818L, Advantech, Taiwan) connected to an IBM PC-compatible computer. EEG, EMG, ECG, or arterial pressure signals were synchronously digitized but at different sampling rates (256, 1,024, 1,024, and 1,024 Hz, respectively). The behaviors were recorded with a digital video recorder which was connected to another computer. The acquired data were analyzed on-line but were simultaneously stored on optic disks for subsequent off-line verification.
Sleep Analysis
Sleep analysis was performed according to a recently developed and semi-automatic computer procedure which has been described in detail.20–22 The procedure discriminates the consciousness states into AW, QS, and PS, and the scoring was confirmed by an experienced rater with the assistance of the video recordings. Briefly, continuous power spectral analysis was applied to the EEG and EMG signals, from which the mean power frequency of the EEG (MPF) and the power magnitude of the EMG were quantified. EMG power between 200 and 500 Hz was quantified by the method of integration, i.e., calculation of the area of the power spectral density between 2 specified frequencies. MPF was calculated using the following equation:
where f is any given frequency, fo is the lower cutoff frequency, fc is the upper cutoff frequency and PSD(f) is the power spectral density of a given frequency. In this study, the fo was 1.5 Hz whereas the fc was 32 Hz. Most of the previous researches generally used slow wave activity or delta power of the EEG to explain the sleep depth or sleep pressure. However, our focus was not only on the levels of sleep but also those of wakefulness. Since the slow wave activity is not obvious in the waking state, we integrated the information of all EEG bandwidth, including delta, theta, alpha, and beta bands, to calculate the MPF in order to express the cerebral cortical activity in both sleep and waking states. We also calculated the delta power (0.5–4 Hz) to make a comparison between it and MPF.
The duration of the time segment was 16 sec and successive time segments were 50% overlapped. Thus the time resolution of the sleep scoring was 8 sec. For each time segment, the sleep-wake stage was defined as AW if the corresponding MPF was greater than a predefined MPF threshold (TMPF) and the EMG power was greater than a predefined EMG power threshold (TEMG); as QS if the corresponding MPF was less than the TMPF and the EMG power was less than the TEMG; and as PS if the corresponding MPF was greater than the TMPF and the EMG power was less than the TEMG. If the MPF was less than TMPF and the EMG power was greater than TEMG, the stage would not be determined and corresponding cardiovascular signals would not be analyzed. TMPF and TEMG of each animal were defined manually by the rater and were constant for the whole recording period. The TMPF and TEMG were 7.23 ± 0.44 Hz and 6.28 ± 1.05 ln(μV2) (mean ± SD), respectively, for all rats in this study.
Cardiovascular Variability Analysis
Arterial pressure variability and heart rate variability were analyzed in the 28 and 85 rats, respectively. The detailed analytic procedures of arterial pressure variability and heart rate variability have also been described in detail.22 Briefly, the mean arterial pressure was obtained by the integration of the arterial pulse contour. The R-R interval (RR) was estimated continuously from the digitized ECG signals. The stationary mean arterial pressure and RR were resampled and linearly interpolated at 64 Hz to provide continuity in the time domain, and then were truncated into 16-sec time segments with 50% (8-sec) overlap. These sequences were analyzed with the fast Fourier transform after application of the Hamming window. The low-frequency power (BLF, 0.06–0.6 Hz) of mean arterial pressure spectrogram, and the HF (0.6–2.4 Hz) and the LF (0.06–0.6 Hz) to HF ratio (LF/HF) of the RR spectrogram were quantified. BLF, LF/HF, and HF provided markers of vascular sympathetic, cardiac sympathetic, and cardiac vagal modulations, respectively.11,13,16,22,23
Statistical Analysis
BLF, LF/HF, and HF were logarithmically transformed to correct the skewness of the distribution.24 Data were presented as means ± SD or means ± 95% confidence interval as indicated. If continuous changes of one parameter would be analyzed, the first data point would be used as reference point. If 95% confidence interval of the change did not cross zero, the change would be considered significant. A set of analyses was performed to test whether the magnitude of an autonomic index was related to following sleep-wake transition. For example, if we wanted to test whether a higher HF during AW was related to a subsequent AW-QS transition in the following 4 min, the following procedure would be done. For each rat, we calculated the average value of its HF from the 6-h data, then we randomly sampled 15 time points during AW. The sampled time points could be classified into 2 groups according to whether its HF was larger than the average or not. Each of the groups could be further classified into 2 groups according to whether the subject was falling into QS within the following 4 min or not. Finally, total 85 rats were analyzed and 1275 (85*15) data points were accumulated. A Chi-square test was performed to test the relationship among the four groups. The same strategy was carried out to test whether a sympathetic or parasympathetic index was related to forthcoming AW-QS or QS-AW transition. For all tests, statistical significance was assumed for P < 0.05.
RESULTS
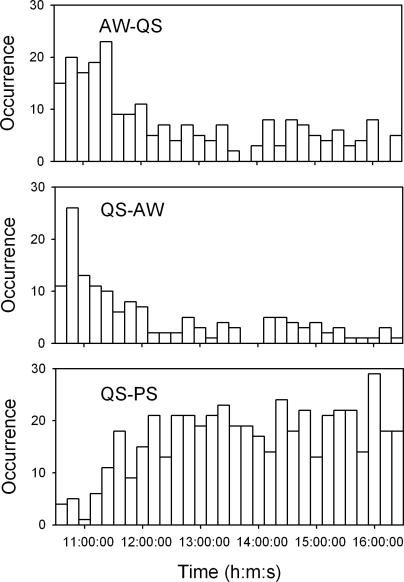
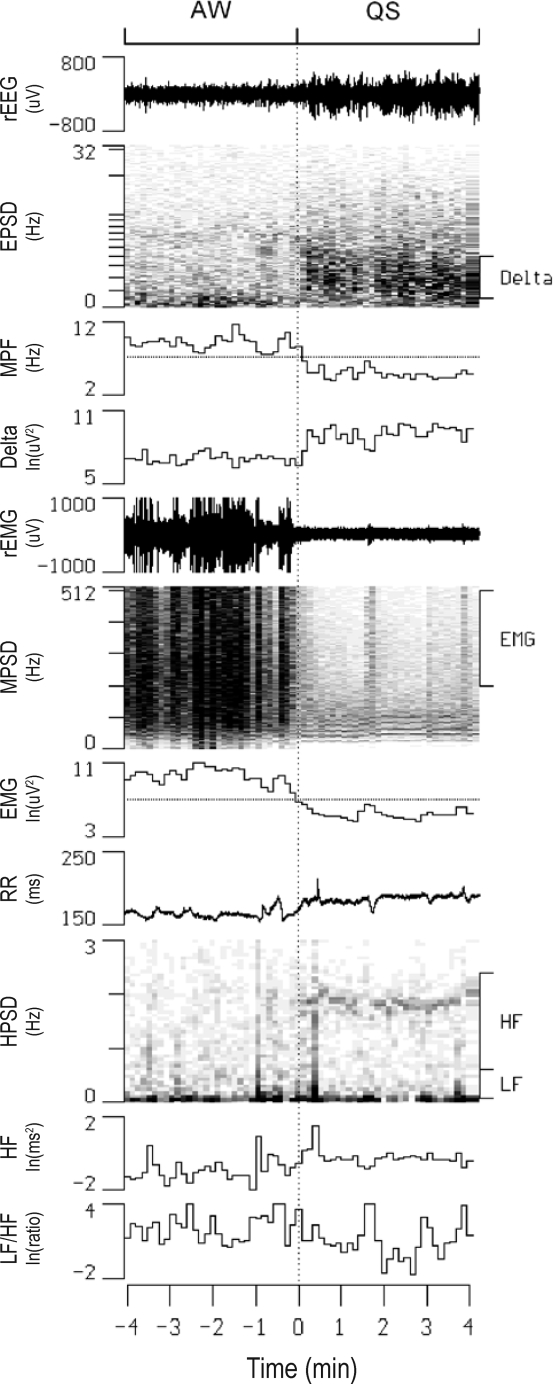
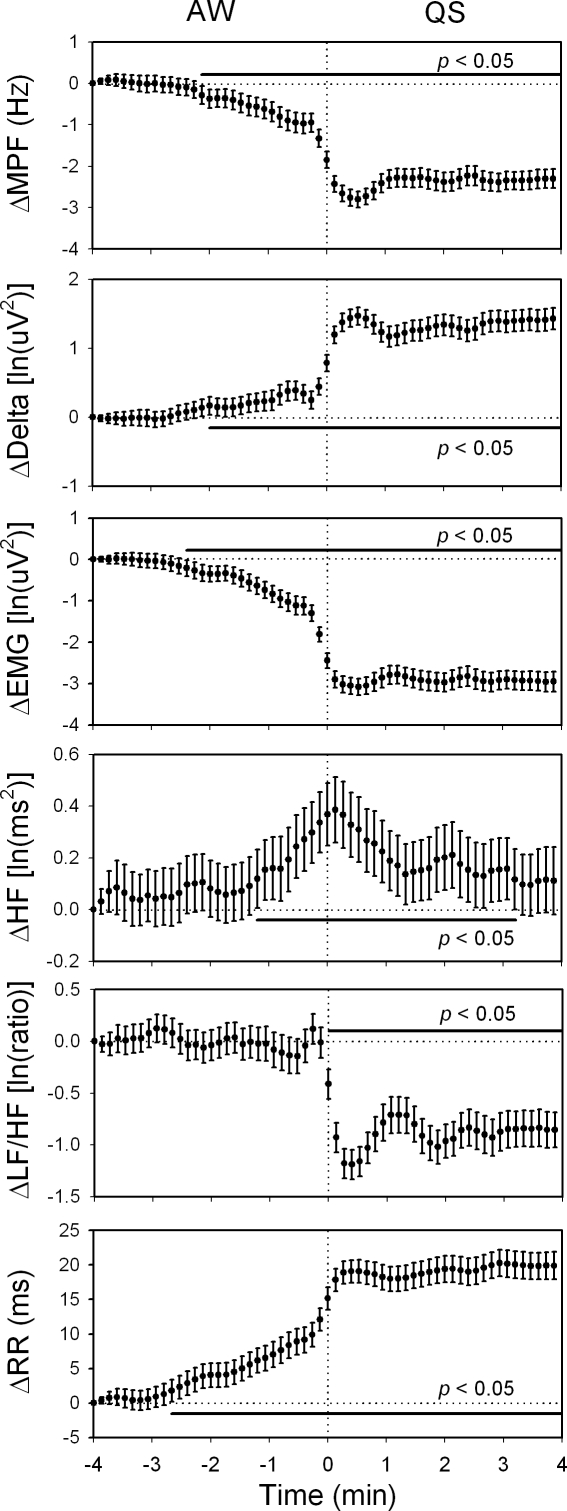
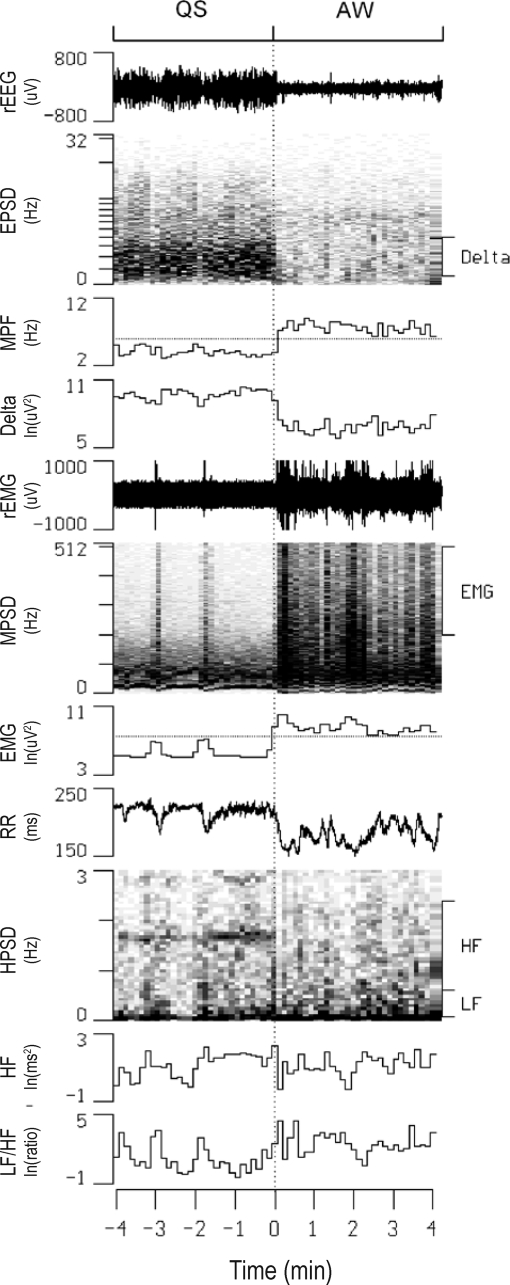
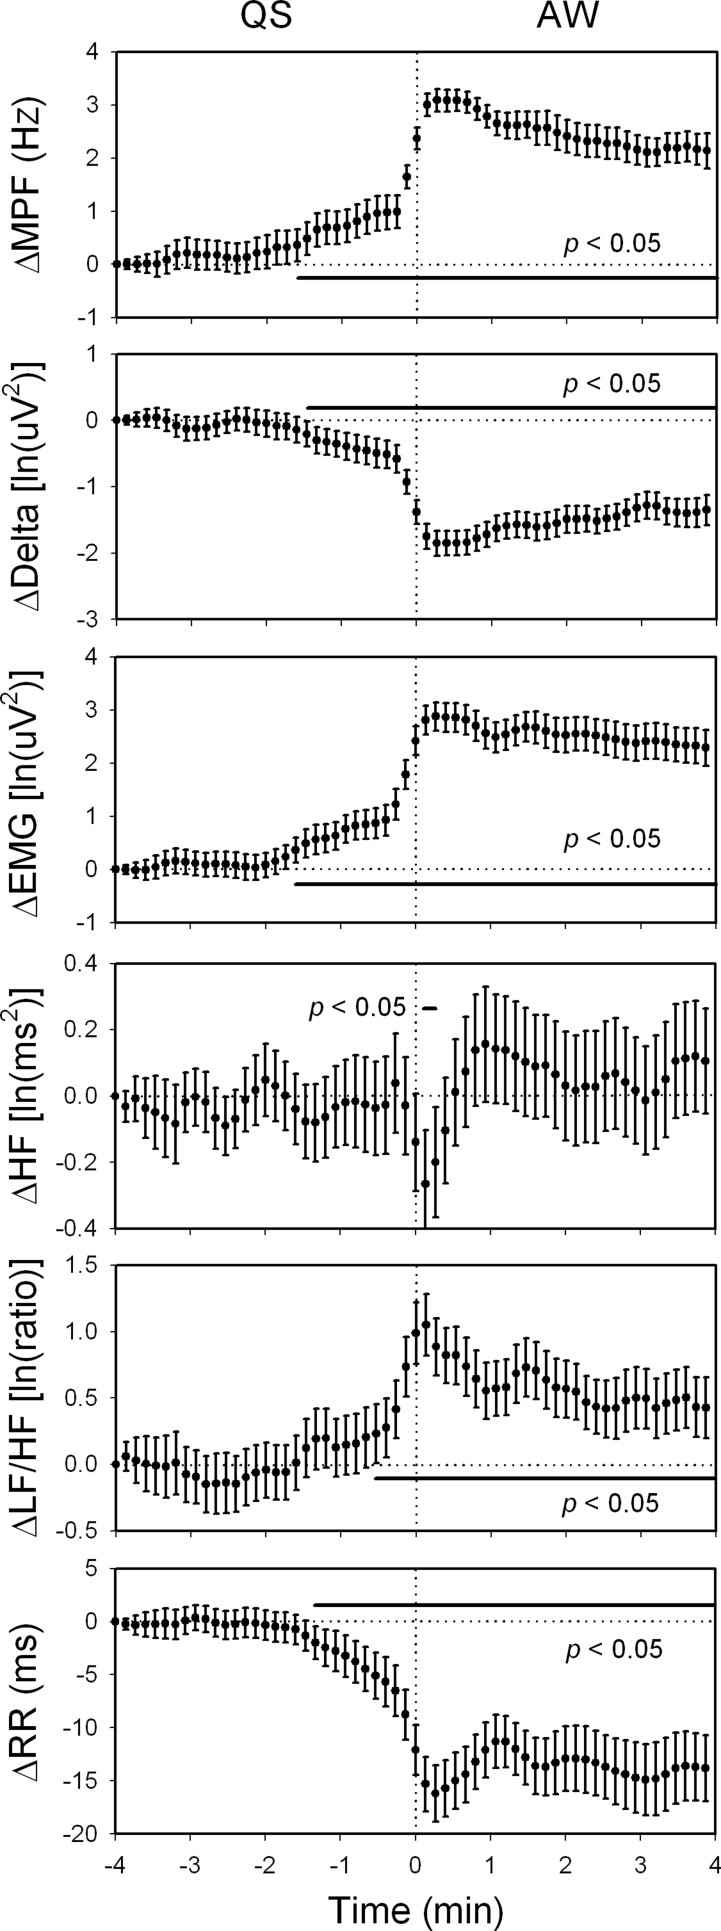
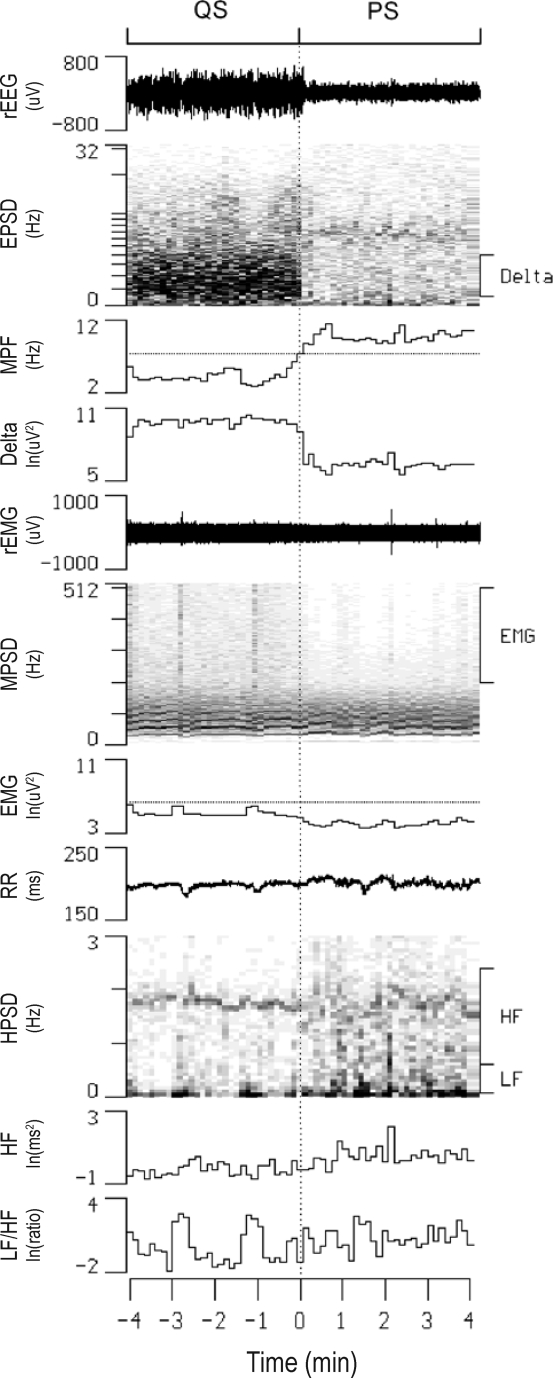
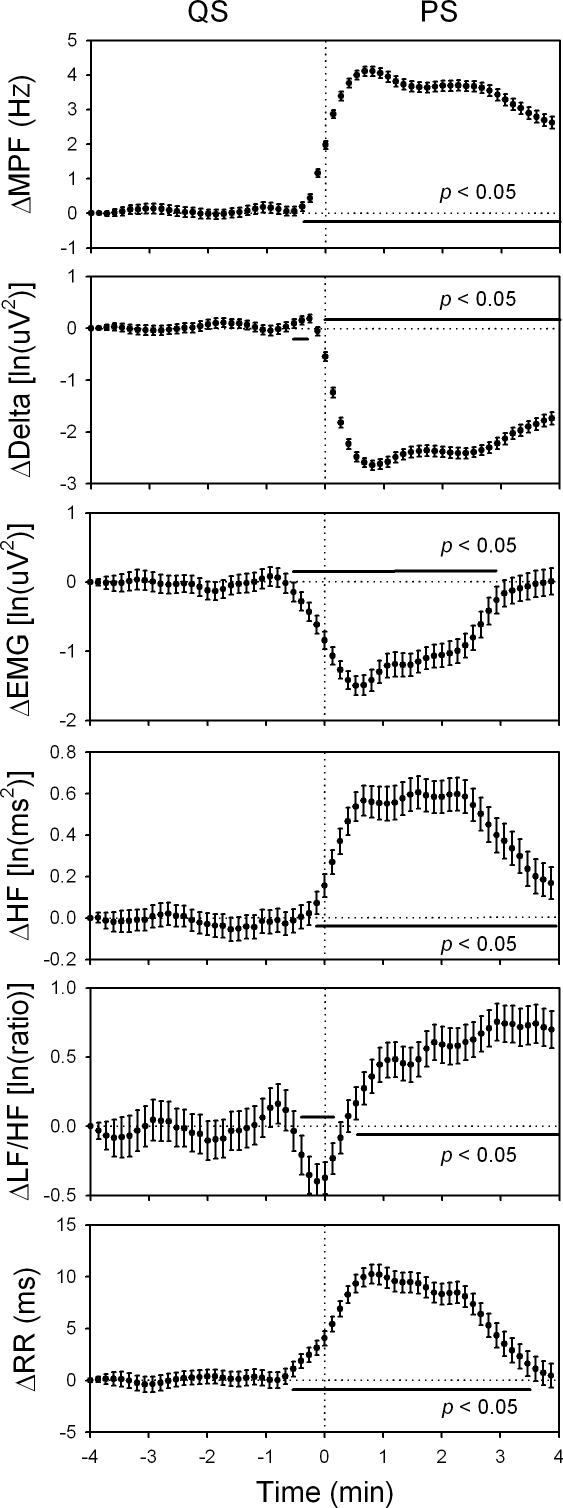
For the heart rate viability analysis, the sleep architecture as well as mean MPF, delta power, EMG, HF, LF/HF, and RR during AW, QS, and PS were described in Table 1. The timings of all AW-QS, QS-AW, and QS-PS transitions were described in Figure 1. Firstly, we analyzed continuous change of the autonomic indices across wake-to-sleep transition. We selected the AW-QS transition21 accompanied with at least 4 min of continuous AW followed by at least 4 min of continuous QS (Figure 2). With 228 accumulations from the 85 rats, we found that the HF rose while the LF/HF declined upon the AW-QS transition (Figure 3). Similar observations have been reported in many previous studies.1,7,18,20 What noteworthy is that the rise of the HF started 1 min prior to the transition, while the decline of the LF/HF did not happen until the transition finished. With similar analytical strategy, we found as interesting changes of the autonomic indices across sleep-to-wake transition (Figure 4). With 147 accumulations from these same rats, the pooled data showed that the rise of LF/HF started 0.5 min prior to the QS-AW transition, while the decline of HF did not happen until the transition finished (Figure 5). With 498 accumulations from these same rats, however, we found that the HF increased almost synchronously with the increase of MPF during the QS-PS transition (Figures 6 and 7). The LF/HF had a more complicated pattern during the QS-PS transition: it declined transiently since 0.5 min before the transition, followed by a sustained increase after the completion of the transition.
Table 1.
Description Data for Heart Rate Variability Analysis
| State | Accumulated Time | Mean Duration | MPF | Delta | EMG | HF | LF/HF | RR |
|---|---|---|---|---|---|---|---|---|
| (min) | (min) | (Hz) | [ln(uV2)] | [ln(uV2)] | [ln(ms2)] | [ln(ratio)] | (ms) | |
| AW | 68.5 ± 26.6 | 7.59 ± 2.87 | 8.82 ± 0.69 | 6.73 ± 1.07 | 7.93 ± 0.98 | 0.66 ± 0.46 | 2.13 ± 0.31 | 172 ± 11 |
| QS | 197.7 ± 17.6 | 7.56 ± 1.31 | 5.47 ± 0.42 | 8.71 ± 1.08 | 4.45 ± 1.01 | 0.85 ± 0.64 | 0.37 ± 0.32 | 192 ± 13 |
| PS | 91.0 ± 19.3 | 4.22 ± 0.73 | 9.14 ± 0.56 | 6.92 ± 1.04 | 4.26 ± 1.08 | 1.20 ± 0.64 | 1.04 ± 0.32 | 196 ± 12 |
Values are presented as means ± SD; n = 85. MPF, mean power frequency of electroencephalogram; Delta, delta power of electroencephalogram; EMG, power of electromyogram; HF, high-frequency power of heart rate variability; LF/HF, low-frequency power of heart rate variability to HF ratio; RR, mean heart beat interval estimated from successive R points of electrocardiogram; AW, active waking; QS, quiet sleep; PS, paradoxical sleep. ln, natural logarithm.
Figure 1.
Histograms describing the timings of active waking-quiet sleep (AW-QS), QS-AW, and quiet sleep-paradoxical sleep (QS-PS) transitions over the recording period since 10:30 to 16:30 of the 85 rats for heart rate variability analysis. Bin width of the histograms is 12 min.
Figure 2.
Continuous display of raw electroencephalogram (rEEG), raw electromyogram (rEMG), and R-R intervals (RR) along with their power spectral densities (EPSD, MPSD, and HPSD, respectively) in one rat before and after an active waking (AW)-quiet sleep (QS) transition. Also shown are temporal alterations in the mean power frequency of EPSD (MPF), the delta power of EPSD (Delta), the high-frequency power of MPSD (EMG), high-frequency power (HF) and low-frequency power to HF ratio (LF/HF) of HPSD. The thresholds of MPF and EMG for sleep scoring are denoted as dotted lines in the respective channels. ln, natural logarithm.
Figure 3.
The changes in the mean power frequency of electroencephalogram (ΔMPF), delta power (ΔDelta), electromyogram (ΔEMG), high-frequency power of heart rate variability (ΔHF), low-frequency power to HF ratio of heart rate variability (ΔLF/HF), R-R interval (ΔRR) within 4 min before and after active waking-quiet sleep (AW-QS) transition. Data of the fourth min before each transition were used as reference points. 228 sequences of data with time resolution of 8 sec were analyzed and were expressed as mean ± 95% confidence interval. The HF rose significantly since 1 min before the transition, while the LF/HF did not decline until the completion of the transition. Moreover, MPF, Delta, EMG, and RR all changed significantly since 2 min before the transition. ln, natural logarithm.
Figure 4.
Continuous display of raw electroencephalogram (rEEG), raw electromyogram (rEMG), and R-R intervals (RR) along with their power spectral densities (EPSD, MPSD, and HPSD, respectively) in one rat before and after a quiet sleep (QS) - active waking (AW) transition. Also shown are temporal alterations in the mean power frequency of EPSD (MPF), the delta power of EPSD (Delta), the high-frequency power of MPSD (EMG), high-frequency power (HF) and low-frequency power to HF ratio (LF/HF) of HPSD. The thresholds of MPF and EMG for sleep scoring are denoted as dotted lines in the respective channels. ln, natural logarithm.
Figure 5.
The changes in the mean power frequency of electroencephalogram (ΔMPF), delta power (ΔDelta), electromyogram (ΔEMG), high-frequency power of heart rate variability (ΔHF), low-frequency power to HF ratio of heart rate variability (ΔLF/HF), R-R interval (ΔRR) within 4 min before and after quiet sleep-active waking (QS-AW) transition. Data of the fourth min before each transition were used as reference points. 147 sequences of data with time resolution of 8 sec were analyzed and were expressed as mean ± 95% confidence interval. The LF/HF rose significantly since 0.5 min before the transition, while the HF did not decline until the completion of the transition. Moreover, MPF, Delta, EMG, and RR all changed significantly since 1.5 min before the transition. ln, natural logarithm.
Figure 6.
Continuous display of raw electroencephalogram (rEEG), raw electromyogram (rEMG), and R-R intervals (RR) along with their power spectral densities (EPSD, MPSD, and HPSD, respectively) in one rat before and after a quiet sleep (QS) – paradoxical sleep (PS) transition. Also shown are temporal alterations in the mean power frequency of EPSD (MPF), the delta power of EPSD (Delta), the high-frequency power of MPSD (EMG), high-frequency power (HF) and low-frequency power to HF ratio (LF/HF) of HPSD. The thresholds of MPF and EMG for sleep scoring are denoted as dotted lines in the respective channels. ln, natural logarithm.
Figure 7.
The changes in the mean power frequency of electroencephalogram (ΔMPF), delta power (ΔDelta), electromyogram (ΔEMG), high-frequency power of heart rate variability (ΔHF), low-frequency power to HF ratio of heart rate variability (ΔLF/HF), R-R interval (ΔRR) within 4 min before and after quiet sleep-paradoxical (QS-PS) transition. Data of the fourth min before each transition were used as reference points. 498 sequences of data with time resolution of 8 sec were analyzed and were expressed as mean ± 95% confidence interval. The LF/HF declined transiently since 0.5 min before the transition, followed by a sustained increase after the completion of the transition. The HF rose around the onset of the transition. Moreover, MPF, Delta, EMG, and RR all changed significantly since 0.5 min before the transition. ln, natural logarithm.
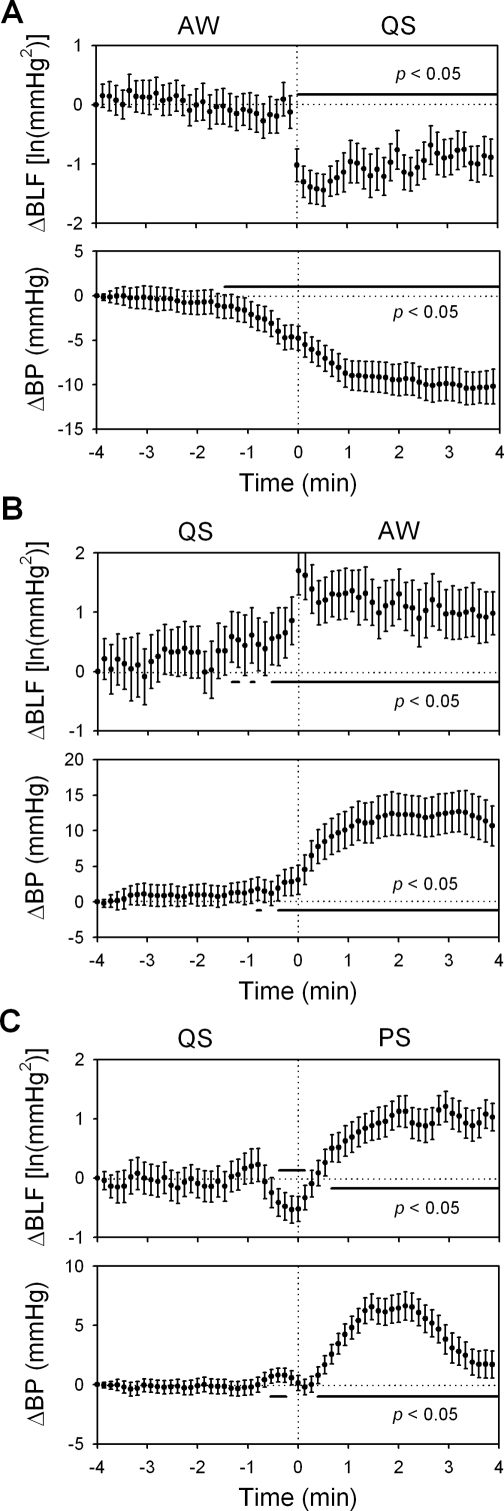
For the arterial pressure variability analysis, the sleep architecture as well as mean MPF, delta power, EMG, BLF, and BP during AW, QS, and PS were described in Table 2. It was generally agreed that BLF may reflect the sympathetic vasomotor activity.11,15,23 With the similar analytic protocol as heart rate variability, we found that the BLF had a very similar pattern with the LF/HF across the sleep-wake transitions (Figure 8). During the AW-QS transition, the BLF did not decline until the transition finished. During the QS-AW transition, however, it rose significantly since 0.5 min before the transition. During the QS-PS transition, the BLF declined transiently since 0.5 min before the transition, followed by a sustained increase after the completion of the transition.
Table 2.
Description Data for Arterial Pressure Variability Analysis
| State | Accumulated Time | Mean Duration | MPF | Delta | EMG | BLF | BP |
|---|---|---|---|---|---|---|---|
| (min) | (min) | (Hz) | [ln(uV2)] | [ln(uV2)] | [ln(mmHg2)] | (mmHg) | |
| AW | 66.9 ± 22.5 | 7.55 ± 2.87 | 9.15 ± 0.44 | 7.44 ± 0.33 | 9.29 ± 0.50 | 2.19 ± 0.52 | 101 ± 23 |
| QS | 198.1 ± 16.6 | 7.98 ± 2.56 | 5.83 ± 0.31 | 9.51 ± 0.62 | 5.28 ± 0.60 | 0.11 ± 0.45 | 93 ± 23 |
| PS | 89.8 ± 25.9 | 4.33 ± 0.75 | 9.46 ± 0.52 | 7.75 ± 0.45 | 4.99 ± 0.64 | 0.85 ± 0.38 | 96 ± 22 |
Values are presented as means ± SD; n = 28. MPF, mean power frequency of electroencephalogram; Delta, delta power of electroencephalogram; EMG, power of electromyogram; BLF, low-frequency power of arterial pressure variability; BP, arterial blood pressure; AW, active waking; QS, quiet sleep; PS, paradoxical sleep. ln, natural logarithm.
Figure 8.
The changes in the arterial blood pressure (ΔBP) and its low-frequency variability (ΔBLF) within 4 min before and after active waking-quiet sleep (AW-QS, A), QS-AW (B), and quiet sleep-paradoxical sleep (QS-PS, C) transitions. Data of the fourth min before each transition were used as reference points. 91 (A), 48 (B), and 186 (C) sequences of data with time resolution of 8 sec were analyzed and were expressed as mean ± 95% confidence interval. During the AW-QS transition, the BLF did not decline until the transition finished. During the QS-AW transition, however, it rose significantly since 0.5 min before the transition. During the QS-PS transition, the BLF declined transiently since 0.5 min before the transition, followed by a sustained increase after the completion of the transition. ln, natural logarithm.
Could we predict the occurrence of sleep-wake transitions with the cardiovascular variability in rats? Chi-square test reported a significant relationship (P < 0.05) between whether HF was larger than its average and whether one was entering QS from AW within the following 4 min. In other words, the rise of the parasympathetic activity could predict the sleep of a waking rat. The Chi-square test, however, did not report a significant relationship (P > 0.05) between whether HF was lower than its average and whether one was entering AW from QS within the following 4 min. Similar methods were applied to test the predictability of the LF/HF or the BLF for the happenings of AW-QS or QS-AW transition. Chi-square test reported a significant relationship (P < 0.05) between whether the LF/HF (or the BLF) was higher than its average and whether one was entering AW from QS within the following 4 min, indicating the rise of the sympathetic activity could predict the waking of a sleeping rat. The Chi-square test, however, did not report a significant relationship (P > 0.05) between whether the LF/HF (or the BLF) was lower than its average and whether one was entering QS from AW within the following 4 min.
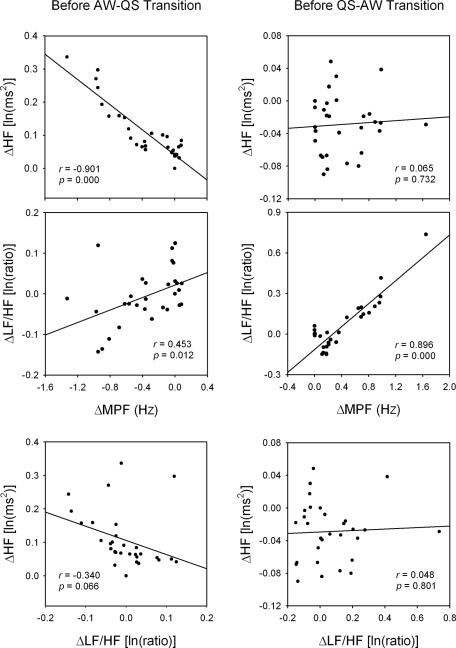
Unexpectedly, we noted that the change of MPF across the AW-QS transition exhibited 2 phases, a slowly changing first phase followed by a fast changing second phase (Figure 3, ΔMPF). Similar 2-phase change was also noted across the QS-AW transition (Figure 5, ΔMPF). The 2-phase change can be compared to the QS-PS transition (Figure 7, ΔMPF), which exhibited only one phase. The difference in changing rate implies a difference in underlying mechanism. Since the autonomic indices (HF or LF/HF) also had significant changes upon the time of the first phase (Figures 3 and 5), we were interested whether there was a relationship between the autonomic indices and MPF. We used each of the 30 average data points before the transition point of the 2 figures as a single data point for regression analysis (Figure 9). Significant linear relationships were found between the ΔHF and the ΔMPF in the first phase of AW-QS transition and between the ΔLF/HF and the ΔMPF in the first phase of QS-AW transition. The relationship between the ΔLF/HF and the ΔHF was poor in the first phase of either AW-QS or QS-AW transition.
Figure 9.
Linear regression analyses between each of the changes in high-frequency power of heart rate variability (ΔHF), low-frequency power-to-HF ratio of heart rate variability (ΔLF/HF) and mean power frequency of electroencephalogram (ΔMPF) before active waking-quiet sleep (AW-QS) and QS-AW transitions. Data were obtained from Figures 3 and 5, respectively. Good relationships were detected between MPF and HF before AW-QS transition, and between MPF and LF/HF before QS-AW transition. The relationship between HF and LF/HF was poor before both AW-QS and QS-AW transitions. ln, natural logarithm.
DISCUSSION
Our data lead to a simple and symmetrical concept, that is the rise in the parasympathetic activity before falling asleep is linearly related to the fall of EEG frequency. And the rise in the sympathetic activity before waking up is linearly related to the rise of EEG frequency. By contrast, the sympathetic activity is not related with the occurrence of sleep while the parasympathetic activity is not related with the occurrence of wakefulness.
It is not surprising that a change in EEG frequency or EMG power led the occurrence of state transition since the sleep-wake states were defined by them. However, why a change in autonomic function also led the state transition deserves thorough considerations. When we inspected the data of the first phase of AW-QS and QS-AW transitions, several characteristics were noted: 1) Significant linear relationships existed between the MPF and one autonomic index, indicating that the underlying system was, at least partially, linear. 2) The parasympathetic and sympathetic indices were correlated alternatively with the MPF during AW-QS and QS-AW transitions, indicating the parasympathetic system was functionally linked to cerebral cortex before falling asleep, and the sympathetic system was functionally linked to cerebral cortex before waking up. 3) The parasympathetic and sympathetic indices were poorly correlated with each other, indicating the parasympathetic and sympathetic systems were independent to each other in the role of sleep-wake transitions. 4) All the above-mentioned linear phenomena were observed during the first phase of AW-QS and QS-AW transitions. When the transitions entered the second phase, an all-or-none change occurred in most parameters.
In the long history of sleep research, there have been various sleep-wake promoting nuclei or centers hypothesized in the brain.3,8,9 These nuclei may be classified into 2 separate sleep-wake regulating systems: forebrain and hindbrain systems.10,25 The interaction of the 2 systems would be interesting, but was not easy to explore in intact subjects. From the observation of the MPF change during the sleep-wake transitions, we supposed that the 2 phases of change were related to different regulating systems. With the assistance of cardiovascular variability analysis, we found the first phase was related to the autonomic functions. It is well known that brainstem contains specific nuclei (or center) regulating parasympathetic and sympathetic nervous functions. The former is often referred to nucleus ambiguus, dorsal motor nucleus of vagus, and solitary tract nucleus.12 The later is often referred to rostral ventrolateral medulla.11 Intriguingly, these parasympathetic related nuclei are also overlapped with the hindbrain sleep center, and the sympathetic nucleus is overlapped with the hindbrain wake center. If the parasympathetic and sympathetic activities may respectively reflect the activities of the hindbrain sleep and wake centers, the sleep/wake propensities of EEG during the first phase of sleep-wake transitions may be linked to the hindbrain sleep/wake centers. Previous studies has reported that direct current application to the solitary tract nucleus resulted in EEG synchronization or drowsiness.3 On the other hand, stimulation of the brain-stem reticular formation produced cortical desynchronization or wakefulness.3
During the second phase of AW-QS or QS-AW transition, our data demonstrated that many physiological signals exhibited abrupt all-or-none changes. It has been reported that output of the forebrain sleep center did not carry the information of sleep propensity but an all-or-none sleep command.9 The all-or-none command is more likely to be parallel with the second (fast) phase of sleep-wake transitions rather than the first (slow) phase. During and after the all-or-none switching process, the sleep circuitry may broadcast the sleep/wake information to the whole body through various pathways including the autonomic nervous system. Thus a positive feedback may be formed to stabilize the sleep/wake switch as well as the autonomic function. For example, during the first phase of sleep-wake transition, the sympathetic function gradually emerges until the abrupt second phase of sleep-wake transition. The abrupt transition of the sleep/wake circuitry may further reinforce the sympathetic function, which in turns enhances waking activity in the sleep/wake circuitry. Finally, a sustained waking state and sympathetic activation may be kept steadily after the abrupt switching.
As to the predictability of falling asleep by the parasympathetic activity, it can be explained by the transmission of a sleeping drive, which is generated elsewhere, to the parasympathetic activity. Symmetrically, the transmission of a waking drive, which is generated elsewhere and independent to the sleeping drive, to the sympathetic activity may lead to the phenomenon that the sympathetic activity may predict waking up. Since the parasympathetic activity can not predict the occurrence of sleep-to-wake transition, we suppose it does not carry the information of the waking drive. Symmetrically, since sympathetic activity can not predict the occurrence of wake-to-sleep transition, we suppose it does not carry the information of the sleeping drive. This also explains that the sympathetic index (LF/HF) is not correlated with the parasympathetic index (HF) during the first phase of either AW-QS or QS-AW transition.
Another important condition, the QS-PS transition, also exhibited unique changes in the autonomic functions. One noteworthy finding is that the QS-PS transition is accompanied with only a fast phase of change in the MPF, EMG, HF, and RR, but with a biphasic change in the delta power and LF/HF. However, no slow phase, as observed in the AW-QS and QS-AW transitions, was noted in the QS-PS transition. Since the slow phase is supposed to be related to the hindbrain sleep/wake centers and related peripheral inputs, the lack of the slow phase indicated a complete difference mechanism underlying QS-PS transition. Further study is still needed to elucidate this issue.
Cardiovascular variability analysis provides various noninvasive indices for the autonomic nervous system. Since it produces no extra stress on the study subjects, this technique is especially precious for the study of sleep. Although we have demonstrated the relationship between the sleep-wake transitions and the indirect measurements of the autonomic nervous system, a direct cause-effect evidence is yet to be explored. Along with the never-ending progress of technology, the technique of autonomic nervous system and sleep researches may be further refined in the future. We hope the data presented in this study may provide some clues for answering the mystery of sleep.
ACKNOWLEDGMENTS
We thank Ms. S. T. Liu, Y. C. Lee, and Mr. C. H. Chen for their excellent technical support.
This study was supported by a grant (YM-96A-D-P206) from the Ministry of Education, Aim for the Top University Plan and a grant (NSC-94-2314-B-010-076) from the National Science Council (Taiwan) and a research grant (TCMRC-93-103A-01) from the Tzu Chi Charity Foundation.
Footnotes
Disclosure Statement
This was not an industry supported study. The authors have indicated no conflicts of interest.
REFERENCES
- 1.Baharav A, Kotagal S, Gibbons V, et al. Fluctuations in autonomic nervous activity during sleep displayed by power spectrum analysis of heart rate variability. Neurology. 1995;45:1183–7. doi: 10.1212/wnl.45.6.1183. [DOI] [PubMed] [Google Scholar]
- 2.Zemaityte D, Varoneckas G, Sokolov E. Heart rhythm control during sleep. Psychophysiology. 1984;21:279–89. doi: 10.1111/j.1469-8986.1984.tb02935.x. [DOI] [PubMed] [Google Scholar]
- 3.Jouvet M. Neurophysiology of the states of sleep. Physiol Rev. 1967;47:117–77. doi: 10.1152/physrev.1967.47.2.117. [DOI] [PubMed] [Google Scholar]
- 4.Yang CCH, Shaw FZ, Lai CJ, Lai CW, Kuo TBJ. Relationship between electroencephalogram slow-wave magnitude and heart rate variability during sleep in rats. Neurosci Lett. 2003;336:21–4. doi: 10.1016/s0304-3940(02)01200-4. [DOI] [PubMed] [Google Scholar]
- 5.Yang CCH, Lai CW, Lai HY, Kuo TBJ. Relationship between electroencephalogram slow-wave magnitude and heart rate variability during sleep in humans. Neurosci Lett. 2002;329:213–6. doi: 10.1016/s0304-3940(02)00661-4. [DOI] [PubMed] [Google Scholar]
- 6.Brandenberger G, Ehrhart J, Piquard F, Simon C. Inverse coupling between ultradian oscillations in delta wave activity and heart rate variability during sleep. Clin Neurophysiol. 2001;112:992–6. doi: 10.1016/s1388-2457(01)00507-7. [DOI] [PubMed] [Google Scholar]
- 7.Ako M, Kawara T, Uchida S, et al. Correlation between electroencephalography and heart rate variability during sleep. Psychiatry Clin Neurosci. 2003;57:59–65. doi: 10.1046/j.1440-1819.2003.01080.x. [DOI] [PubMed] [Google Scholar]
- 8.Gottesmann C. The neurophysiology of sleep and waking: intracerebral connections, functioning and ascending influences of the medulla oblongata. Prog Neurobiol. 1999;59:1–54. doi: 10.1016/s0301-0082(98)00094-x. [DOI] [PubMed] [Google Scholar]
- 9.Saper CB, Chou TC, Scammell TE. The sleep switch: hypothalamic control of sleep and wakefulness. Trends Neurosci. 2001;24:726–31. doi: 10.1016/s0166-2236(00)02002-6. [DOI] [PubMed] [Google Scholar]
- 10.Sakai K, Crochet S. A neural mechanism of sleep and wakefulness. Sleep Biol Rhythm. 2003;1:29–42. [Google Scholar]
- 11.Kuo TBJ, Yang CCH, Chan SHH. Selective activation of vasomotor component of SAP spectrum by nucleus reticularis ventrolateralis in rats. Am J Physiol. 1997;272:H485–92. doi: 10.1152/ajpheart.1997.272.1.H485. [DOI] [PubMed] [Google Scholar]
- 12.Chen HI, Chai CY. Integration of the cardiovagal mechanism in the medulla oblongata of the cat. Am J Physiol. 1976;231:454–61. doi: 10.1152/ajplegacy.1976.231.2.454. [DOI] [PubMed] [Google Scholar]
- 13.Task Force of the European Society of Cardiology and the North American Society of Pacing and Electrophysiology. Heart rate variability: standards of measurement, physiological interpretation and clinical use. Circulation. 1996;93:1043–65. [PubMed] [Google Scholar]
- 14.Kuo TBJ, Lai CJ, Shaw FZ, Lai CW, Yang CCH. Sleep-related sympathovagal imbalance in SHR. Am J Physiol. 2004;286:H1170–76. doi: 10.1152/ajpheart.00418.2003. [DOI] [PubMed] [Google Scholar]
- 15.Malliani A, Pagani M, Lombardi F, Cerutti S. Cardiovascular neural regulation explored in the frequency domain. Circulation. 1991;84:482–92. doi: 10.1161/01.cir.84.2.482. [DOI] [PubMed] [Google Scholar]
- 16.Kuo TBJ, Lai CJ, Huang YT, Yang CCH. Regression analysis between heart rate variability and baroreflex-related vagus nerve activity in rats. J Cardiovasc Electrophysiol. 2005;16:864–9. doi: 10.1111/j.1540-8167.2005.40656.x. [DOI] [PubMed] [Google Scholar]
- 17.Delamont RS, Julu PO, Jamal GA. Sleep deprivation and its effect on an index of cardiac parasympathetic activity in early nonREM sleep in normal and epileptic subjects. Sleep. 1998;21:493–8. doi: 10.1093/sleep/21.5.493. [DOI] [PubMed] [Google Scholar]
- 18.Otzenberger H, Gronfier C, Simon C, et al. Dynamic heart rate variability: a tool for exploring sympathovagal balance continuously during sleep in men. Am J Physiol. 1998;275:H946–50. doi: 10.1152/ajpheart.1998.275.3.H946. [DOI] [PubMed] [Google Scholar]
- 19.Shaw FZ, Lai CJ, Chiu TH. A low-noise flexible integrated system for recording and analysis of multiple electrical signals during sleep-wake states in rats. J Neurosci Methods. 2002;118:77–87. doi: 10.1016/s0165-0270(02)00146-2. [DOI] [PubMed] [Google Scholar]
- 20.Kuo TBJ, Yang CCH. Scatterplot analysis of EEG slow-wave magnitude and heart rate variability: an integrative exploration of cerebral cortical and autonomic functions. Sleep. 2004;27:648–56. doi: 10.1093/sleep/27.4.648. [DOI] [PubMed] [Google Scholar]
- 21.Kuo TBJ, Shaw FZ, Lai CJ, Lai CW, Yang CCH. Changes in sleep patterns in spontaneously hypertensive rats. Sleep. 2004;27:406–12. doi: 10.1093/sleep/27.3.406. [DOI] [PubMed] [Google Scholar]
- 22.Kuo TBJ, Yang CCH. Sleep-related changes in cardiovascular neural regulation in spontaneously hypertensive rats. Circulation. 2005;112:849–54. doi: 10.1161/CIRCULATIONAHA.104.503920. [DOI] [PubMed] [Google Scholar]
- 23.Cerutti C, Gustin MP, Paultre CZ, et al. Autonomic nervous system and cardiovascular variability in rats: a spectral analysis approach. Am J Physiol. 1991;261:H1292–99. doi: 10.1152/ajpheart.1991.261.4.H1292. [DOI] [PubMed] [Google Scholar]
- 24.Kuo TBJ, Lin T, Yang CCH, Li CL, Chen CF, Chou P. Effect of aging on gender differences in neural control of heart rate. Am J Physiol. 1999;277:H2233–39. doi: 10.1152/ajpheart.1999.277.6.H2233. [DOI] [PubMed] [Google Scholar]
- 25.Villablanca JR. Counterpointing the functional role of the forebrain and of the brainstem in the control of the sleep-waking system. J Sleep Res. 2004;13:179–208. doi: 10.1111/j.1365-2869.2004.00412.x. [DOI] [PubMed] [Google Scholar]


