Abstract
The adipokine leptin participates not only in the regulation of feeding and obesity in adults but also in neonatal development. It crosses the blood-brain barrier (BBB) by receptor-mediated transport. Leptin concentrations in blood differ between neonates and adults. We determined the developmental changes of leptin receptor subtypes in the cerebral microvessels composing the BBB and examined their expected correlation with leptin transport across the BBB. Total RNA was extracted from enriched cerebral microvessels of mice 1, 7, 14, and 60 d of age for real-time RT-PCR analysis of leptin receptor subtypes. In cerebral microvessels from neonates, ObRa, ObRb, ObRc, and ObRe mRNA were all higher than in adults, but ObRd was not detectable. Hypothalamus showed similar age-related changes except for ObRb, which was higher in adults. The homologous receptor gp130 did not show significant age-related changes in either region. Despite the increase of leptin receptors, leptin permeation across the BBB after iv injection was less in the neonates. In situ brain perfusion with blood-free buffer showed no significant difference in the brain uptake of leptin between neonates and adults, indicating an antagonistic role of leptin-binding proteins in the circulation, especially the soluble receptor ObRe. The results are consistent with our previous finding that ObRe antagonizes leptin endocytosis in cultured endothelia and transport from blood to brain in mice. Overall, the developmental changes observed for leptin receptors unexpectedly failed to correlate with the entry of leptin into brain, and this may indicate different functions of the receptors in neonates and adults.
BECAUSE OF THE obesity epidemic, there is increasing attention to the role of leptin in fetal and neonatal development and its potential involvement in the obesity phenotype later in life (1). Perinatal leptin appears to be important in establishing feeding-related circuits in the hypothalamus and responses to later life insults (2). The blood-brain barrier (BBB) to peptides/polypeptides is completely developed in mammals at birth. This is shown by morphological evidence of tight junctions even during the embryonic stage (3,4) and by high transendothelial electrical resistance and low permeability to lanthanum (5). Thus, the BBB would not be freely permeable to leptin in the neonatal period. Circulating leptin in blood has to negotiate the BBB before reaching most regions of the central nervous system (CNS), including the hypothalamus (6). The specific transport system for leptin to cross the BBB, therefore, participates in the permeation of leptin from blood to brain in both neonatal and adult mice.
Circulating leptin crosses the BBB by receptor-mediated transport that is saturable and shows modulatory changes by a variety of nutritional and hormonal factors (7,8,9,10,11,12,13,14,15,16). In adults, ObRa has a high level of expression in cerebral microvessels and is considered the main transporting receptor. However, we recently have shown that all membrane-bound isoforms of the leptin receptor can mediate leptin transcytosis, whereas the soluble receptors inhibit transport (17,18). ObRb, the longest isoform that activates signal transducer and activator for transcription-3, mediates a variety of biological effects of leptin on hypothalamic neurons. Leptin concentrations in blood show age-dependent changes during development (2), but it is not clear whether leptin receptors also show dynamic changes during neonatal development. The level of receptor expression, together with the relative composition of receptor subtypes and their corresponding intracellular signaling, would play important roles in the development of neuroendocrine circuits.
Besides ObRa and ObRb, the receptor isoforms ObRc and ObRe also have been found in the cerebral microvessels that compose the BBB and in the hypothalamus. ObRe plays an antagonistic role in leptin transport across the BBB (18). Thus, we examined the hypotheses that leptin receptors show developmental changes and that these changes in turn modulate leptin transport in neonatal and adult mice. Because we mainly focused on microvessels isolated from cerebral cortex so as to avoid sampling the circumventricular organs, the hypothalamus was studied in parallel as a control region where receptor regulation is well documented.
In neonatal mice up to 2 wk of age and young adult mice 2 months old, we measured ObR mRNA expression with real-time RT-PCR and quantified leptin transport across the BBB by standard assays of multiple-time regression analysis and in situ brain perfusion. Although the hypothesized developmental changes of ObR subtypes were observed, the anticipated correlation between leptin transport across the BBB and the higher level of ObRa in the neonates did not occur. The results indicate a more complex interplay of receptor expression and BBB transport in the neonates than was expected.
Materials and Methods
The animal protocols were approved by the Institutional Animal Care and Use Committee. CD1/ICR and C57 mice (Charles River, Wilmington, MA) were anesthetized by ip injection of ketamine/xylazine. The neonatal mice were 1–14 d of age, and the adult mice were 2 months of age. Group sizes are specified for the individual experiments.
RNA extraction and real-time PCR
Microvessel-enriched fractions from the cerebral cortices of neonatal or adult mice were obtained by the capillary depletion method as described previously (19,20). This provides more than 40-fold enrichment of endothelial cells. The hypothalamus, possibly containing part of the median eminence and infundibulum but without the pituitary, was dissected immediately after decapitation of the mouse. The rostral border was the optic chiasm, and the most caudal parts were the mammillary bodies. With RNase-free forceps, the whole hypothalamus was removed from the brain, snap frozen in liquid nitrogen, and transferred to −80 C until RNA extraction within a week. Total RNA was obtained with an Absolutely RNA Miniprep Kit (Stratagene, La Jolla, CA).
For the initial assays of total ObR, ObRa, and ObRb, groups of CD1 neonatal and adult mice (n = 6 per group, unless specified) were studied simultaneously. The neonates for each group (1, 7, and 14 d old) were from the same litters, and there was no gender differentiation. The adults were 2-month-old males. A one-step core PCR kit (Applied Biosystems, Foster City, CA) was used for reversed transcription and mRNA amplification by use of TaqMan real-time PCR primers and fluorescent probes. The primers and probes for ObRa, ObRb, and the housekeeping gene GAPDH are listed in Table 1. Standard curves for the target genes were generated with neonatal capillaries, 14-d mouse hypothalamus, and endothelial cell lysates for ObRa, ObRb, and GAPDH, respectively. The levels of expression of ObRa and ObRb were normalized to that of GAPDH. The shared receptor for the glycoprotein (gp) 130 family of cytokines, which includes IL-6, leukemia inhibitory factor, ciliary neurotrophic factor (CNTF), and oncostatin M, has structural and functional homology with ObRs and has received increasing attention as a potential target for antiobesity therapy (21). Thus, gp130 mRNA was measured in parallel as a control.
Table 1.
TaqMan primers and probes for real-time PCR
| Sequence | |
|---|---|
| ObR | |
| 5′ Primer | CCATCTTTTATATGATCTGCCTGAAGT |
| 3′ Primer | TGCATTGGACAGTCTGAAAGCT |
| Probe | 6FAM-AGATGATTCGCCTCTGCCCCCACT-TAMRA |
| ObRa | |
| 5′ Primer | GAAGTCTCTCATGACCACTACAGATGA |
| 3′ Primer | TTGTTTCCCTCCATCAAAATGTAA |
| Probe | 6FAM-CCCAATCTACCAACTTCCCAACAGTCCA-TAMRA |
| ObRb | |
| 5′ Primer | GCATGCAGAATCAGTGATATTTGG |
| 3′ Primer | CAAGCTGTATCGACACTGATTTCTTC |
| Probe | 6FAM-CCTCTTCTTCTGGAGCCTGAACCCATTTC-TAMRA |
| gp130 | |
| 5′ Primer | CCAGCAACGAGGAGAATGAGT |
| 3′ Primer | TGTGCACCACAGTGGAGTACTG |
| Probe | 6FAM-TCAGAGCACCGCCAGCACGG-TAMRA |
| GAPDH | |
| 5′ Primer | TGTGTCCGTCGTGGATCTGA |
| 3′ Primer | CCTGCTTCACCACCTTCTTGA |
| Probe | 6FAM-CCGCCTGGAGAAACCTGCCAAGTATG-TAMRA |
For the subsequent assays of ObRa, ObRb, ObRc, ObRd, and ObRe mRNA, pups within the same group were randomly chosen from three different litters born at the same time. C57 pups of both genders at age 7 d (n = 5 per group) were compared with C57 males at age 2 months (n = 6 per group). RT was performed with a High-Capacity cDNA Reverse Transcription Kit (Applied Biosystems, Foster City, CA). PCR was performed by the mixing of cDNA templates, primers, and GoTaq Green Master Mix (Promega, Madison, WI). The primer sets are listed in Table 2. The cycling conditions were denaturing at 94 C for 5 min, extension at 94 C for 30 sec, 55 C for 30 sec, and then annealing at 72 C for 30 sec for 40 cycles, with final annealing for 10 min. End-product PCR was performed after maximization of cycle conditions. The results showed the absence of ObRd in cerebral microvessels and hypothalamus. Real-time PCR amplification of ObRa, ObRb, ObRc, and ObRe was then achieved by use of Power SYBR Green PCR Master Mix (Applied Biosystems). The PCR conditions were 50 C for 2 min, 95 C for 10 min, 95 C for 15 sec, and then 60 C for 1 min for 40 cycles, with final cycling of the temperature at 95 C, 60 C, and 95 C for 15 sec each. SYBR Green PCR was used because of the lack of sufficient length for specificity of the 3′ untranslated regions to differentiate ObRa, ObRc, and ObRd by TaqMan primers and probes.
Table 2.
SYBR Green primers for real-time PCR
| 5′ Primer | 3′ Primer | |
|---|---|---|
| ObRa | GAAGTCTCTCATGACCACTACAGATGA | TTGTTTCCCTCCATCAAAATGTAA |
| ObRb | GCATGCAGAATCAGTGATATTTGG | CAAGCTGTATCGACACTGATTTCTTC |
| ObRc | AGGGCTTTATGTTGTTGTGTTC | TTTCTCTGATCAAATCCCAAAC |
| ObRd | CACACCAGAGAATGAAAA | TCTGAAAATAAAAACTTCATGT |
| ObRe | TAATGAAGATGATGGAATGAAG | ATTGCCAGTCTACAGTGTCA |
Multiple-time regression analysis
Because leptin is relatively stable in the circulation and has a slow permeation across the BBB, its influx rate and volume of distribution in the brain can be measured by multiple-time regression analysis after iv bolus injection of the tracer. Groups of neonatal and adult mice were studied simultaneously. The 11-d-old neonatal mice (n = 11 per group) received 15 μl radiotracer in lactated Ringer’s solution containing 1% BSA iv, and the 2-month-old adult mice (n = 12 per group) received 100 μl. [125I]Leptin and the vascular permeability marker [131I]albumin were radioactively labeled by the chloramine-T method and purified on Sephadex G-10 columns, as previously described (22). Among different batches, the mean specific activities for [125I]leptin and [131I]albumin were 67 and 51 Ci/g, and acid precipitation was 95 and 99%, respectively. The mixed radioisotopes (20,000 cpm/μl each) were injected into the anesthetized mice in a bolus through the left jugular vein at time zero. At 1–20 min (different mice for each time point), blood was collected from the right common carotid artery, and the mouse was decapitated immediately. The radioactivity of serum and weighed brain was measured in a γ-counter (Wallac, Gaithersburg, MD) by use of a dual-channel program. The brain/serum ratio of radioactivity was plotted against exposure time, the latter being the theoretical value of steady-state serum radioactivity as previously described (23). The regression correlation was determined with Prism GraphPad statistical software (San Diego, CA). The statistical difference of the slope (influx rate) and y-intercept (initial volume of distribution) between the neonatal and adult groups was compared with the same analysis program.
In situ brain perfusion
To examine the transport occurring at the BBB level without interference from blood-borne binding proteins and enzymatic degradation, in situ brain perfusion was performed in blood-free, preoxygenated physiological perfusion buffer containing 1% BSA (pH 7.4), as described previously (24). Groups of 7-d-old neonatal (n = 7) and 2-month-old adult mice (n = 6) were anesthetized, and the in situ brain perfusion system was generated after the descending aorta was clamped and the right atrium and bilateral jugular veins cut. The perfusate (1000 cpm/μl each of [125I]leptin and [131I]albumin in buffer) was delivered by syringe pumps (Harvard Apparatus, Holliston, MA). The perfusion rate was 0.25 ml/min for neonates and 2 ml/min for adult mice. Each mouse was perfused with radioisotope for 5 min, preceded by 2 min of pre-perfusion and followed by 1 min of post-perfusion with buffer only to remove blood and residual radioisotope from the vascular space. The coadministered [131I]albumin served as an internal control for the vascular space and ensured that the delivery method did not cause nonspecific disruption of the BBB. The brain/perfusate ratio in each group was calculated, and differences between groups receiving [125I]leptin or [131I]albumin were compared by ANOVA.
Statistical analyses
The real-time PCR data were analyzed by both the standard curve method and δδCT method whenever appropriate. Group means are presented with their se. The overall difference among the groups was compared by ANOVA followed by Tukey’s post hoc test when applicable.
Results
ObR mRNA shows developmental changes in cerebral microvessels
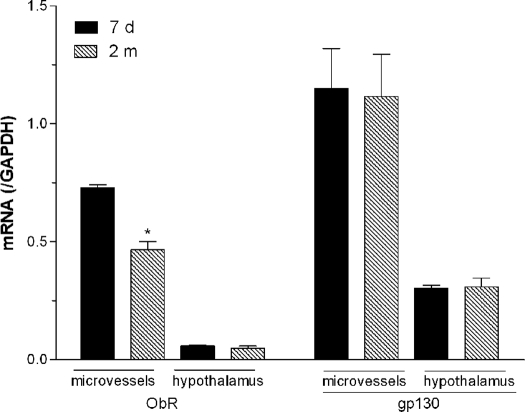
We first determined whether total ObR mRNA showed significant changes between groups of neonates (7 d old) and young adult (2 months old) mice (n = 2 per group). The level of gp130 mRNA expression seemed to be higher than that of ObR in both cerebral microvessels and the hypothalamus, but a more meaningful comparison would involve determination of different efficiencies of amplification. In the microvessels, ObR mRNA was higher in the neonates and significantly decreased in the adult mice. In the hypothalamus, total ObR showed no difference between the neonatal and adult groups (Fig. 1).
Figure 1.
Expression of leptin receptors in cerebral microvessels composing the BBB and in the hypothalamus, shown by TaqMan real-time PCR. Compared with the 7-d-old neonates, ObR mRNA in the 2-month-old adults showed a significant decrease in the microvessels but not in the hypothalamic area. The homologous receptor gp130 had no age-related changes in mRNA in either region. *, P < 0.05 (n = 6 per group).
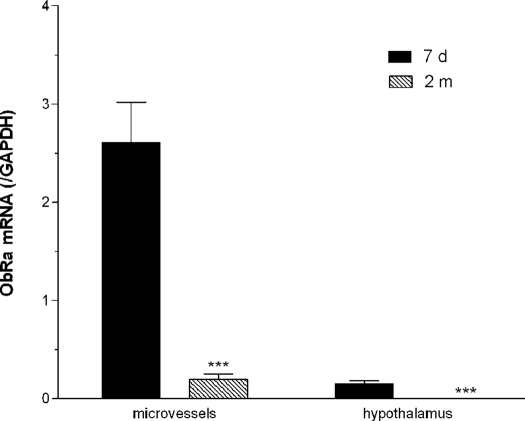
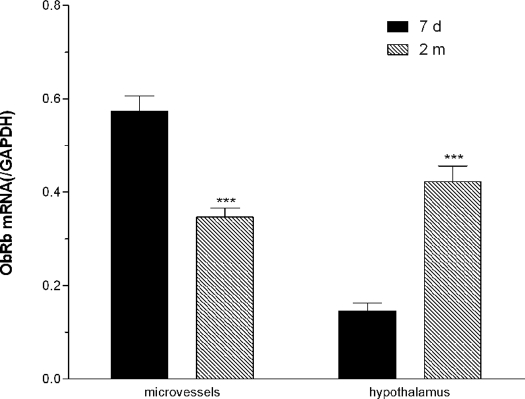
To determine the relative contribution of ObR subtypes in the developmental changes, we designed specific TaqMan primers and fluorescent probes for ObRa and ObRb. Real-time PCR showed that ObRa mRNA was decreased significantly in adults when compared with the 7-d-old neonates. This was seen in both microvessels and the hypothalamus (Fig. 2, n = 6 per group). ObRb mRNA also showed a significant decrease in the microvessels in the adult mice. However, there was a significant increase of ObRb in the hypothalamus of adult mice (Fig. 3, n = 6 per group). The opposing changes of ObRa and ObRb may explain the lack of significant change in total ObR in the hypothalamus seen in Fig. 1.
Figure 2.
TaqMan real-time PCR on ObRa mRNA expression. In both microvessels and hypothalamus, ObRa was significantly lower in the 2-month-old adult mice than in the 7-d-old neonates. ***, P < 0.005 (n = 6 per group).
Figure 3.
TaqMan real-time PCR on ObRb mRNA expression. ObRb was significantly lower in the microvessels but higher in the hypothalamus in the adult mice (2 months old) than in the neonates (7 d old). ***, P < 0.005 (n = 6 per group).
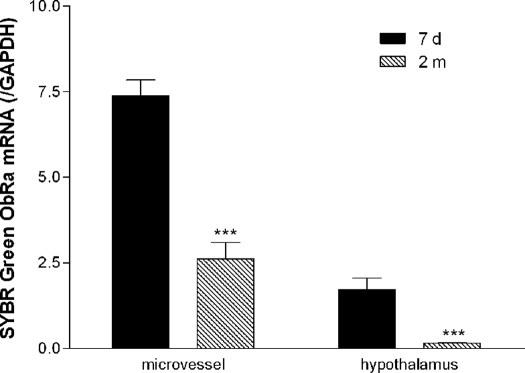
Apart from ObRe, which is a soluble receptor, all the other ObR isoforms are single transmembrane proteins that share the extracellular, transmembrane, and part of the membrane juxtapositional cytoplasmic domain. ObRa, ObRc, and ObRd have similar lengths at the C terminus, and the 3′ untranslated region has limited differences, evading detection by use of TaqMan probes. Thus, we further performed SYBR Green real-time PCR. As shown in Fig. 4, the expression of ObRa mRNA was significantly higher in the microvessels than in the hypothalamic tissue from either age group (P < 0.001). In both regions, the 7-d-old neonates showed significantly higher ObRa mRNA than 2-month-old adults (P < 0.001).
Figure 4.
The reduction of ObRa with maturation was confirmed by SYBR Green real-time PCR. In both microvessels and hypothalamus, the neonates (7 d old, n = 5) had significantly higher ObRa than the adults (2 months old, n = 6). ***, P < 0.005.
Use of SYBR Green for ObRb mRNA showed similar changes as observed with the TaqMan method in the microvessels with a trend toward significance (P = 0.08) when neonates and adults were compared. The increase of ObRb in the hypothalamus in the adult group remained significant (P < 0.001) (Fig. 5).
Figure 5.
SYBR Green real-time PCR showed that ObRb was lower in 2-month-old adults (n = 6) than in the 7-d-old neonates (n = 5) in the microvessels. The hypothalamus showed opposite changes, with a significant increase in the adult group. +, P = 0.08; ***, P < 0.005.
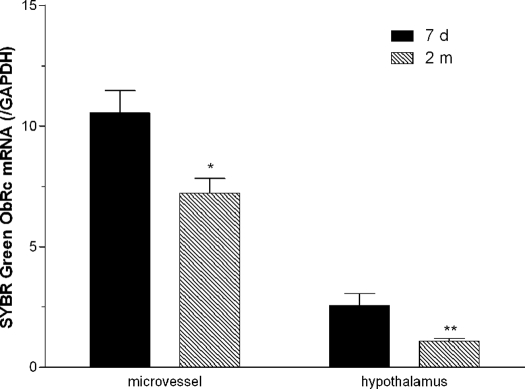
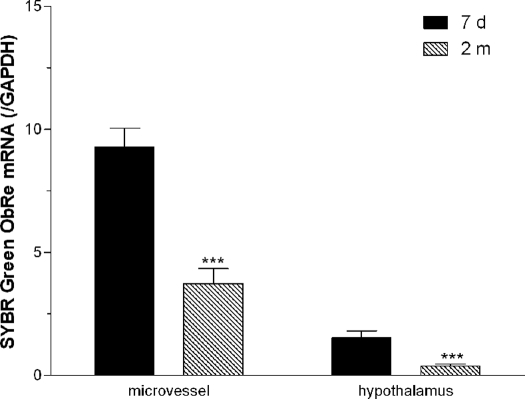
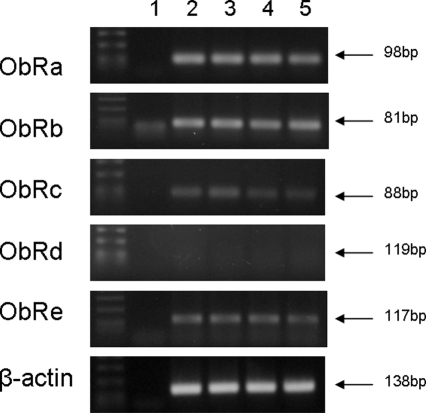
The changes of ObRc (Fig. 6) and ObRe (Fig. 7) were similar to that of ObRa. ObRd mRNA was not detectable in microvessels or in hypothalamus. This is shown by the lack of a specific band in the end-product PCR (Fig. 8).
Figure 6.
SYBR Green real-time PCR showed significant reduction of ObRc in both microvessels and hypothalamus in the adult mice (2 months old, n = 6) when compared with the 7-d-old neonates (n = 5). *, P < 0.05; **, P < 0.01.
Figure 7.
SYBR Green real-time PCR showed that adults (2 months old, n = 6) had significantly lower ObRe than neonates (7 d old, n = 5). This was seen in both microvessels and hypothalamus.
Figure 8.
Confirmation of ObR subtypes in cerebral microvessels and hypothalamus by PCR: lane 1, no-template control; lane 2, microvessels from 7-d-old neonate; lane 3, microvessels from 2-month-old adult; lane 4, hypothalamus from 7-d-old neonate; lane 5, hypothalamus from 2-month-old adult. Note the absence of amplification of ObRd, in contrast to the positive products of ObRa, ObRb, ObRc, and ObRe. β-Actin was amplified as an internal control.
Rapid induction of microvascular ObRa mRNA in the neonatal period
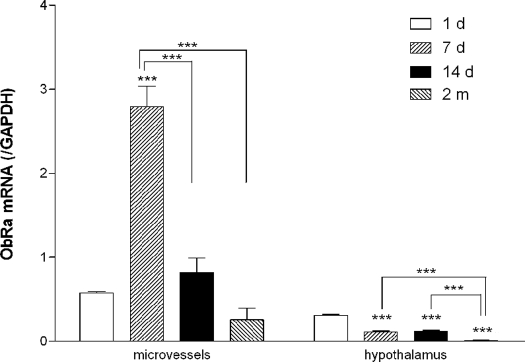
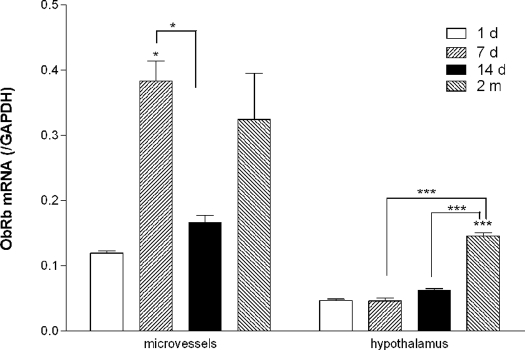
To determine whether the receptors for leptin had changes in expression (which would be expected to determine the response to leptin), groups of mice were killed at different ages after birth. The levels of mRNA expression for ObRa and ObRb (normalized to GAPDH) at 1 d, 7 d, 14 d, and 2 months were compared. The mRNA expression of both ObRa and ObRb in microvessels peaked at 7 d. ObRb mRNA appeared to have a second peak in the 2-month-old mice as compared with the 1-d-old mice. In the hypothalamus, ObRa mRNA decreased with age (Fig. 9), but ObRb mRNA increased in the adult mice (Fig. 10).
Figure 9.
Dynamic changes of ObRa expression from 1-d-old to 2-month-old mice shown by TaqMan PCR. Cerebral microvascular ObRa mRNA was highest at d 7 after birth and decreased by d 14. Both were higher than at d 1 and 2 months. Hypothalamic ObRa was highest at d 1, decreased during the neonatal period, and was lowest at 2 months. Asterisks above the bar indicate comparison with 1-d-old group. Asterisks connected by a line indicate comparison between other groups. ***, P < 0.005 (n = 2 for the 1-d group; n = 4 for the rest).
Figure 10.
Dynamic changes in ObRb expression shown by TaqMan real-time PCR. Cerebral microvascular ObRb mRNA was highest at d 7 and increased again at 2 months. Hypothalamic ObRb was highest in the adults. Asterisks above the bar indicate comparison with 1-d-old group. Asterisks connected by a line indicate comparison between other groups. *, P < 0.05; ***, P < 0.005 (n = 2 for the 1-d group; n = 4 for the rest).
Leptin transport across the BBB after iv delivery
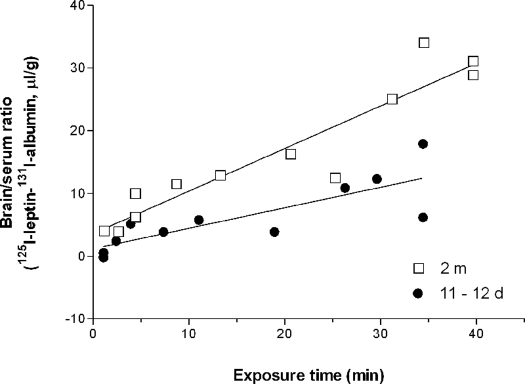
[125I]Leptin and [131I]albumin were delivered in a bolus to the jugular vein at time zero, and individual mice in the neonatal and adult groups were studied at different time intervals 1–20 min after iv injection. In Fig. 11, the x-axis is the exposure time, the theoretical steady-state time if the blood concentration of leptin had remained constant during the study period. The y-axis is the uptake of leptin by the brain. The value of [125I]leptin at each time point was normalized by subtraction of the corresponding value of [131I]albumin to correct for the retention of radioisotopes in the cerebral vascular space. The influx rate of leptin in the adult mice was significantly higher than that in the neonatal mice (P < 0.005). Thus, leptin showed a more rapid penetration across the BBB in the adult mice. This contrasts with the lack of significant changes of leptin influx in the peripheral organs studied simultaneously (kidney, lungs, and spleen; data not shown).
Figure 11.
The influx rate of [125I]leptin (corrected for vascular space by subtraction of the brain/blood ratio of [131I]albumin) was significantly higher (P < 0.005) in the adult mice (2 months old, n = 12) than in the neonates (11 d old, n = 11).
Leptin transport across the BBB after in situ brain perfusion
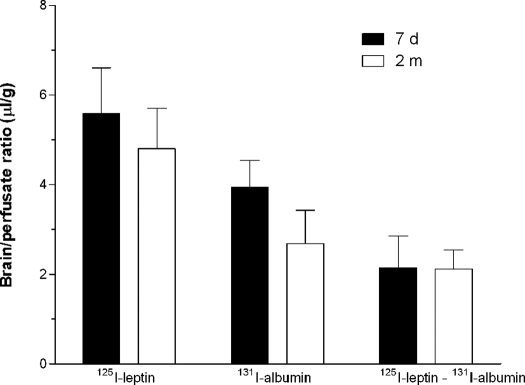
In the in situ brain perfusion study, [125I]leptin and [131I]albumin were delivered intracardially in blood-free physiological buffer, so that the potential issues of any age difference in binding proteins, lipids, or enzymatic degradation in the circulation were obviated. We used different perfusion speeds for the adult and neonatal groups (n = 6 per group), based on the difference in body weight and supportive evidence from the literature characterizing the impact of perfusion rate and amount delivered on the saturable transport system for leptin (25). After 10 min of in situ brain perfusion, there was no significant difference for leptin or albumin with age. The normalized leptin uptake, after subtraction of albumin uptake to correct for vascular space and nonspecific permeation, also was not different between the neonates and adults (Fig. 12).
Figure 12.
The brain/perfusate ratio of [125I]leptin and [131I]albumin was not significantly different in the adult (2 months old, n = 6) and neonatal (7 d old, n = 7) groups 10 min after perfusion. The corrected values ([125I]leptin and [131I]albumin) also showed no difference.
Discussion
There are several compelling reasons to determine the developmental changes of ObRs and its potential correlation with BBB transport of leptin (1). Leptin concentration in blood differs between neonates and adults, but it is not yet known whether the level of receptor expression and transport function have evolved during the stages of neonatal development. Elmquist et al. (26) have shown by in situ hybridization that ObRb mRNA in the adult rat has uneven distribution among hypothalamic nuclei. ObRb is also localized in the thalamus, cerebellum, choroid plexus, meninges, and surrounding blood vessels (26). Intravenous leptin activates selective groups of hypothalamic neurons, and only some of the c-Fos-positive neurons receive innervation from intrahypothalamic circuits (27). Also, in rats, the surge of leptin concentrations in blood precedes the peaks of other neuroendocrine hormones in the neonatal period and is more susceptible to differential regulation by feeding and circadian rhythm than in adults (2). Thus, leptin participates not only in the regulation of feeding behavior and the obesity phenotype in adults but also in neonatal development (2). In adults, the ObRa leptin receptor has a higher level of expression in cerebral microvessels than ObRb and is considered the main transporter for leptin across the BBB (8,9,10,11,28). However, we have shown in the overexpression system that all transmembrane isoforms of ObRs can transport leptin, given a sufficient level of expression (17). It was not known whether all ObR isoforms are present in the neonatal BBB. Thus, the main goal of this study was to determine the developmental changes of these leptin receptors in the cerebral microvessels that compose the BBB and to test their expected correlation with the transport of leptin across the BBB.
We first determined the overall ObR expression and found that neonatal mice had a significantly higher level of ObR expression in cerebral microvessels but not in the hypothalamus. The higher total vascular ObR expression in neonates contrasts with the lack of developmental changes of gp130, a transmembrane glycoprotein receptor shared by IL-6, leukemia inhibitory factor, CNTF, oncostatin M, and others. The gp130 receptor shares structural homology with ObR and also activates Janus kinase/signal transducer and activator of transcription pathways upon ligand binding (29). Recently, increasing attention has been focused on the role of gp130 ligands in the development and regulation of obesity, particularly CNTF in the hypothalamus (21). The regulation of gp130 protein occurs mainly at the transcriptional level (30). Unlike the ObRs, we showed that gp130 mRNA was not developmentally regulated.
The higher level of overall ObR expression in the cerebral microvessels of the neonates consisted of higher ObRa, ObRa, ObRc, and ObRe. The TaqMan real-time PCR detection system uses sequence-specific probes and employs the principle of fluorescent resonance energy transfer. This confers greater sensitivity and specificity than the SYBR Green reporter dye, which binds to double-strand DNA. That is why significantly higher ObRb mRNA in the neonates than the adult microvessels was shown by use of the TaqMan probe, whereas only a trend toward a significant increase was seen with the SYBR Green method. However, ObRa, ObRc, and ObRd have limited differences in their 3′ regions, making it impossible to design TaqMan probes and 3′ primers that have subtype specificity. Therefore, after showing the significant increase of ObRa and ObRb mRNA by TaqMan probes, we reproduced the findings with different samples and detected ObRc-ObRe expression by the SYBR Green method. The similar results by these two different methods also obviated the influence of litter size, nutritional status, and gender bias in the sampling. By cross-fostering studies, it has been shown that maternal status, particularly gestational diabetes, may have a profound impact on the development of neuroendocrine circuitry in the hypothalamus, which probably causes differences in feeding behavior, metabolism, and weight control (31). Because the two sets of studies used different strains of mice (CD1 and C57) with different methods for selection of pups, the same direction of change indicated that the developmental difference is present in both outbred and inbred mice. Overall, we showed definitive evidence that ObRa, ObRb, ObRc, and ObRe mRNAs in cerebral microvessels were all higher in the 7-d-old neonates than the 2-month-old male mice. ObRd was not present in the mouse BBB.
During the neonatal period, ObRa and ObRb mRNA expression in microvessels was higher at d 7 than d 1 or 14. This appears to coincide with the reported leptin surge in female C57 mice, which has a 5- to 10-fold increase during the second postnatal week (2). Interestingly, ObRb mRNA showed biphasic changes, being lower at d 1 and 14 and highest at d 7 but increased again at age 2 months as compared with d 14. The factors driving the transcriptional regulation of ObRs are not yet clear, but they probably involve nutritional and hormonal elements, including leptin itself.
The age-related changes of ObR mRNA expression in the hypothalamus were similar to those in cerebral microvessels with the exception of ObRb. In this study in which hypothalamus served as a control for the BBB vascular ObR expression, we did not dissect different hypothalamic nuclei that have different receptor densities for ObRb (26). The sampling also may have contained parts of the median eminence, which is a circumventricular organ lying outside the BBB. Nevertheless, in hypothalamic tissue dissected by the same method we used, the brain to blood ratio of iv injected [99mTc]albumin has been shown to be lower than in other brain regions when measured for an even longer time (2–120 min) (32). This indicates negligible entry from the median eminence. Regardless, the results indicate that the hypothalamus is subjected to different control mechanisms than the microvessels in terms of ObRb transcriptional regulation. This is consistent with the recurrent theme that the hypothalamus is protected by the BBB (6,33).
Determination of ObR subtypes at the protein level is still hampered by the lack of ObRa-, ObRc-, and ObRd-specific antibodies, although ObRb and ObRe may be differentiated by their different lengths on Western blot. By far, real-time PCR is the most sensitive method to quantify the differences among the isoforms. Nevertheless, caution is warranted in interpretation of the findings because posttranscriptional regulation and protein turnover may differ among the subtypes. This is seen in our studies of the gp190 and gp130 receptors for leukemia inhibitory factor, which are mainly regulated by protein degradation and transcription in response to TNF, respectively (30,34).
To test whether the higher level of ObR mRNA in neonatal mice is translated into greater permeability to leptin, we performed transport assays with established methods. [125I]Leptin was used as a sensitive tracer because it retains its biological activity and has the advantage of even greater conformational fidelity to the native polypeptide than does [3H]leptin (23). This is similar to what has been found for neurotrophic factors, with biological activity unaltered by radiolabeling (35,36,37). The multiple-time regression analysis measures the rate of influx of [125I]leptin across the BBB and determines its volume of distribution in the brain. It would be predicted, based on the higher level of microvascular transporting receptor expression, that neonatal mice should have more rapid permeation of leptin across the BBB. Unexpectedly, the adult mice showed a higher influx rate than the neonates to iv delivered leptin.
The mismatch between receptor expression and transport function suggests that factors other than ObRa (and ObRb) are involved. Other possible variables include blood leptin concentrations, serum leptin-binding proteins, and even lipids such as triglycerides (14,15). In Koletsky rats, which have a nonsense leptin receptor mutation and are obese, reduced permeation of leptin after iv delivery is also found (11). In these rats, however, leptin crosses the BBB by a saturable transport system similar to that in normal animals if delivered by in situ brain perfusion, suggesting the presence of additional factors governing leptin transport besides the mutated receptors (28).
The neonatal period shows a remarkable fluctuation of blood leptin concentrations. In mice, there is a surge of leptin (up to 50 ng/ml) at 10 d of age, preceded by significantly higher leptin mRNA in fat tissue and followed by an increase in corticosterone, insulin, estradiol, and T4 (2). Lower leptin concentrations in rodent neonates than adults also have been reported (38). In human infants, rapid decreases of leptin concentrations after birth have been observed in different studies (39,40). The concentration of leptin in 3 d-old infants is significantly lower than that at birth, although it is increased in gestational diabetes (41). There is a significant drop of blood leptin at d 5. Leptin concentrations in 1-month-old infants approach adult levels. The leptin concentrations in neonates are correlated with body weight, gestational age, insulin, IGF-binding protein 3, and maternal body mass index at the time of delivery (42). Fluctuating endogenous leptin levels might affect receptor expression and transport function. Because the transport system for leptin has a relatively low capacity and can be partially saturated in physiological states (25), even small fluctuations of these peripheral factors may affect leptin transport across the BBB.
To avoid the potential interference of endogenous leptin and other blood-borne factors in the transport assays, we performed in situ brain perfusion studies. The in situ brain perfusion complements multiple-time regression analysis, illustrating different aspects of the transport system (23,43,44). The uptake of leptin from the perfusate was similar in the neonates and adults, indicating that the intrinsic transport system at the BBB did not differ with age.
In adults, blood concentrations of leptin are associated with feeding status and show circadian rhythms in both leptin production and transport across the BBB (45). In neonates, however, leptin does not seem to be acutely regulated by food deprivation during the early postnatal period (2). Nonetheless, the time of day when the studies were conducted, the duration of separation from dam, and the gender of the mouse may all introduce possible experimental variability. Therefore, we performed the mouse studies at a fixed time (1500 h) and used only 2-month-old males to compare with neonates of both sexes, before estradiol and corticosterone surges occur.
The most apparent change that may explain the lower rate of transport of leptin in neonatal mice is the higher level of ObRe in their microvessels. Soluble receptors for leptin can serve not only as antagonists of leptin transport across the BBB but also of leptin trafficking in cultured cells (18). ObRe is the main soluble receptor and binds to leptin with high affinity. The age-dependent changes of ObRe expression are consistent with variable leptin-binding activity in the circulation during development (46,47,48,49).
Soluble receptors other than ObRe also may play a role. In rodents, soluble leptin receptor may be generated by alternative splicing of ObR mRNA and/or as a cleavage product of ObR membrane-anchored receptors. After food restriction in rats, higher levels of soluble receptors are caused mainly by shedding of ObRa membrane-anchored receptors rather than by ObRe expression (50). Apart from ObRe, higher levels of ObRa might also lead to increased generation of soluble receptors to inhibit leptin transport across the BBB.
The BBB is the gatekeeper for peripheral peptides accessing their CNS targets, and it undergoes developmental changes as the vascular endothelial cells from the mesoderm intertwine with neurotubules derived from the ectoderm during the embryonic stage. Theoretically, the lower permeability of the BBB to leptin in the neonates, as well as the low level of ObRb expression in the hypothalamus at this state, might help restrict the activation of leptin signaling. The low level of ObRb mRNA in the hypothalamus is consistent with immunohistochemical evidence that neonatal ObRb expression is low in the neonatal hypothalamus compared with adults (38). This does not rule out the important role of leptin signaling in other CNS regions during brain development. ObRb mRNA has been observed in the ventricular zone, the cortical plate of the telencephalon, and the thalamus in the early embryonic state,and later emerges in the hypothalamus, superior colliculi, cerebellum, and facial nucleus (51). Despite the relatively low level of permeation of leptin across the BBB in neonates compared with adults, leptin may still serve significant biological functions in neonatal CNS development.
In summary, our results show developmental changes in leptin receptors and transport. Quantitatively, the mRNA expression of ObRa, ObRb, ObRc, and ObRe in cerebral microvessels of neonatal mice was higher than in adults. However, the blood-to-brain influx of leptin across the neonatal BBB was decreased, even though the intrinsic capacity of leptin transport, shown by in situ brain perfusion, was apparently unchanged with age. This challenges the longstanding notion that ObRa is consistently the main regulator of leptin transport into the brain. Soluble receptors, including ObRe, may antagonize leptin transport in the neonates with higher expression. The lack of positive correlation of ObRa expression in the endothelial cells of the BBB with leptin transport was unexpected. This reflects the complexity of factors affecting the entry of leptin into brain and its potential regulation of CNS functions.
Acknowledgments
We thank Dr. Yan Zhang for assistance in the primer design for SYBR Green real-time PCR. Editorial support was provided by Ms. Loula Burton.
Footnotes
This work was supported by National Institutes of Health (NS45751 and NS46528 to W.P. and DK54880 to A.J.K.).
First Published Online November 26, 2007
See editorial p. 875.
Abbreviations: BBB, Blood-brain barrier; CNS, central nervous system; CNTF, ciliary neurotrophic factor; gp, glycoprotein.
References
- Bouret SG, Simerly RB 2006 Developmental programming of hypothalamic feeding circuits. Clin Genet 70:295–301 [DOI] [PubMed] [Google Scholar]
- Ahima RS, Prabakaran D, Flier JS 1998 Postnatal leptin surge and regulation of circadian rhythm of leptin by feeding. Implications for energy homeostasis and neuroendocrine function. J Clin Invest 101:1020–1027 [DOI] [PMC free article] [PubMed] [Google Scholar]
- Delorme P, Gayet J, Grignon G 1970 Ultrastructural study on transcapillary exchanges in the developing telencephalon of the chicken. Brain Res 22:269–283 [DOI] [PubMed] [Google Scholar]
- Mollgard K, Saunders N 1986 The development of the human blood-brain and blood-CSF barriers. Neuropathol Appl Neurobiol 12:337–358 [DOI] [PubMed] [Google Scholar]
- Butt A, Jones H, Abbott NJ 1990 Electrical resistance across the blood-brain barrier in anaesthetized rats: a developmental study. J Physiol 429:47–62 [DOI] [PMC free article] [PubMed] [Google Scholar]
- Kastin AJ, Pan W 2006 Intranasal leptin: blood-brain barrier bypass (BBBB) for obesity? Endocrinology 147:2086–2087 [DOI] [PubMed] [Google Scholar]
- Banks WA, Kastin AJ, Huang W, Jaspan JB, Maness LM 1996 Leptin enters the brain by a saturable system independent of insulin. Peptides 17:305–311 [DOI] [PubMed] [Google Scholar]
- Bjørbæk C, Elmquist JK, Michl P, Ahima RS, van Bueren A, McCall AL, Flier JS 1998 Expression of leptin receptor isoforms in rat brain microvessels. Endocrinology 139:3485–3491 [DOI] [PubMed] [Google Scholar]
- Hileman SM, Tornøe J, Flier JS, Bjørbæk C 2000 Transcellular transport of leptin by the short leptin receptor isoform ObRa in Madin-Darby canine kidney cells. Endocrinology 141:1955–1961 [DOI] [PubMed] [Google Scholar]
- Hileman SM, Pierroz DD, Masuzaki H, Bjorbaek C, El Haschimi K, Banks WA, Flier JS 2002 Characterization of short isoforms of the leptin receptor in rat cerebral microvessels and of brain uptake of leptin in mouse models of obesity. Endocrinology 143:775–783 [DOI] [PubMed] [Google Scholar]
- Kastin AJ, Pan W, Maness LM, Koletsky RJ, Ernsberger P 1999 Decreased transport of leptin across the blood-brain barrier in rats lacking the short form of the leptin receptor. Peptides 20:1449–1453 [DOI] [PubMed] [Google Scholar]
- Kastin AJ, Pan WH, Akerstrom V, Hackler L, Wang CF, Kotz CM 2002 Novel peptide-peptide cooperation may transform feeding behavior. Peptides 23:2189–2196 [DOI] [PubMed] [Google Scholar]
- Banks WA, Farrell CL 2003 Impaired transport of leptin across the blood-brain barrier in obesity is acquired and reversible. Am J Physiol 285:E10–E15 [DOI] [PubMed] [Google Scholar]
- Banks WA, Altmann J, Sapolsky RM, Phllips-Conroy JE, Morley JE 2003 Serum leptin levels as a marker for a syndrome X-like condition in wild baboons. J Clin Endocrinol Metab 88:1234–1240 [DOI] [PubMed] [Google Scholar]
- Banks WA, Coon AB, Robinson SM, Moinuddin A, Shultz JM, Nakaoke R, Morley JE 2004 Triglycerides induce leptin resistance at the blood-brain barrier. Diabetes 53:1253–1260 [DOI] [PubMed] [Google Scholar]
- Banks WA 2006 Denial versus dualism: the blood-brain barrier as an interface of the gut-brain axis. Endocrinology 147:2609–2610 [DOI] [PubMed] [Google Scholar]
- Tu H, Pan W, Feucht L, Kastin AJ 2007 Convergent trafficking pattern of leptin after endocytosis mediated by ObRa-ObRd. J Cell Physiol 212:215–222 [DOI] [PubMed] [Google Scholar]
- Tu H, Kastin AJ, Hsuchou H, Pan W 2008 Soluble receptor ObRe inhibits leptin transport. J Cell Physiol 214:301–305 [DOI] [PubMed] [Google Scholar]
- Pan W, Ding Y, Yu Y, Ohtaki H, Nakamachi T, Kastin AJ 2006 Stroke upregulates TNF α transport across the blood-brain barrier. Exp Neurol 198:222–233 [DOI] [PubMed] [Google Scholar]
- Yu C, Pan W, Tu H, Waters S, Kastin AJ 2007 TNF activates p-glycoprotein in cerebral microvascular endothelial cells. Cell Physiol Biochem 20:853–858 [DOI] [PubMed] [Google Scholar]
- Febbraio MA 2007 gp130 receptor ligands as potential therapeutic targets for obesity. J Clin Invest 117:841–849 [DOI] [PMC free article] [PubMed] [Google Scholar]
- Pan W, Akerstrom V, Zhang J, Pejovic V, Kastin AJ 2004 Modulation of feeding-related peptide/protein signals by the blood-brain barrier. J Neurochem 90:455–461 [DOI] [PubMed] [Google Scholar]
- Kastin AJ, Akerstrom V, Pan W 2001 Validity of multiple-time regression analysis in measurement of tritiated and iodinated leptin crossing the blood-brain barrier: meaningful controls. Peptides 22:2127–2136 [DOI] [PubMed] [Google Scholar]
- Pan W, Banks WA, Kastin AJ 1998 Permeability of the blood-brain barrier to neurotrophins. Brain Research 788:87–94 [DOI] [PubMed] [Google Scholar]
- Banks WA, Clever CM, Farrell CL 2000 Partial saturation and regional variation in the blood-to-brain transport of leptin in normal weight mice. Am J Physiol 278:E1158–E1165 [DOI] [PubMed] [Google Scholar]
- Elmquist JK, Bjorbaek C, Ahima RS, Flier JS, Saper CB 1998 Distributions of leptin receptor mRNA isoforms in the rat brain. J Comp Neurol 395:535–547 [PubMed] [Google Scholar]
- Elmquist JK, Ahima RS, Elias CF, Flier JS, Saper CB 1998 Leptin activates distinct projections from the dorsomedial and ventromedial hypothalamic nuclei. Proc Natl Acad Sci USA 95:741–746 [DOI] [PMC free article] [PubMed] [Google Scholar]
- Banks WA, Niehoff ML, Martin D, Farrell CL 2002 Leptin transport across the blood-brain barrier of the Koletsky rat is not mediated by a product of the leptin receptor gene. Brain Research 950:130–136 [DOI] [PubMed] [Google Scholar]
- Baumann H, Morella KK, White DW, Dembski M, Bailon PS, Kim H, Lai CF, Tartaglia LA 1996 The full-length leptin receptor has signaling capabilities of interleukin 6-type cytokine receptors. Proc Natl Acad Sci USA 93:8374–8378 [DOI] [PMC free article] [PubMed] [Google Scholar]
- Yu C, Kastin AJ, Pan W 2007 TNF reduces LIF endocytosis despite increasing NFκB-mediated gp130 expression. J Cell Physiol 213:161–166 [DOI] [PubMed] [Google Scholar]
- Fahrenkrog S, Harder T, Stolaczyk E, Melchior K, Franke K, Dudenhausen JW, Plagemann A 2004 Cross-fostering to diabetic rat dams affects early development of mediobasal hypothalamic nuclei regulating food intake, body weight, and metabolism. J Nutr 134:648–654 [DOI] [PubMed] [Google Scholar]
- Banks WA, Ibrahimi F, Farr SA, Flood JF, Morley JE 1999 Effects of wheatgerm agglutinin and aging on the regional brain uptake of HIV-1GP120. Life Sci 65:81–89 [DOI] [PubMed] [Google Scholar]
- Kastin AJ, Pan W 2003 Feeding peptides interact in several ways with the blood-brain barrier. Curr Pharm Des 9:789–794 [DOI] [PubMed] [Google Scholar]
- Yu C, Kastin AJ, Tu H, Pan W 2007 Opposing effects of proteasomes and lysosomes on LIFR: modulation by TNF. J Mol Neurosci 32:80–89 [DOI] [PubMed] [Google Scholar]
- von Bartheld CS 1998 Radio-iodination of neurotrophins and their delivery in vivo: advantages of membrane filtration and the use of disposable syringes. J Neurosci Methods 79:207–215 [DOI] [PubMed] [Google Scholar]
- von Bartheld CS 2001 Tracing with radiolabeled neurotrophins. Methods Mol Biol 169:195–216 [DOI] [PubMed] [Google Scholar]
- Pan W, Kastin AJ, Daniel J, Yu C, Basbaum A, Baryshnikova LM, von Bartheld CS 2007 TNF α trafficking in cerebral vascular endothelial cells. J Neuroimmunol 185:47–56 [DOI] [PMC free article] [PubMed] [Google Scholar]
- Matsuda J, Yokota I, Tsuruo Y, Murakami T, Ishimura K, Shima K, Kuroda Y 1999 Development changes in long-form leptin receptor expression and localization in rat brain. Endocrinology 140:5233–5238 [DOI] [PubMed] [Google Scholar]
- Hassink SG, de Lancey E, Sheslow DV, Smith-Kirwin SM, O’Connor DM, Considine RV, Opentanova I, Dostal K, Spear ML, Leef K, Ash M, Spitzer AR, Funanage VL 1997 Placental leptin: an important new growth factor in intrauterine and neonatal development? Pediatrics 100:E1 [DOI] [PubMed] [Google Scholar]
- Matsuda J, Yokota I, Iida M, Murakami T, Yamada M, Saijo T, Naito E, Ito M, Shima K, Kuroda Y 1999 Dynamic changes in serum leptin concentrations during the fetal and neonatal periods. Pediatr Res 45:71–75 [DOI] [PubMed] [Google Scholar]
- Hytinantti TK, Juntunen M, Koistinen HA, Koivisto VA, Karonen SL, Andersson S 2001 Postnatal changes in concentrations of free and bound leptin. Arch Dis Child Fetal Neonatal Ed 85:F123–F126 [DOI] [PMC free article] [PubMed] [Google Scholar]
- Carek PJ 2004 Integrating scholarly activity into residency training. Ann Fam Med 2:87–88 [PMC free article] [PubMed] [Google Scholar]
- Pan W, Banks WA, Fasold MB, Bluth J, Kastin AJ 1998 Transport of brain-derived neurotrophic factor across the blood-brain barrier. Neuropharmcol 37:1553–1561 [DOI] [PubMed] [Google Scholar]
- Pan W, Tu H, Kastin AJ 2006 Differential BBB interactions of three ingestive peptides: obestatin, ghrelin, and adiponectin. Peptides 27:911–916 [DOI] [PubMed] [Google Scholar]
- Pan W, Kastin AJ 2001 Diurnal variation of leptin entry from blood to brain involving partial saturation of the transport system. Life Sci 68:2705–2714 [DOI] [PubMed] [Google Scholar]
- Quinton ND, Smith RF, Clayton PE, Gill MS, Shalet S, Justice SK, Simon SA, Walters S, Postel-Vinay MC, Blakemore AI, Ross RJ 1999 Leptin binding activity changes with age: the link between leptin and puberty. J Clin Endocrinol Metab 84:2336–2341 [DOI] [PubMed] [Google Scholar]
- Kratzsch J, Lammert A, Bottner A, Seidel B, Mueller G, Thiery J, Hebebrand J, Kiess W 2002 Circulating soluble leptin receptor and free leptin index during childhood, puberty, and adolescence. J Clin Endocrinol Metab 87:4587–4594 [DOI] [PubMed] [Google Scholar]
- Kratzsch J, Schubring C, Stitzel B, Bottner A, Berthold A, Thiery J, Kiess W 2005 Inverse changes in the serum levels of the soluble leptin receptor and leptin in neonates: relations to anthropometric data. J Clin Endocrinol Metab 90:2212–2217 [DOI] [PubMed] [Google Scholar]
- Smith JT, Mark PJ, Waddell BJ 2005 Developmental increases in plasma leptin binding activity and tissue Ob-Re mRNA expression in the rat. J Endocrinol 184:535–541 [DOI] [PubMed] [Google Scholar]
- Gallardo N, Arribas C, Villar M, Ros M, Carrascosa JM, Martinez C, Andres A 2005 ObRa and ObRe are differentially expressed in adipose tissue in aged food-restricted rats: effects on circulating soluble leptin receptor levels. Endocrinology 146:4934–4942 [DOI] [PubMed] [Google Scholar]
- Udagawa J, Hatta T, Naora H, Otani H 2000 Expression of the long form of leptin receptor (Ob-Rb) mRNA in the brain of mouse embryos and newborn mice. Brain Res 868:251–258 [DOI] [PubMed] [Google Scholar]


